?Mathematical formulae have been encoded as MathML and are displayed in this HTML version using MathJax in order to improve their display. Uncheck the box to turn MathJax off. This feature requires Javascript. Click on a formula to zoom.
Abstract
This study aimed to analyze the relationship between the director pay slice and firm financial performance. This study used 1024 observations from companies listed on the Indonesia Stock Exchange from 2011 to 2019. The analytical technique used in this study was ordinary least square regression with a cluster model approach and fixed effects using the STATA 16.0 software. This study partially found that director pay slice and the existence of a remuneration committee are positively and significantly related to the company’s current and future performance. Furthermore, this study indicates that companies with a high director pay slice and remuneration committees tend to have a better level of performance because the presence of a remuneration committee helps to align the relationship between the director pay slice and firm financial performance. This study has implications for developing countries regarding effective corporate governance by analyzing the governance in Indonesia. Our study’s overarching goal was to understand the relationship between the director’s pay slice and the firm’s financial performance through the overall analysis.
PUBLIC INTEREST STATEMENT
This paper the relationship between the director pay slice and firm financial performance. This study used 1024 observations from companies listed on the Indonesia Stock Exchange from 2011 to 2019. The analytical technique used in this study was ordinary least square regression with a cluster model approach and fixed effects using the STATA 16.0 software. This study partially found that director pay slice and the existence of a remuneration committee are positively and significantly related to the company’s current and future performance. Furthermore, this study indicates that companies with a high director pay slice and remuneration committees tend to have a better level of performance because the presence of a remuneration committee helps to align the relationship between the director pay slice and firm financial performance. This study has implications for developing countries regarding effective corporate governance by analyzing the governance in Indonesia. Our study’s overarching goal was to understand the relationship between the director’s pay slice and the firm’s financial performance through the overall analysis.
1. Introduction
Previous research related to CEO (Chief Executive Officer) power has used CEO Pay Slice (CPS) as a measurement. CPS has the value of simplicity and applicability when applied to empirical questions in corporate governance. The development of research related to CPS has increased along with the problems to do with CEO compensation. Against the backdrop of corporate scandals and governance failures plaguing companies worldwide, the growth of CEO compensation has placed executive compensation at the center of discussions about corporate governance (Choe et al., Citation2014).
CPS only captures the power of individual CEOs. In some cases, this may be relevant because some CEOs may be superior when compared to the other executive teams. The research conducted by Velte (Citation2020) states that if the CEO’s compensation contract is different from that of the other executive directors and the amount is much higher, it reflects the increasing power of the CEO. The dimensions of incentives and power can be simultaneously effective in relation to the individual CEO compensation variable. If the focus is on CPS in a one-tier board system, then in a two-tier board system, CPS is not relevant to use because of the system differences. In the two-tier board system, the collective strength of the board of directors becomes relevant for further research, which in this study will be shown through the Director Pay Slice (DPS). This is a fraction of the compensation of the directors compared to the overall compensation of the board of directors and commissioners. The higher the proportion of the directors’ compensation, the higher the strength of the board of directors compared to the board of commissioners.
Archival research examining the effect of CPS on corporate performance documents provides minimal and mixed findings, leading to a complex and incomplete understanding of the impact of having a high CPS. CPS is known to be negatively related to profitability. In addition, firms with high CPS tend to have industry-adjusted operating income to asset ratios (Bebchuk et al., Citation2011). On the other hand, the company can deliberately set a high CPS to motivate the CEO and other top executives. The CEO is motivated to be a good steward and makes every effort to ensure the continuance of the successful firm financial performance to maintain their reputation (Gibbons & Murphy, Citation1992). Therefore, a high CPS will result in a higher level of firm financial performance (Hu et al., Citation2013). Based on this explanation, this study also argues that companies with a high DPS will also have better level of firm financial performance. In addition, a high DPS will encourage the board of directors to encourage better firm financial performance.
The scheme of the relationship between compensation and firm financial performance was chosen to be analyzed in this study. This is based on agency theory where compensation is a tool to help align the interests of the managers and shareholders (Jensen & Zimmerman, Citation1985). The empirical evidence also found that the CEOs put more of an effort into achieving the company’s operational goals and objectives if given adequate incentives beforehand (Aslam et al., Citation2019). In addition, Aslam et al. (Citation2019) also found that the remuneration committee considered past compensation as a reference when setting the current compensation instead of using the company’s past performance.
The importance of compensation for the company is the initial driver of the emergence of a remuneration committee. With the existence of a remuneration committee, it is hoped that the committee can determine the appropriate compensation and improve firm financial performance. A remuneration committee within a company has a positive relationship with firm financial performance (Agyemang-Mintah, Citation2016). This indicates that the committee can research, monitor the process, and advise the executive management on any compensation decisions. The existence of a remuneration committee is expected to provide adequate remuneration to the company boards that will in turn provide incentives for them to maximize the firm financial performance (Harymawan et al., Citation2020). In addition, a remuneration committee is expected to reduce any agency conflicts that occur in the company.
This study provides an update by discussing the pay slice of the board of directors or DPS in a country with a two-tier board system, specifically Indonesia. This is due to the differences in the governance system used, causing differences in the way that the executive compensation is disclosed. This research also complements the previous research on executive compensation in Indonesia which was only previously conducted on banking companies (Chou & Buchdadi, Citation2018). This study used all of the companies listed on the Indonesia Stock Exchange except for the companies in the financial sector for the period 2011–2019.
This study indicates that companies that have a high DPS and a RNC have a better current firm financial performance. Furthermore, companies that have a high DPS and a RNC have a better future firm financial performance. However, these results do not show any differences in the results found when measuring firm financial performance using accounting-based consist of Return on Asset (ROA), Return on Equity (ROE), Return on Asset using Earnings before Tax (ROAEBIT), and Return on Equity using Earnings Before Tax (ROEEBIT) and marketing-based methods (Tobin’s Q) both for the current situation and in the future.
In Section II, we present the brief background and history of remuneration and describe the hypothesis development. Section III provides a discussion of the method. We present our analysis in Section IV and discuss the related implications for board remuneration and firm financial performance. Section V concludes and provides suggestions for future research.
2. Literature review
2.1. Institutional setting
In Indonesia, disclosure related to executive compensation is still not required. This means that not all companies mention the amount of compensation provided in their annual reports. In addition, the disclosure of executive compensation in Indonesia is also limited to the total compensation of the entire board of directors or to the total compensation of the entire board of commissioners and the total amount of compensation from the two boards together.
In Indonesia, the remuneration committee is integrated with the nomination and remuneration committees. This committee plays an important role in determining the company’s management compensation. Based on the Financial Services Authority Regulation Number 34/POJK.04/2014 concerning the Nomination and Remuneration Committee of Issuers or Public Companies, it is stated that the nomination and remuneration committee is a committee formed by and responsible to the board of commissioners, helping them to carry out the functions and duties of the board of commissioners related to the nomination and remuneration of and for the members of the board of directors and the members of the board of commissioners. Companies that go public are required to have a nomination and remuneration function, which began in 2015.
2.2. Optimal contracting theory
Optimal contracting theory suggests that managerial compensation is a tool that encourages managers to act in the best interests of shareholders, thereby reducing agency problems (Grossman & Hart, Citation1983; Holmstrom, Citation1979). Based on the optimal contract perspective, agency-based models generally argue that an intensive compensation structure becomes an incentive that minimizes agency costs (Kumar & Sivaramakrishnan, Citation2008). From this optimal contracting perspective, it is assumed that the board and compensation committee will design managerial compensation to maximize shareholder value.
The optimal contracting model predicts that the compensation provided will not vary in a direction consistent with the degree of independence in the salary setting process (Core et al., Citation1999). This is not because the board’s composition is irrelevant but because it is based on the selection of shareholders who control the board and the remuneration committee that will result in an optimal contract.
It is difficult to determine whether the observed compensation contract can optimally address the problem between the principal and the agent. Board compensation may be related to firm performance for reasons other than providing incentives, such as attracting talented executives to the firm (Lazear, Citation2004) and efficient bargaining over corporate profits (Blanchflower et al., Citation1996). However, by looking at the proportion of compensation given to directors and commissioners, it will at least be known whether the allocation of company resources provided by the company has been optimally following the goals and performance of the resulting company.
Research in the US has only provided evidence for a one-tier board system. So far, there has been almost no systematic empirical analysis of the problems in setting up a two-tier board system. In contrast, the internal governance in the two-tier board system is significantly different from the one-tier board system (Jungmann, Citation2007). The basic difference between the two arrangements is that executive control in a two-tier board system is delegated to a separate supervisory board. In contrast, in a one-tier board system, it becomes part of the board’s task. Given these differences, there is a conceptual debate about the optimal director compensation in a two-tier board system.
2.3. Hypothesis development
2.3.1. Director pay slice and firm financial performance
DPS and CPS are the same measurements that are calculated based on executive compensation. DPS is a development of the CPS measurement previously conducted in many countries with a one-tier board system that is different from a two-tier board system. The research related to CPS is the basis of the formation of the hypotheses included in this study. Hu et al. (Citation2013) found that CPS is positively related to firm performance. High CPS is also intended to increase the company results (Edmans & Gabaix, Citation2011). Based on this evidence, DPS is also expected to result in a good level of performance in the company. The evidence regarding the overall compensation also found that executive compensation positively correlates with firm financial performance (Aggarwal & Ghosh, Citation2015; Aslam et al., Citation2019; Harymawan et al., Citation2020). This aligns with the optimal contract perspective, agency-based models, which argue that an intensive compensation structure becomes an incentive that minimizes agency costs (Kumar & Sivaramakrishnan, Citation2008).
Other evidence also suggests that the directors will be motivated to be good stewards and make every effort to ensure the success of the firm financial performance as they maintain their own reputation (Gibbons & Murphy, Citation1992). Therefore, when the shareholders have given their trust through the compensation provided, the board of directors should also do their best.
The board of commissioners’ compensation was previously found to be positively related to firm financial performance (Harymawan et al., Citation2020). Unlike the board of commissioners whose job it is to supervise, the board of directors makes decisions on all matters relating to the company’s management. Therefore, it is very important to pay attention to its decisions when it comes to allocating the appropriate proportions of compensation to the directors and commissioners.
Based on the explanation above, the hypothesis formulated is that the company deliberately decides to set a high DPS to motivate the board of directors, which will then improve the company’s performance. A high DPS may reflect the presence of more capable directors. It is expected that there will be a positive relationship with firm financial performance and vice versa if a high DPS indicates low performance. This may be due to a failure in governance.
This study divides the company according to its accounting-based (ROA and ROE) and marketing-based (Tobin’s Q) performance. The results of the studies that depend on accounting-based performance are different from the results of the studies that rely on market measurements. This is because of the lack of data received by investors (Hamdan, Citation2018). As a result, the market performance is negatively or positively affected at different times to the firm’s actual performance. Aslam et al. (Citation2019)) previously analyzed the relationship between the directors’ compensation and firm financial performance and found there to be a positive relationship between the two. To that end, this study used two measurements better to understand the relationship between DPS and firm financial performance. The statement that compensation will be determined optimally to unite the interests of managers and shareholders (Grossman & Hart, Citation1983; Holmstrom, Citation1979; Kalyta, Citation2008) will be seen on a short-term and future basis.
H1: There is no relationship between the Director Pay Slice and the firm’s financial performance.
2.3.2. Director pay slice, the remuneration committee and firm financial performance
The remuneration committee, which is a sub-committee under the board of commissioners, assesses the executive’s performance and then determines the appropriate compensation package and reports it to the board of commissioners. The establishment of a remuneration committee can play an important role in determining the executive compensation required to align the interests of both the shareholders and managers by providing appropriate information to the company’s board. Aggarwal and Ghosh (Citation2015) found that board independence is positively related to firm financial performance in countries where poor investor protection results in a concentrated ownership structure. Remuneration committees where there is high quality corporate governance, as measured by the ratio of independent board members, should be able to align better executive incentives with the rights of all stakeholders, including minority shareholders and depositors.
Furthermore, the previous research found evidence that risk and the compensation committee composition are both positively associated with risk, which in turn its associated with firm financial performance (Tao & Hutchinson, Citation2013). These results are also supported by the findings of Harymawan et al. (Citation2020) and Chou and Buchdadi (Citation2018) who found that companies that have nomination and remuneration committees make more effective remuneration packages that lead to higher firm financial performance. This result is stronger evidence of the combined impact of the remuneration committee and compensation package leading to higher firm financial performance.
Similar to the explanation given in H1, this study divides the company’s performance based on accounting-based (ROA and ROE) and marketing-based (Tobin’s Q) methods. The results of the studies that depend on accounting-based performance are different from the results of the studies that rely on market measurements. This is because of the lack of data received by investors (Hamdan, Citation2018). As a result, market performance is negatively or positively affected at different times by the company’s actual performance. For this reason, the study uses two measurements to understand the moderating impact of the existence of a remuneration committee on the relationship between DPS and firm financial performance.
H2: The Remuneration Committee does not moderate the relationship between the Director Pay Slice and the firm’s financial performance
3. Research method
3.1. Sample and sources of the data
We used a sample that consist of listed firm on the Indonesia Stock Exchange for 2011–2019. The data on remuneration and the existence of a remuneration committee were collected manually from the annual reports. The data on the control variables was collected from the OSIRIS database. We applied the sample selection criteria to reach our final sample. We used all industries for our sample. We excluded any missing variables. After applying the criteria, our final sample included 1024 firm-year observations. We winsorized all of the continuous variables at the 1st and 99th percentiles to mitigate the undesirable influence of outliers. We do this winsorized process to reduce normality problems.
3.2. Operational definition and variable measurement
The variables used in this study were firm financial performance, the director pay slice, and the existence of a remuneration and nomination committee (RNC). The measurement of firm financial performance (PERF) used Return on Assets and income after tax (ROA; Agyemang-Mintah, Citation2016; Aslam et al., Citation2019; Harymawan et al., Citation2020). Return on Equity used income after tax (ROE; Harymawan et al., Citation2020) and Return on Assets used income before tax and interest (ROAEBIT; Ahmed, Citation2010). Return on Equity used income before tax and interest (ROEEBIT) (Detthamrong et al., Citation2017) and Tobin’s Q (Aggarwal & Ghosh, Citation2015; Aslam et al., Citation2019; Harymawan et al., Citation2020; Tarkovska, Citation2017). Director pay slice was measured using the proportion of the director’s total compensation divided by the total compensation of the directors and commissioners. RNC was measured using a dummy variable and it was coded 1 if a company disclosed the existence of a stand-alone RNC and 0 otherwise.
We followed the previous literature when it came to using control variables (Chauhan et al., Citation2016; Dutton & Duncan, Citation1987; Harymawan et al., Citation2020; Hu et al., Citation2013; Tarkovska, Citation2017). The control variables include the proportion of independent directors (INDCOM), board size (BSIZE), company growth (GROWTH), capital intensity (CAPINT), firm size (FSIZE) and leverage (LEV). INDCOM is the proportion of the number of independent commissioners to the number of commissioners in the company. BSIZE is the total number of directors and commissioners in the company. LOSS is proxied through a dummy variable with a score of 1 if the company suffered a loss in the previous year and 0 otherwise, GROWTH is the percentage of this year’s sales minus the previous year’s sales scaled by the previous year’s sales. CAPINT was measured using fixed assets divided by total assets. FSIZE is the natural logarithm of the total assets. LEV is the ratio of current liabilities to total assets. All of the variables used in this article have been summarized in .
Table 1. Variable operational definition
3.3. Methodology
We used ordinary least square regression with a year-industry fixed effect and clustered standard errors to test our hypotheses. We also employed coarsened exact matching. The software used in this research was STATA 14.0. We used two different research models to test our hypotheses. The first research model (1) was used to test hypothesis 1A, model (2) was used to test hypothesis 1B, model (3) was used to test hypothesis 2A, and model (4) was used to test hypothesis 2B.
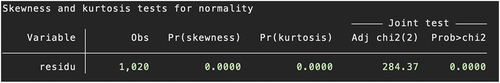
Gujarati (Citation2003) states that if we are dealing with a minor or limited sample size, say data of less than 100 observations, the assumption of normality assumes an important role. On the other hand, if the sample size is large enough, we may be able to relax the assumption of normality. Furthermore, from the central limit theorem, it is known that if there are a large number of independent random variables and identically distributed, then, with a few exceptions, their sum distribution tends to a normal distribution because of the number of these variables increases indefinitely. With the number of samples that we use, which is more than 100, it can be said that our selection tends to be normally distributed.
4. Results and discussion
4.1. Descriptive statistics
Based on the results of the sample selection, the observations obtained in this study totaled 1024 observations. We present a table regarding the criteria for selecting the research sample in . shows the distribution of the sample by industry and year of observation. When viewed based on industrial sector, the highest number of observations was in the SIC2 section with 185 observations, followed by SIC4 with 200 observations, and SIC1 with 184 observations. This shows that the research sample is dominated by companies in the construction, transportation, communication, and utility industries, followed by agriculture, forestry, and fisheries. Furthermore, when viewed based on the year of observation, the highest number of observations was in 2018 at 166 observations, while the fewest observations were made in 2011 and 2011, totaling 50 observations.
Table 2. Sample selection criteria
Table 3. Sample distribution by industry
presents the information on the descriptive statistical results of the research variables for the 2011–2019 observation period.
Table 4. Descriptive statistics
shows the results of the Pearson correlation test. The results show there to be a relationship between the DPS variables and ROA, ROE, ROAEBIT, ROEEBTI, and TOBINSQ. The relationship between the variables RNC and ROA, ROE, ROAEBIT, ROEEBIT, and TOBINSQ was found to be significantly positive. This shows that companies that have RNC have a better level of performance. On the other hand, the relationship between INDCOM and ROA, ROE, ROAEBIT, ROEEBIT, and TOBINSQ showed significant negative results. This table shows that even when the proportion of independent commissioners in the company is greater, the company’s performance does not get better.
Table 5. Pearson correlation
shows the independent t-test conducted on the group of companies that have RNC and companies that do not have RNC. The results show that DPS is significantly different for companies with RNC and companies that do not have RNC. Companies with RNC have a higher level of performance than companies without RNC.
Table 6. Independent T-Test
5.2. Main result
The analysis results in Table show there to be a positive relationship between DPS and firm financial performance as measured using ROA, ROE, ROAEBIT and ROEEBIT. The positive relationship between DPS and ROA has a coefficient value of 3,735 and it is significant at the 1% level. The positive relationship between DPS and ROE has a coefficient value of 7.262 and it is significant at the 10% level. DPS is also significantly positively related to ROAEBIT and ROEEBIT with coefficients of 5,304 and 10,988, and they are significant at 1% and 5%. Finally, the positive relationship between DPS and TOBINSQ does not show as having a significant relationship.
Table 7. Baseline regression results of DPS on performance
These results support agency theory where compensation policies encourage the executives to act on behalf of their shareholders to provide the best managerial performance (Murphy, Citation1986). These results are also in accordance with the previous research conducted by Hu et al. (Citation2013), which found that CPS was positively related to firm financial performance. High CPS is also intended to increase the company results (Edmans & Gabaix, Citation2011). Based on this evidence, it is shown that DPS can also facilitate good performance in the company. These results are also supported by evidence regarding overall compensation, which also finds that executive compensation has a positive correlation with firm financial performance (Aggarwal & Ghosh, Citation2015; Aslam et al., Citation2019; Harymawan et al., Citation2020).
also shows there to be a significant positive relationship between RNC and firm financial performance as measured using ROA with a significance level of 5%, ROAEBIT with a significance level of 1%, and ROEEBIT with a significance level of 5%. However, this relationship was not found in the performance measurement using ROE and TOBINSQ.
These results support the findings of Cybinski and Windsor (Citation2013) which states that the remuneration committee can align the CEOs remuneration with firm financial performance. The remuneration committee will align the agent’s incentives with the principal goal. The existence of the remuneration committee is able to design the remuneration in such a way as to motivate the board of directors and executives to produce the best decisions. This can have an impact on the firm financial performance (Ahmed, Citation2010; Chizema et al., Citation2014). The remuneration committee oversees and advises the executive management on compensation decisions that ultimately lead to better performance (Agyemang-Mintah, Citation2016; Ahmed, Citation2010).
The direction of the relationship of the control variables in shows the same results as the results in . The control variables consisting of LNBSIZE, GROWTH and FSIZE have a significant positive relationship with the company’s performance according to the 5 measurements. On the other hand, INDCOM and CAPINT are significantly negatively related to all measures of firm financial performance. LAGLOSS and LEV were significantly negatively related to ROA, ROE, ROAEBIT and ROEEBIT but were significantly positively related to TOBINSQ.
Based on the results presented in , there is a positive relationship between DPS and firm financial performance in the future but only for the measurements using ROE and TOBINSQ. The positive relationship between DPS and ROE has a coefficient value of 11,927 and is significant at the 1% level. The positive relationship between DPS and TOBINSQ has a coefficient value of 0.085 and is significant at the 1% level. DPS was not found to have a significant positive relationship with ROA, ROAEBIT, and ROEEBIT. Through ordinary least square regression, the analysis shows that DPS has a positive and significant relationship with firm financial performance for all firm financial performance measurements in the future. This means that the higher the DPS given, the higher that the company’s performance in the future will be.
Table 8. Regression results of DPS on lead performance
also shows there to be a significant positive relationship between RNC and future firm financial performance as measured by ROA with a significance level of 5%, ROAEBIT with a significance level of 1%, and ROEEBIT with a significance level of 1%. However, this relationship was not found in the performance measurement using ROE and TOBINSQ.
There were different results found when measuring the firm financial performance using both accounting-based (ROA and ROE) and marketing-based (Tobin’s Q) methods for now and in the future. In the previous results, it is known that DPS is not significantly related to the company’s current performance as measured using TOBINSQ but it does have a significant positive relationship with future firm financial performance as measured by TOBINSQ. This proves that accounting-based performance is different from the results of the studies that depend on market measurements due to the lack of data received by investors (Hamdan, Citation2018).
5.3. Robustness analysis
To ensure the hypothesis testing results in our model, we also tested using Coarsened Exact Matching as presented in . The results of the analysis in show consistent results with the results in .
Table 9. Coarsened exact matching
5.4. Additional analysis
The results in have been used to answer Hypothesis 2. Based on the results presented in , it is known that a higher DPS level is associated with the higher performance in companies that already have a remuneration committee. These results were obtained by examining the company’s current performance using ROA with a coefficient of 7,434 that was significant at the 5% level, ROE with a coefficient of 31,669 that was significant at the 1% level, ROAEBIT with a coefficient of 9,421 that was significant at the 5% level, and ROEEBIT with a coefficient of 38,973 that was significant at the 1% level. However, this relationship was not found in the company’s performance measurement using TOBINSQ.
Table 10. Regression result on the interaction of DPS and RNC to firm financial performance
The results of this study indicate that companies with a high DPS and RNC will have a higher current firm financial performance using the ROA, ROE, ROAEBIT, and ROEEBIT measurements but not for the TOBINSQ measurement. These results also support the findings of Harymawan et al. (Citation2020) and Chou and Buchdadi (Citation2018) who found that companies that have nomination and remuneration committees make more effective remuneration packages that leads to a higher level of firm financial performance.
The results in were used to answer Hypothesis 2. Based on the results presented in , it is known that a higher DPS level is associated with a higher future performance in companies that already have a remuneration committee. These results were obtained using the company’s performance in the future using ROA with a coefficient of 7,912 that was significant at the level of 10%, ROE with a coefficient of 26,518 that was significant at the 1% level, ROAEBIT with a coefficient of 10,573 that was significant at the 5% level, and ROEEBIT with a coefficient of 34,731 that was significant at the 1% level. However, this relationship was not found when measuring the company’s performance in the future using TOBINSQ.
Table 11. Regression result on the interaction of DPS and RNC to future firm financial performance
The same results also show that companies with a high DPS and RNC will have a higher level of firm financial performance in the future using the ROA, ROE, ROAEBIT, and ROEEBIT measurements but not for TOBINSQ. Based on these results, H2B is accepted. From these results, it can be seen that there are no differences in the results found when measuring firm financial performance using either accounting-based (ROA and ROE) and marketing based (Tobin’s Q) methods for both now and in the future.
This study performed an additional analysis to determine whether there are differences in the results caused by the period of the company’s obligation to have a nomination and remuneration function. shows that the overall number of companies that have RNCs has increased. The number of companies with the least RNCs was found in 2011 totaling 12 companies and the most was in 2019 totaling 94 companies. However, when viewed in total, the number of companies that do not have RNC is still more than the companies that have RNC.
Table 12. Sample distribution by RNC
Based on the results presented in Panel A for the 2010–2014 sub-sample, it is known that there is a positive relationship between DPS and current firm financial performance but only for measurements using ROA, ROEEBIT, and TOBINSQ. The positive relationship between DPS and ROA has a coefficient value of 4,997 and it is significant at the 10% level. The positive relationship between DPS and ROAEBIT has a coefficient value of 6.990 and is significant at the 10% level. The positive relationship between DPS and TOBINSQ has a coefficient value of 0.135 and is significant at the 5% level. DPS was not found to have a significant positive relationship with ROE and ROEEBIT. No significant relationship was found between RNC and current firm financial performance for all of the measurements used.
Table 13. Regression result on the DPS to firm financial performance based on sub-sample years obligation of existence of RNC function
The results presented in Panel B for the 2015–2019 sub-sample show there to be a positive relationship between DPS and current firm financial performance but only for the measurements using ROA and ROEEBIT. The positive relationship between DPS and ROA has a coefficient value of 3,372 and is significant at the 10% level. The positive relationship between DPS and ROEEBIT has a coefficient value of 4,924 and is significant at the 10% level. DPS was not found to have a significant relationship with ROE, ROAEBIT, and TOBINSQ. Furthermore, RNC was also found to be significantly positively correlated with firm financial performance as measured by ROA, ROAEBIT, and ROEEBIT in Panel B.
Based on the results presented in Panel A, it is known that a higher DPS level is associated with a higher current performance in companies that already have a remuneration committee. These results are obtained based on the company’s current performance using ROA with a coefficient of 20,926 that is significant at the 5% level, ROE with a coefficient of 46,334 that is significant at the 10% level, and ROAEBIT with a coefficient of 26,588 that is significant at the 5% level. However, this relationship was not found in the company’s performance measurements using ROEEBIT and TOBINSQ.
Table 14. Regression result on the interaction of DPS and RNC to firm financial performance based on sub-sample years obligation of existence of RNC function
Based on the results presented in Panel B, it is known that a higher DPS level is associated with a higher level of performance in companies that already have a remuneration committee. The results were obtained using the company’s current performance using ROE with a coefficient of 36,640 that is significant at the 1% level, and ROEEBIT with a coefficient of 46,328 that is significant at the 1% level. However, this relationship was not found in the company’s performance measurement using ROA, ROAEBIT, and TOBINSQ.
This study also undertook an additional analysis in the form of change analysis to ensure that the company’s performance in year t + 1 was not affected by changes in the DPS and changes in the existence of the remuneration committee. Based on the results presented in , it is known that the changes in DPS are not significantly related to all of the firm financial performance measurements. This provides additional evidence that the increase in firm financial performance is not due to an increase in DPS.
Table 15. Regression result on the DPS and RNC to firm financial performance based on change analysis
5. Conclusion
This study aimed to analyze the relationship between DPS and firm financial performance in companies listed on the Indonesian Stock Exchange for the 2010–2019 period. Based on the results of the analysis and discussion described in the previous chapter, there are several conclusions that can be drawn. First, the higher the DPS given, the higher the company’s current performance. This result is in line with previous research, which found a positive relationship between CPS and firm financial performance (Hu et al., Citation2013). This finding also supports the Optimal contracting theory, which suggests that managerial compensation is a tool that encourages managers to act in the best interests of shareholders, thereby reducing agency problems (Grossman & Hart, Citation1983; Holmstrom, Citation1979). In addition, a high DPS is also a driver of the company’s performance in the future. Second, the existence of RNC is also a driver of better firm financial performance both now and in the future. This finding supports the finding that the remuneration committee can align the CEO’s remuneration with the company’s financial performance (Cybinski & Windsor, Citation2013).
Companies that have a high DPS and a RNC have a better current firm financial performance. Furthermore, companies that have a high DPS and a RNC have a better future firm financial performance. However, these results do not show there to be any differences in the results found when measuring firm financial performance using accounting-based (ROA, ROE, ROAEBIT, and ROEEBIT) and marketing-based (Tobin’s Q) methods both for the now and in the future.
The results of this study provide several contributions both theoretically and practically. For policymakers, it is advisable that when auditing, it is necessary to enforce a mandatory remuneration committee for all companies listed on the Indonesian Stock Exchange. Shareholders must remain careful when determining the compensation package given to the company’s board. This is because the information held by the shareholders may be different from the actual condition of the company. Further research can conduct research using different firm financial performance measurements. Second, further research can examine the relationship between DPS and long-term firm financial performance.
The limitation in this study is that the executive compensation data is still limited because there are no mandatory regulations about remuneration disclosure. As for the limitations, the researcher suggests that several things that can be done in future research to improve the quality of said research. The first is to use other data centers to complement the data on the Indonesian public companies. The second is to use data access related to other executive compensation to find out the level of executive compensation in public companies in Indonesia.
Disclosure statement
No potential conflict of interest was reported by the author(s).
Additional information
Funding
Notes on contributors
Nadia Klarita Rahayu
Nadia Klarita Rahayu is a student at the Department of Accounting, Universitas Airlangga.
Iman Harymawan
Iman Harymawan is an Assistant Professor in the Faculty of Economics and Business, Universitas Airlangga, Indonesia. He obtained his PhD (2016) from City University of Hong Kong. His current research focuses include corporate governance issues, political and military connections in business, and financial reporting.
Mohammad Nasih
Mohammad Nasih is a senior lecturer in the Department of Accounting, Faculty of Economics and Business, Universitas Airlangga, Indonesia. He obtained his doctoral degree in accounting from the Universitas Airlangga in Indonesia, master degree from Institut Teknologi Bandung in Indonesia, and his B.A. degree in accounting from Universitas Airlangga in Indonesia. His current research focuses include corporate governance issues, the accounting impact of political and military connections in business, and financial reporting. He has published several articles in top peer reviewed accounting journals, among others, Risks, International Journal of Managerial Finance.
John Nowland
John Nowland is an Associate Professor in the Department of Accounting, Illinois State University. He completed his PhD studies at the University of Queensland in Australia. He has experience working at universities in Australia, Hong Kong and Taiwan. He has also worked in the media, government and banking sectors. His research focuses on corporate governance issues, such as board of director composition and performance.
References
- Aggarwal, R., & Ghosh, A. (2015). Director’s remuneration and correlation on firm’s performance: A study from the Indian corporate. International Journal of Law and Management, 57(5), 373–24. https://doi.org/10.1108/IJLMA-08-2011-0006
- Agyemang-Mintah, P. (2016). Remuneration Committee governance and firm performance in UK financial firms. Investment Management and Financial Innovations, 13(1), 176–190. https://doi.org/10.21511/imfi.13(1-1).2016.05
- Ahmed, H. J. A. (2010). Impact of independent directors and remuneration committee on firm performance? Evidence from Malaysian capital market. Impact of Independent Directors and Remuneration Committee on Firm Performance? Evidence from Malaysian Capital Market, 8(1), 222–225. https://doi.org/10.22495/cocv8i1c1p6
- Aslam, E., Haron, R., & Tahir, M. N. (2019). How director remuneration impacts firm performance: An empirical analysis of executive director remuneration in Pakistan. Borsa Istanbul Review, 19(2), 186–196. https://doi.org/10.1016/j.bir.2019.01.003
- Bebchuk, L. A., Cremers, K. J. M., & Peyer, U. C. (2011). The CEO pay slice. Journal of Financial Economics, 102(1), 199–221. https://doi.org/10.1016/j.jfineco.2011.05.006
- Blanchflower, D. G., Oswald, A. J., & Sanfey, P. (1996). Wages, profits, and rent-sharing. Quarterly Journal of Economics, 111(1), 227–251. https://doi.org/10.2307/2946663
- Chauhan, Y., Lakshmi, K. R., & Dey, D. K. (2016). Corporate governance practices, self-dealings, and firm performance: Evidence from India. Journal of Contemporary Accounting & Economics, 12(3), 274–289. https://doi.org/10.1016/j.jcae.2016.10.002
- Chizema, A., Liu, X., Lu, J., & Gao, L. (2014). Politically connected boards and top executive pay in Chinese listed firms. Strategic Management Journal, 36(6), 890–906. https://doi.org/10.1002/smj.2253
- Choe, C., Tian, G. Y., & Yin, X. (2014). CEO power and the structure of CEO pay. International Review of Financial Analysis, 35(C), 237–248. https://doi.org/10.1016/j.irfa.2014.10.004
- Chou, T. K., & Buchdadi, A. D. (2018). Executive’s compensation, good corporate governance, ownership structure, and firm performance: A study of listed banks in Indonesia. Journal of Business and Retail Management Research, 12(3), 79–91. https://doi.org/10.24052/jbrmr/v12is03/art-07
- Core, J. E., Holthausen, R. W., & Larcker, D. F. (1999). Corporate governance, chief executive officer compensation, and firm performance. Journal of Financial Economics, 51(3), 371–406.
- Cybinski, P., & Windsor, C. (2013). Remuneration committee Independence and CEO remuneration for firm financial performance. Accounting Research Journal, 25(3), 197–221. https://doi.org/10.1108/ARJ-08-2012-0068
- Detthamrong, U., Chancharat, N., & Vithessonthi, C. (2017). Corporate governance, capital structure and firm performance: Evidence from Thailand. Research in International Business and Finance, 42, 689–709.
- Dutton, J., & Duncan, R. (1987). The influence of strategic planning on strategic change. Administrative Science Quarterly, 31(2), 43–55. https://doi.org/10.1002/smj.4250080202
- Edmans, A., & Gabaix, X. (2011). Tractability in incentive contracting. Review of Financial Studies, 24(9), 2865–2894. https://doi.org/10.1093/rfs/hhr044
- Gibbons, R., & Murphy, K. J. (1992). Optimal incentive contracts in the presence of career concerns: Theory and evidence. Journal of Political Economy, 100(2), 468–505. https://doi.org/10.1086/261826
- Grossman, S., & Hart, O. D. (1983). An analysis of principal-agent problem. Econometrica, 51(1), 7–45. https://doi.org/10.2307/1912246
- Gujarati, D. N. (2003). Basic Econometrics (Forth ed.). McGraw-Hill.
- Hamdan, A. (2018). Intellectual capital and firm performance. International Journal of Islamic and Middle Eastern Finance and Management, 11(1), 139–151. https://doi.org/10.1108/IMEFM-02-2017-0053
- Harymawan, I., Agustia, D., Nasih, M., Inayati, A., & Nowland, J. (2020). Remuneration committees, executive remuneration, and firm performance in Indonesia. Heliyon, 6(2), e03452. https://doi.org/10.1016/j.heliyon.2020.e03452
- Holmstrom, B. (1979). Moral Hazard and Observability. The Bell Journal of Economics, 10(1), 74–91. https://doi.org/10.2307/3003320
- Hu, F., Pan, X., & Tian, G. (2013). Does CEO pay dispersion matter in an emerging market? Evidence from China’s listed firms. Pacific-Basin Finance Journal, 24(C), 235–255. https://doi.org/10.1016/j.pacfin.2013.07.003
- Jensen, M. C., & Zimmerman, J. L. (1985). Management compensation and the managerial labor market. Journal of Accounting and Economics, 7(1–3), 3–9. https://doi.org/10.1016/0165-4101(85)90025-4
- Jungmann, C. M. (2007). The effectiveness of corporate governance in one-tier and two-tier board systems - evidence from the UK and Germany. European Company and Financial Law Review, 3(4), 426–474. https://doi.org/10.1515/ECFR.2006.019
- Kalyta, P. (2008). Compensation transparency and managerial opportunism: A study of supplemental retirement plans. Strategic Management Journal, 30(4), 405–423. https://doi.org/10.1002/smj.737
- Kumar, P., & Sivaramakrishnan, K. (2008). Who monitors the monitor? the effect of board independence on executive compensation and firm value. The Review of Financial Studies, 21(3), 1371–1401.
- Lazear, E. P. (2004). Output-based pay: Incentives or sorting? In S. W. Polachek (Ed.), Research in labor economics. accounting for worker well-being (Vol. 23, pp. 1–25). JAI Press Inc.
- Murphy, K. J. (1986). Incentives, learning, and compensation: A theoretical and empirical investigation of managerial labor contracts. The Rand Journal of Economics, 17(1), 59–76. https://doi.org/10.2307/2555628
- Tao, N. B., & Hutchinson, M. (2013). Corporate governance and risk management: The role of risk management and compensation committees. Journal of Contemporary Accounting & Economics, 9(1), 83–99.
- Tarkovska, V. V. (2017). CEO pay slice and firm value: Evidence from UK panel data. Review of Behavioral Finance, 9(1), 43–62. https://doi.org/10.1108/RBF-12-2014-0053
- Velte, P. (2020). Does CEO power moderate the link between ESG performance and financial performance? A focus on the German two-tier system. Management Research Review, 43(5), 497–520. https://doi.org/10.1108/MRR-04-2019-0182
Appendix