
 ?Mathematical formulae have been encoded as MathML and are displayed in this HTML version using MathJax in order to improve their display. Uncheck the box to turn MathJax off. This feature requires Javascript. Click on a formula to zoom.
Abstract
The main aim of the research was to analyze economic evaluation and determinants of willingness to pay decisions for efficient irrigation water use improvement. Use for this purpose total of 300 HHs was selected using the Multi-stage sampling technique. The collected data was analyzed using econometrics model. In the econometric part, a seemingly unrelated bivariate probit model was applied to estimate households’ mean willingness to pay and its determinant’s for efficient irrigation water use. Leads by a double bounded dichotomous choice method. From seemingly unrelated bivariate probit model regression results, the mean and aggregate willingness to pay off the households 950.7 ETB (€25.7) per month per household per hectare was 1087159.09 ETB (€29382.7) per month and (12*1087159.09 = 13045909.08 ETB per year) respectively. The Mean and aggregate willingness to pay from the open-ended questions to be 926.059 ETB (€25.03) per month per household per hectare was 1072990.52 ETB (€28,999.74) per month respectively also, The bivariate probit model result revealed that bid values, sex of the household head, irrigation farm size, extension service significantly affected households’ WTP in both initial and followed up bid values So, policymakers should be households have a high willingness to pay for improved irrigation water use systems and the government should implement irrigation water management practices to supply reliable irrigation water to the farmers and should set up proper irrigation water pricing at an amount close to the mean WTP that households were willing and able to pay.
1. Introduction
Water is a finite valuable natural resource which is essential for sustainable development through using irrigation farming. But, climate change, water supply limits, and continued population growth have intensified the search for measures to conserve water in irrigated agriculture, the world’s largest water user (Giordano et al., Citation2019). Therefore, encouraging the financing of water-conserving irrigation technologies is widely believed to make more water available for cities and the environment for the longer-term water supply reliability and quality (Aydogdu, Citation2016).
Globally, the population is expected to grow rapidly, and resulting increasing irrigation has existed as a prerequisite to farming that use of the return from the limited land available to cultivate agricultural production (Ndlovu, Citation2015). Irrigation farming is one of the measures required to bring about sustainable food production by adopting more diversified cropping patterns and is also an important tool for mitigation of climate change conditions such as drought and famine in developing countries (Kljajic et al., Citation2013). Despite irrigation having this importance, its development in Africa is the lowest supply of surface water is affected by seasonal rainfall flow (Aydogdu, Citation2016). Therefore, efficient water resource uses needs by creating the driving force for sustainable irrigation development.
In sub-Saharan Africa, it is not only the scarcity of freshwater sources, climate change and the deterioration of freshwater quality supply of water that is an issue but also the level of management and efficiency of its use. Therefore, actions are necessary among the important political-economic priorities to improve the improving the design of irrigation canals will reduce water losses through evaporation and seepage Irrigation systems (Hamdy. et al.,2020). One strategy is to scale back water demand by adopting conservation programs and improving water use sustainability and efficiency, and another driving force involves a water pricing policy. This policy has the advantage that the income may be wont to finance developments of sustainable irrigation systems. Economic valuation of water can also be considered a prerequisite for the sustainable use of water resources by comparing farmers’ willingness to pay and the opportunity cost of water (Aman et al., Citation2020).
Like many sub- Saharan African countries, irrigation facilities in Ethiopia are relatively backward, lack water control infrastructure, and lack technical experts to support irrigation development, leading to low crop yields and low utilization efficiency of irrigation water resources (Fikirie et al., Citation2017). The sensible experience of estimating households’ willingness to pay (WTP) and collecting fees for irrigation water in Ethiopia is low (Mezgebo & Ewnetu, Citation2015). According to (Ayana, Citation2015), the awash geographical area is the only basin in Ethiopia where irrigation water pricing is practiced. Therefore this low experience of fees payments for irrigation water use can be one reason for the less productive use of irrigation water in Ethiopia (Ejeta et al., Citation2019) and (Angella et al., Citation2014).
Recently, the Ethiopian government has focused on the design to measure various activities to boost the irrigation system, particularly on the supply side, and seems to disregard the effective demand of the irrigation users (Aman et al., Citation2020). However, there is a need for fulfillment within the improvement of irrigation water use system is sufficient knowledge about farmers’ demand or WTP for improved irrigation water (Zakaria, Citation2014). As a result, the implementation of such policy is opposed to the supply-side regulating the pricing mechanisms and considering the WTP of the irrigation water users (Alemayehu, Citation2014). Consequently, the need to estimate farmers’ WTP for improved irrigation water use is timely research to enhance irrigation systems.
Several studies have shown the economic valuation of improved irrigation water use in Ethiopia and others Countries. There is some empirical evidence worldwide. For example, (Aman et al., Citation2020); (Birara Endalew Beneberu Assefa, Citation2019); (Yibeltal, Citation2018); (Fikirie et al., Citation2017); (Mekonnen A, 2015); (Mezgebo et al., Citation2013) and (Nega et al., Citation2012). However, most studies valued water using a single bounded discrete model. But, the single-bounded dichotomous choice approach yields inefficient welfare measures due to limited information obtained from each respondent. As a result, the researcher is motivated to investigate economic valuation of improved irrigation water use by using double bounded discrete model.
2. Review related literature
There are different studies in environmental valuation through WTP approach using contingent valuation method. However, this subsection favored on reviewing number of previous studies where the contingent valuation method has been used to determine WTP for a specific improvement or conservation of environmental resource specially, water in Ethiopia and out said of Ethiopia. For instance, Tolera et al., (Citation2019) conducted a study on determinants of farmers’ willingness to pay for improved irrigation water use in the case of Woliso district, Ethiopia. His collected data from two hundred fifty-one sampled households and he also, use Tobit model. The finding revealed that a combination of socioeconomic variables were determined the farmers maximum willingness to pay. Consequently, the result of the Tobit model showed that education level of household head, irrigable land size and credit utilization were the factors that influence the farmers ’probability and maximum willingness to pay for improved irrigation water use positively. On the other hand, initial bid influenced the households’ probability and maximum willingness to pay negatively.
Birara Endalew Beneberu Assefa (Citation2019) examined the determinants of farmers’ willingness to pay for the conservation of church forests in northwestern Ethiopia. Tobit model was employed to analyze the determinants of households’ maximum willingness to pay for the conservation of church forests. Consequently, the result of the study revealed income of the household was one of the other factors that had a statistically positive influence on households’ willingness to pay in terms of cash for the conservation of the church forest. The possible explanation from the report was having more income increases the purchasing power of sample respondents. Whereas the result from the CV survey revealed mean willingness to pay in terms of cash and labor is 178 ETB. (1787.75 ETB) man-days, respectively.
Fikirie et al. (Citation2017) conducted a study titled economic valuation of improved irrigation water use: the case of South Shoa Zone Oromia Ethiopia. They used the double bounded dichotomous choice method eliciting contingent valuation method to elicit the respondents of the sample household. The mean willing to pay for the estimated mean willingness to pay for the improved irrigation water use was Birr 575.23. On the other hand, means estimation was made on the open-ended question it was estimated to be 562. The report suggested that “as a matter of fact that, households become free riders in the open-ended questions” the mean willingness to pay in double bounded dichotomous choice format is higher than that of open-ended CVM questions.
Mekonnen. A, (2015) conducted on Irrigation water pricing in Awash River Basin of Ethiopia. The study attempted to identify the factor which affected the households’ willingness to pay for conservation of irrigation water. In addition the author was estimated the value of irrigation water in Awash River Basin of Ethiopia. Logit and probit were the econometric models to identify the factors and estimate the value of Irrigation water price. The result from the logit model showed that the controversial influence of education level on households’ willingness to pay. This result showed education level of household had a negative influence on the probability of households’ willingness to pay for conservation of irrigation water use. Mekonnen explained that “educated respondents had the fear of increased price if they identify themselves willing to pay. On the other hand households with accessed to credit were more willing to pay for irrigation water than those households with no accessed. Similarly Irrigators with longer irrigation experiences were also more willing to pay than those relatively short periods of experience. The study also estimated the mean willingness to pay for irrigation .Consequently, the result from the probit model showed it was Birr 88 per hectare per year per person. The calculation was made using the probit model as: mean WTP where
is a constant term and
is the coefficient of the bid level.
Consequently result from probit model stated that, the estimated coefficient of the proposed bid value was statistically significant and affected the probability of households’ willingness to pay for irrigation water negatively. Whereas irrigation farming experience was found to had highly statistical significant influence on households’ probability of willingness to pay with positive sign. The author suggested that households with longer irrigation farming experience could easily realize the benefit from irrigation and hence is more likely to attach high value for irrigation agriculture than those who have no or shorter years of irrigation farming experience. Furthermore households’ annual income and market access were the other explanatory variables which influence the probability of households’ willingness to pay.
The other objective of the probit model was to estimate the central value of the irrigation water as a result it was Birr 614 per annual per timade per household. But it was Birr 417 from open ended question. The aggregate demand from close ended and open ended was estimated as birr 35,513,760 and 24,147,622 respectively.
Generally, except few, all studies did not conduct detail analysis for each (DBDC or open ended) question to answer what are the determinant factors which determine probability of willingness to pay (WTP) and maximum willingness to pay. Because the factors which significantly influence WTP may not influence MWTP similarly so, more studies should be regressed in different econometric model differently.
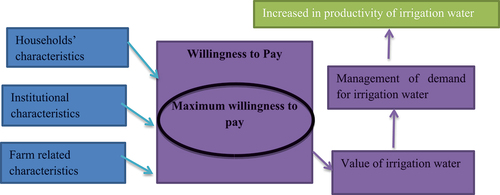
The conceptual framework of this study will base on the assumption that willingness to pay is influenced by a number of socio economic factors such as households’ characteristics, institutional characteristics and farm related characteristics (). Besides As study by Omondi .S. (2014) reported, quantifying farmers’ willingness to pay help to manage the water demand as a result it increase the efficiency and productivity of the irrigation water use.
Figure 1. Conceptual frame works of households’ willingness to pay.
3. Materials and methods
3.1. Description of study area
For this study, the Gumara irrigation scheme is irrigation kebeles bounded by the Fogera and Dera districts of South Gondar Zone ANRS Ethiopia. The name Gumara irrigation scheme originated from the Gumara River and is located in South Gondar and ranges between Mount Guna from the east and Lake Tana in the west ().
Figure 2. Map of study area.
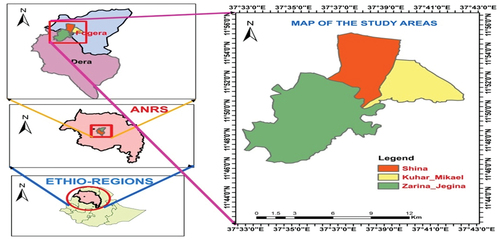
Fogera district is one of the districts in Amhara National Regional State and found in South Gondar Zone. Border by Lake Tana, source of Blue Nile. It is situate at11058N latitude and37041E longitude. The district has a total land area of 117,414 hectares. The land use pattern of the district including 51,662 hectares of cultivated land, 25,831 hectares of pasture land, and 16,434 ha for other purposes, and the water bodies‟ account for 23,483 hectares (Kedir, Citation2011). IPMS (2005) indicate that, flat land accounts for 76%, mountain and hills 11% and valley bottom 13%. The high proportion of plain topography creates the opportunity for irrigation. The altitude ranges from 1774 to 2410 masl. The mean annual rainfall is 1215 mm and ranges from 1100 to 1340 mm (MOA Citation2005).
Dera is one of the other woredas in the Amhara region of Ethiopia. It is a part of the south Gondar Zone and is bordered to the south by the Abay River which separates it from the east Gojam from the west; it is bordered by Lake Tana, to the north by Fogera, and to the east by Estie. Dera woreda covers total area 158,948 ha, of which 35% is plain, 20% is mountainous, 18% is gorges and 27% is undulating. The altitude of the woreda ranges from 1,500 m to 2,600 m above sea level while the annual average rainfall is 1,250 mm. 85% of agro-ecology Woynadega while 15% is Dega (Deraworeda agricultural office).
3.2. Data type, source and methods of data collection
The study used primary data collected through focus group discussion (FGD) and individual interviews. Primary data were collected from sampled household heads in the study area through a structured questionnaire using face-to-face interviews. Secondary data were gathered from selected irrigation kebeles’ irrigation offices. Besides, secondary data was gathered from the Fogera and Dera irrigation office.
The questionnaire was administered in two main sections. The first section provides several socioeconomic characteristics of households. The second section contains the contingent valuation scenario and the question of households’ probability and maximum willingness to pay for the provision of improved irrigation water use. The questionnaire was translated into the Amharic language to ease the data collection process and reduce errors.
The data was collected by well trained and experienced enumerators. Before starting the actual survey, training about the objective of the study and how to manage the CV survey data was given to enumerators. Besides, pre-test survey was under taken to check the performance of the enumerators’ understanding toward the questionnaires and customization of the questionnaire in to the local context.
Focus group discussion and key informant was held to decide on the appropriate initial bid values. Pilot survey was also conducted on 18 randomly selected households before the actual survey was started to check the validity of the questionnaire. Accordingly the pilot survey was conducted with due supervision of the researcher and the necessary adjustment to the draft questionnaire was made by the researcher. After the necessary adjustment was made to the draft questionnaire the final questionnaire was developed.
3.3. Sampling technique and sample size
The study was conducted in three potential Kebeles under the command area of Gumara irrigation schemes, which have a high irrigation potential in Dera and Fogera woredas, South Gondar Zone of Amhara Regional State. From the total irrigation kebeles, three kebeles were selected based on irrigation potential. Kebeles that had more or less improvement in irrigation water use are not considered for sample selection because the sampled kebeles need to have the same existing irrigation water use system. From the three potentiate Kebeles were selected from the individual respondents by applying a systematic random sampling technique. Thus, 300 households were selected based on probability proportionate to the sample size technique. Therefore, total sample size was distributed to each selected kebeles based on the proportion of Gumara River irrigation beneficiaries in each kebeles as shown in .
Table 1. Sample size distribution
In this study, sample size was determined following Yaman (Citation1967)
Yaman (Citation1967)
Where n is the sample size, N is the population (total irrigation water user households by using Gumara River), and e is the level of precision (0.05) for this study. N = 1171 according to (Shina, Kuhar Michael and Jigna kebeles irrigation office, 2019).Therefore the sample size is equal to: 300
3.4. Method of data analysis
The gathered data was analyzed using both descriptive statistics and econometrics models based on contingent valuation method.
3.4.1. Contingent valuation method
The contingent valuation method is a valuation based on a survey that offers the respondents a chance to make an economic decision on non-market goods. According to (Kedir, Citation2011); World Bank (2002), states that, Contingent valuation is a method of estimating the value that a person places on a good, habitually one that is not sold in markets, such as environmental quality or good health. CV is also claimed, to recover existence or non-use values which other methods cannot. In natural resources, contingent valuation studies generally derive through the elicitation of respondents’ willingness to pay to prevent injuries to natural resources or to restore injured natural resources (Abdul Rahim, 2005).
These approaches, however, have their advantage and disadvantages. For instance, several studies such as those (Nega Assefa Citation2012);(Tesfahun Alemayehu, Citation2014); (Meseret Birhane and Endrias Geta, Citation2016) conducted a study regarding irrigation improvement focused on open-ended follow-up questions to analyze both probability and maximum willingness to pay. However, open-ended contingent valuation questions are doubtful to provide the most reliable valuations because responses to open-ended questions are unreliable and biased (Arrow K et al., Citation1993). As a result, the researcher is motivated to investigate farmers’ willingness to pay for improved irrigation water use using double bounded contingent valuation method followed by open-ended questions to analyze the probability of willingness to pay and amount of WTP respectively.
3.4.2. Descriptive analysis
Descriptive statistics including percentage, frequency, mean, minima and maxima were computed to present the socioeconomic characteristics and willingness to pay status of sample households.
3.4.3. Econometric model specification
The ultimate goal of estimating the econometric model from the double bounded dichotomous choice format of the contingent valuation method was to calculate the household’s willingness to pay for providing the irrigation service described in the scenario and to answer the question What are the factors that influence the households’ probability of willingness to pay in two different bid levels. On the other hand, the goal of estimating the economic model from open-ended format was to answer what are the factors that influence the households’ maximum willingness to pay for improved irrigation water use. Binary probit and bivariate probit model are appropriate models for analyzing the influence of factors on discrete dependent variables.
3.4.3.1. Bivariate probit model
Binary probit econometric model are efficient and unbiased to estimate the coefficient of independent variables for the single bounded dichotomous choice model. Whereas, bivariate probit econometric model is efficient and unbiased to estimate the coefficient of independent variables for the double bounded dichotomous choice model. Therefore, bivariate probit model is a joint model for two binary outcomes with correlated error terms, in the same way for seemingly unrelated bivariate regression model (Greene, Citation2003). SUBPM takes two independent binary probit models into account and estimate them together by considering their non-zero correlation of error terms between two equations. However binary Probit Regression model can produce unbiased, but inefficient estimators for exogenous variables because it assumes the error terms are not correlated with each other, also it ignores the unobservable heterogeneity between the two equations. Hence, an alternative approach to control for unobservable heterogeneity is to consider a Seemingly Unrelated Bivariate Probit model, as it provides a way of dealing with two separate binary dependent variables (Greene, Citation2003).
The other comparative advantage of the seemingly unrelated bivariate probit model is to calculate the mean level of farmers’ willingness to pay for improved irrigation water use.
Therefore, in this study a Seemingly Unrelated Bivariate Probit model was employed to estimate the coefficient of independent variables for the double bounded dichotomous choice to identify factors which influence probability of households’ willingness to pay and to quantify their mean WTP in two bid levels jointly. The Marginal effects and predicted values for the probability of farmers’ willingness to pay in the two separate binary outcomes could be estimated similarly to those for the binary probit models. Marginal effects for the joint probability, say P (y1 = 1 and y2 = 1) are also available.
The most general econometric model for the double bounded CV Data comes from Haab and McConnell (Citation2002), formulations
Where,
To construct the likelihood function, the probability of observing each of the possible two bid response sequences (yes-yes, yes-no, no-yes, no-no) are given as follows. The probability that the respondent ἰ answers to the first bid and to the second bid is given by Haab and McConnell (Citation2002):
the ith contribution to likelihood function becomes
NY = 1 for no yes answer,0 otherwise;
This formulation is referred to as the Bivariate Discrete Choice Model. Assuming normally distributed error terms with mean 0 and respective variances σ12 and σ22, then WTP1j and WTP2j have a bivariate normal distribution with means μ1 and μ2, variances σ12 and σ22 and correlation coefficient ρ. Given the dichotomous responses to each question, the normally distributed model is represented as bivariate probit model.
,
and
Then after running regression of dependent variable of two equations (yes/no indicators), on a constant and on Independent variables consisting of the bid levels, the mean WTP value was calculated Following the approach developed by Krinsky and Robb (Citation1986). Therefore, the mean WTP value of improved irrigation water can be calculated as follows as:
Whereas, the mean WTP from open ended contingent valuation response could be estimated Following to (Habb.C and McConnell 2002 as:
Where n is the sample size and y is maximum amount of willingness to pay reported by households.
4. Result and discussions
4.1. Socio economic characteristics of sample households
The data were collected from 300 respondents, but only 288 respondents were used for statistical analysis. Additionally, from the descriptive statistics revealed in that among 288 sampled households, 256 (89%) were male- headed households and 32 (11%) were female- headed households. Age of the household head, the average age of the sampled respondents was 45.3 years with the minimum age of 22 years and a maximum of 75 years old. Regarding education level of household head, the average attainment of household was 4 classes with the minimum 0 and maximum of 12 class years. The survey result presented in revealed that the average family labor force of the total sampled household was about 4 persons with the minimum 1 person and maximum of 6 persons. In it is also demonstrated that the average household’s yearly income is about birr 51,416. The income level ranges from a minimum of birr 3500 to a maximum of birr 100000. Experience of irrigations practices is another continuous variable of households’ attribute and the mean experience of sample households in irrigation practices was about 11 years with the ranges from a minimum of 2 years to a maximum of 15 years.
Table 2. Household characteristics for categorical variable
4.2. Households’ willingness to pay
As Hanemann et al.,1(966) recommended, before to the elicitation question, individuals were asked if they might pay anything. As a result, the solicitation of double bound CVM; individuals were asked “yes” or no questions to assess their WTP for improved irrigation water use. Accordingly, out of the total 288 households used for statistical analysis, 283 (98.26%) of the respondent were willing to pay money for the proposed irrigation project and also the reaming, 5(1.74%) of them weren’t willing to pay money for the given scenario (as indicated in ). Those, unwilling household heads reported that they could not afford to pay for the proposed improvement. This suggests that the given scenario is supported by about 98% of households. Those that failed to WTP, considered because the economic reason might be treated as having true zero WTP (Birara Endalew Beneberu Assefa, Citation2019).
Table 3. Household characteristics for continuous variables
Table 4. Households’ willingness to pay for the proposed scenario statistics
Those, unwilling household heads reported that they couldn’t afford to pay money for the proposed improvement (). This suggests that the given scenario is supported by about 98% of households. These results didn’t show a WTP because the economic reason may well be treated as having true zero WTP (Gebremariam, Citation2021).
Table 5. Number of zero willingness to pay bids with reasons
As presented in that out of the 5(1.74%) households who were unwilling to pay anything in the least for better irrigation water use system. A number of the respondents stated that management would misappropriate the cash. Others said the price of production under the scheme was too high, land sizes were too small, crop yield was too low, and water wasn’t well distributed. Others too cited prevalence of crop diseases. During this case, misappropriation of the funds sounds looks like protest because the respondents seem to possess value for the project but undecided the funds are used of cause.
Table 6. Joint responses of households’ WTP
4.3. Joint responses of households’ WTP
As (Hoyos et al., 2010) explained efficiency within the elicitation of WTP may be increased if repeated questions are used. Following this, double-bonded CVM followed by an open-ended question was used for this study. Households were also categorized supported their joint responses to the primary and therefore the second bids as we discussed in the methodology part if a household responds “Yes ‘to the first bid he/she could be asked for an increased amount of the first bid and also the discounted amount for those that respond” No’ to the primary bid. Accordingly, the joint responses of respondents are Yes-Yes, Yes-No, No-Yes, and No-No. depicts the joint response of sample households for the first and also the next minimum or maximum bids. Therefore, the descriptive statistics revealed that among 288 sampled households, 126 (43.75%) households were willing to pay the maximum amount beyond the stated bids both within the first bid and second bid values (Yes-Yes). Whereas for respondents who were willing to pay in the first bid and not willing to pay in the follow-up maximum bid values (Yes-No) was 72 (26.06%). The proportion of households who weren’t willing to pay at the first bid level and willing in the second maximum bid level (No-Yes) was found to be 27 (9.37%), and also the remaining 63 (20.84%) of respondents were felt to No-No (who aren’t willing at both level of bids).
4.4. Estimation of mean willingness to pay
In the practice of the contingent valuation method zero bidders are presented with follow-up open-ended inquiries to ascertain whether or not they are expressing a protest bid against the valuation or they place no value on the resource (Cooper et al., Citation2002). For this study open-ended and double bounded contingent valuation methods were used to compute the mean willingness to pay and used for comparison between the open-ended and double bounded results. This study used double bounded CVM followed by an open-ended question hence, efficiency in the elicitation of WTP increases if the repeated question is used (Gelo & Koch, Citation2015). Accordingly, the results of the contingent valuation survey revealed that the mean maximum WTP of sampled households was about ETB 926.7 (€25.05) with the ranging from ETB 0 to 3000 annually per hectare (0.25 hectare) of irrigable land toward the development of sustainable irrigation water use (as indicated in ).
4.4.1. Estimation of mean from double bounded dichotomous choice format
As depicts, the significant and positive sign of Rho (ρ) indicates the existence of positive relationship between the 2 WTP responses. This significant but imperfect correlation between the two error terms verifies that seemingly unrelated bivariate probit model is that, the correct econometric model to estimate mean WTP amount. The likelihood ratio test of the model confirms the interdependence between two probit equations at less than a 1% significance level. This indicated that the two equations estimated concurrently. Because the model result indicated both the initial follow-up bid had a statistically significant at 1% level. This means that the rise within the number of bids decreases the respondents’ willingness to pay. The probability of willingness to pay only the second response (WTP2) by the sample households was about 57.85%. As against to this, the joint probability that household heads fail to willingness to pay in both of the responses is about 13.11%, and this indicated that they’re more likely to fail to willingness to pay both responses (WTP1 and WTP2) simultaneously. Moreover, the regression output in revealed that the coefficient of the initial and follow-up (second-bid values) have negative and significant at less than 1% significant probability level, respectively.
Table 7. Households’ minimum, maximum and mean willingness to pay for better irrigation water
The mean WTP estimation in double bounded dichotomous choice was made based on WTP in first and second bid values through the subsequent. Accordingly (Krinsky et al., 1966), the primary procedure was calculating the mean WTP of equation one and mean WTP of equation two from a seemingly unrelated bivariate probit model which is displayed (in ). The mean level of farmers’ WTP was found to be ETB 950.7 (€25.69) annually per timid (0.25hectar). Whereas, the descriptive statistics from open-ended questions indicated in , the mean level of user farmers’ WTP was found to be ETB 926.1 (€25.03) annually per 0.25 ha which is a smaller amount than the mean WTP from the double bounded dichotomous choice format. This comparison result’s in step with the finding of (Aman et al., Citation2020), who suggested a possible reason that households become a free riders within the open-ended questions.
Table 8. Parameter estimates of a seemingly unrelated bivariate probit model
This implies that at 95% confidence interval the mean WTP varies −0.001269–0.0002482 Birr/ hectare/year. However, the rational being the very fact that the second-equation parameters are likely to contain more noise in terms of anchoring bias where the respondents are assumed to take.
4.4.2. Estimated aggregate farmers’ willingness to pay
As indicated in , one amongst the last main objectives of WTP contingent valuation study is to calculate or estimate the aggregate WTP of the goods valued or the analysis of welfare measures using the value of total WTP obtained from the sample households to the whole population within the irrigation command area. For valid analysis the advantages, the various bias of the sample design during contingent valuation study has to be minimized, and protest zero responses should be excluded from the data (Carson & Mitchell, Citation1993). Lastly, as indicated in , supported the NOAAFootnote1 panel guide following (K et al., Citation1993), protests zero households are excluded from the aggregation, and hence we expected none of the various biases within the analysis.
Table 9. Estimated total willingness to pay from open ended and double bounded format
The total farmers’ WTP for improved irrigation water use can be estimated by taking the entire number of beneficiary households less the protest zero bidders and their total irrigable land sizes within the command area. In line with key informants of the district agriculture experts and office heads the total number of irrigated land is estimated to be 372.5; 439.5 and 1008 hectares, and also the total beneficiary households are estimated to be 248; 293 and 630 in Kuhar Michael Kebele, Shina Kebele and Jigna Kebele respectively. Consequently, the total amount of willingness to pay for the irrigation project area was calculated by multiplying the mean WTP value obtained from seemingly bivariate Probit regression model. The valid number of households was obtained after deducting the expected protest zero responses (20)Footnote2 from the total population.
As a result, aggregate WTP has found to be ETB 6644257.16 (€179574.52) and ETB 6472327.68 (€174927.77) from double bounded and open-ended questions respectively. This aggregate willingness to pay result was greater than research findings (ETB 156786.1 from double bound elicitation method and ETB 128,264.55 from open ended elicitation method (Kassahun, Citation2009).
One of the main steps in analyzing data obtained from contingent valuation method is estimating and aggregating benefit. After, calculating mean WTP for better irrigation water in the above section, next, the total willingness to pay of households was estimated based on the proportion (willing versus not willing households). As discussed in the above, the survey covered 288 sample households and only 283 were valid out of 1171 total user households within the study area. The results of the study show that, about 283 (98.26%) of the households were willing to pay for better irrigation water use system. Based on our estimation a total of 1150 (1171*0.9826 = 1151) households were WTP for proposed irrigation project.
From the above table, the number of households in each sample Kebele (columns 6). The amounts of WTP for each Kebele and the total households WTP in that Kebele. To obtain the WTP for households (column 7 and 8) from open ended and double bounded approach respectively. As discussed in the previous section, the mean WTP from open elicitation and double bounded method (926.059 and 950.7 ETB /month respectively), multiplied by the corresponding number of households willing to pay. Finally, the total willingness to pay (TWTP) was obtained by adding the WTP of the total households in each Kebele (column 8 and 9). The result indicated that, the TWTP is 107, 2990.52 ETB/month or (€28,999.74) from open ended elicitation method (column 7), and 108, 7159.09 ETB/month (€29,382.68) from double bounded elicitation method (column 8). The total WTP across sample Kebeles were also calculated and result indicated that significant amount of difference. The TWP of the Kuhar Michael Kebele, Shina Kebele and Jigna Kebele sample Kebeles were ETB 573,230.52; ETB 22,5958.40 and ETB 27,3801.6 per month, respectively from open ended elicitation method (column 7), and ETB588483.3; ETB231970.8 and ETB 266704.99/month respectively from double bounded elicitation method (column 8). This finding is in line with previous studies (Ayenew & Meride, Citation2015).
4.5. Estimated households’ demand curve for improved irrigation water use
The sampled household demand toward the scenario of improving irrigation water use at different price levels could be observed through driving demand curve as shown in . The demand curve is derived with the midpoint value of maximum WTP along the X-axis and the number of sampled irrigation water user farmers that are willing to pay per 0.25 hectare per year along the Y-axis. Moreover, the figure was formulated following some appropriate mathematical equations to get constant (K)Footnote3 and width (W)Footnote4 to set the stated level of maximum WTP class along the “X” axis.
Figure 3. Sample households demand curve.
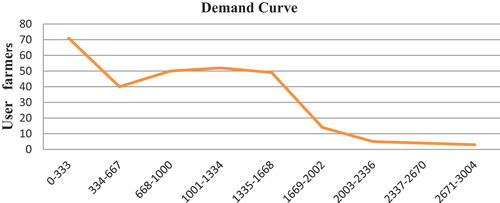
As shown in , even if the demand curve is not downward everywhere it has a downward sloping in the long term perspective. It is in line with the economic theory of demand. The downward sloping of the demand curve implies an increase in the price of the improved irrigation water decreases the quantity demand for the improved irrigation water use system, other things remain constant. The negatively sloped aggregate demand curves for the supply of irrigation water ascertains the law of demand if the good is assumed a normal good.
4.6. Determinants of households ’probability of willingness to pay
As we discussed in methodology part one of the objective of double bounded dichotomous choice format was used to identify farmers’ probability of willingness’ to pay for improved irrigation water use after the estimation of seemingly unrelated bivariate probit model. Before the analysis of the determinant factor of households’ probability of WTP, the researcher checked either the dependent variables (WTPB1 and WTPB2) are regressed jointly using seemingly bivariate probit or independently using binary probit by considering the concept “when to use what’.’ To do so a bivariate probit model was run to check whether the correlation between two error terms (rho) is different from zero and whether the test of significance (Prob> chi2) is accept or reject the null hypothesis which is rho = 0. Accordingly If the correlation between the two error term is significantly different from zero or if the test of significance (Prob> chi2) is rejected the null hypothesis, seemingly unrelated bivariate probit model is appropriate assumed the errors are normally distributed with mean zero.
As a result of the executed seemingly unrelated bivariate probit model this is clearly shown in appendix, the value of rho is about 0.66 with a positive sign implying there is the positive correlation between the error terms of the dependent variables with a significance level of 0.0015. Which means we have an evidence to reject the null hypothesis (rho = 0). Therefore, seemingly unrelated bivariate probit model is found to be an appropriate (see table 3.11).
From bivariate probit model, sex of the household head (SEX), irrigation farm size (IFS), development agent contact of household head (EXTENSION), and bid values were statistically significant on probability of willingness to pay in both initial bid and follow up bid responses toward the improvement of irrigation water use. The result also revealed that age of the household head (AGE), total annual income level of the household (INCOME), credit utilization of the household (CRDT), distance from the water source (DISOURCE) and dissatisfaction (DISSATISFY) were found to have significance influence on probability of willingness to pay in the first bid response (WTPB1). Whereas, maximum level of education of household head (MLEDU) and family labor force (WAGEFS) were found to have a significance influence in the probability of willingness to pay in the followed up bid response (WTPB2).
5. Discussion on bivariate probit model result
Irrigating farm size (IFS)
The bivariate probit model has revealed that irrigation farm size was found to have a positive influence on the probability of households’ willingness to pay in initial bid values as well as in followed up bid values at 10% and 5%significant levels respectively (. This would mean that the households who had large size irrigated farms would be more likely willing to pay for the proposed project. The possible clarification behind the result could be households who had large size irrigated farms might hope to gate higher returns from higher engagement from irrigation using an improved irrigation system. The marginal effect of bivariate probit regression indicated that, holding the influences of other factors constant as the irrigated land size of household increases by one hectare (0.25 ha). The probability of household willingness to pay in the proposed bids for improved irrigation water use increasing by 5.3% this result is in agreement with the results from several previous similar studies: (Alem Mezgebo et al., Citation2013; Nega Assefa, Citation2012; Karthikeyan C., 2010)
Table 10. Estimated coefficient of bivariate probit model
Extension service (EXTENSION)
The bivariate probit model result also has demonstrated a positive and significant effect of the development contact at a 1% level of significance on the probability of households’ willingness to pay in both the initial and the follow-up bid response. The positive effect of the extension contact on households’ probability of WTP the possible explanation could be those who get an extension or development contact might have knowledge and awareness to decide about the technology of irrigation. Based on the calculated marginal effect of the bivariate probit model, a household that had contact with the development agent is more likely willing to pay in the given bids on average about 43.4% holding the influences of other variables constant. This result is confirmed by the hypothesis and the finding of (Njoko, 2014)
Bid value
As a result of the bivariate probit, model regression implied that the bid value was found to have a negative and significant influence on the probability of households’ willingness to pay in both bid responses (B1, influence WTPB1, and B2, influence WTPB2) at 1% level of significance. The negative sign of initial bid values tells us the higher the bid amount is the lesser the probability of willingness to pay in that bid. The marginal effect of the bivariate probit model indicated that as the starting bid prices increase by 100 birrs per year the probability of households’ willingness to pay decreases on average, by about 0.02%. This result confirms the hypothesis and is in line with the study conducted by (Ayana, Citation2015; Yibeltal, Citation2018)
Meal headed household (SEX)
Concerning to sex of the household head, it positively and significantly affects the households’ probability of willingness to pay first and followed up bid response at 1% and 5% levels of significance respectively. This would tell us male-headed households are more likely willing than female-headed households. This is because; most probably males had more economic decision power than females. The marginal effect after bivariate probit regression output indicated, keeping the influence of other factors constant, male-headed households have on average about 32% more probability of willingness to pay in the proposed bid for improved irrigation water use than female-headed households. The result is as expected and a similar result was reported by other studies (Tesfahun Alemayehu, Citation2014; Meseret Birhane and Endrias Geta, Citation2016).
Age of household head (AGE)
This variable was regressed under the bivariate probit model that was found to have statistically significant and negatively affect households’ probability of willingness to pay specifically, in the initial bid values toward the proposed project at a 5% level of significance. The negative relation of age with the probability of households’ willingness to pay in the propose bid values is that the older the household head is, the lesser the probability of the households’ willingness to pay in the propose bid values. This is mainly due to older household heads being more likely to reject new ideas and fashions. From the marginal effect as the age of the household increases by one year the probability of households’ willingness to pay in a given bid value goes down on average by about 0.3%.This result is in line with (Alem Mezgebo et al., Citation2013) and contradicted the result reported by (Ibrahim A. and Robert H. 2010)
Total annual income of the household (INCOME)
This variable affected the probability of households’ willingness to pay in the dichotomous response specifically, in the initial bid values positively and significantly at a 1% level of significance. This result was found as per the prior hypothesis. This positive effect indicated that households with higher income were more likely willing to the proposed bid toward the scenario than that household with lower income. The possible explanation for the result obtained in this study could be that those households that have higher income levels have a higher demand for most commodities or services according to the basic economic theory. Keeping the influence of other explanatory variables constant, with one birr increase in the total annual income, the probability of households’ willingness to pay increases on average by about 24%.This result is confirmed by (Yibeltal, Citation2018)
Utilization of credit (CRDT)
The bivariate probit model revealed that credit utilization positively and significantly influences the probability of households’ willingness to pay in the proposed bid value toward the given scenario at less than a 5% level of significance. This implies that households who received the credit could be more likely willing to pay at the given bid level than those who did not receive credit. The possible reason could be household who received credit might have an opportunity to overcome the financial constraint and enables the farmer’s inclination toward purchasing productive service or good for enhancing farm production. From the marginal effect of the bivariate probit model, the relation is interpreted as farmers who received credit had on average about 6.6% more probability of willingness to pay in the proposed bids than those farmers who did not receive credit keeping the influence of other explanatory variables constant. This result is in line with similar studies conducted by (Mekonnen Ayana, Citation2015; Tadese Tolera et al., Citation2019)
Farm distance from the irrigation source (DISOURCE)
It had statistically significant and positive effect on the probability of household willingness to pay in proposed bid values specifically in the initial bid values (WTPB1) at less than 1% significance level. This tell us the distance the water source from the farm is, the households are more likely willing to pay in a given bids for improved irrigation water use. The possible explanation might be farmers whose farm are far from the irrigation water source might receive a little water because of their distance from the water source and they may more likely willing whereas, farmers whose farm are near to the irrigation water source might receive a plenty of water because of the farm proximity to the water source and enables them lesser willingness to pay for the improvement of irrigation water use. Marginal effect result indicated that as the distance of farm is increase by one minute the probability of willingness to pay in a given bid values for the provision of improved irrigation water use increase on average by about 0.1% keeping the other influencing factors constant. This study is congruent with the finding of similar previous studies like (Chandrakanth M., 2011) and contrary with (Alhassan M.2012)
Education (MLEDU)
This explanatory variable was found to have a significant positive influence on the probability of households’ willingness to pay in second bid values at less than 5% level of significance. This tells us households with more years of schooling are more probably willing to pay in a given bid for improved irrigation water use. One possible reason could be the higher the academic level of individuals could enable households more concerned on resource improvement than that lower academic level. The marginal effect after this model showed that keeping the influence of the other factors constant, as year of schooling increase by one year, the probability of households’ willingness to pay in a bid increase on average by about 2.1%. This result was as expected and confirmed with (Yibeltal, Citation2018; Tesfahun Alemayehu, Citation2014; Tadese Tolera et al., Citation2019) and contradicted with (Mekonnen Ayana, Citation2015).
6. Conclusions and policy implication
The study attempts to evaluate of irrigation water by eliciting farmers‟ willingness to pay on Gumara irrigation project using contingent valuation method. From the result of this study, the researcher concluded that there are a high degree and level of WTP in the Gumara irrigation scheme for improved irrigation water use to provide sustainable irrigation water. The estimated total WTP from this study can be considered as the societal benefits of recovering the cost of sustaining water service and can be used in future cost-benefit analysis for policy formulation. However, the estimated mean WTP from open-ended elicitation format was less than the double bounded elicitation format that might be due to a human being may want a free service from government or the benefit of improved irrigation water use at the expense of others. The study revealed that. The Mean and aggregate willingness to pay from the open-ended questions to be 926.059 ETB (€25.03) per month per household per hectare was 107, 2990.52 ETB (€28,999.74) per month respectively. This shows that, there is an opportunity for improving irrigation water use. Therefore, the government should implement irrigation water management practices to supply reliable irrigation water to the farmers and should set up proper irrigation water pricing an amount close to the mean WTP that households were willing and able to pay.
Acknowledgements
The author’s thanks special and sincere gratitude goes to Bahir Dar University for supporting me financially. Also, thank Gummra districts for their help in organizing local people during the survey work. I also thank to my respondents for their patience in providing all the necessary information for my study.
Disclosure statement
No potential conflict of interest was reported by the author(s).
Data Availability Statement (DAS)
The study is based on three potential Kebeles under the command area of Gumara irrigation schemes, which have a high irrigation potential. Other information related to the study area was derived from districts Development agent and irrigation offices.https//:doi./org.10.1080/23322039.2022.2090663
Additional information
Funding
Notes on contributors

Aklok Getnet
Aklok Getnet was born in Ebenat Woreda, North Gondar Zone of Amhara Regional State in February 1994. He also attended his elementary, secondary and preparatory school education at Ebnat Secondary and Preparatory High School in North Gondar Zone. After completion of his high school education, he joined Bahir Dar University College of Agriculture and Environmental Science (BU) in October 20125 and graduated with BSc Degree in Agricultural Economics in July 03/2018. Soon after his graduation, the author joined Bahir Dar University College of Agriculture and Environmental Science in October 2019 to pursue of his MSc degree in Agricultural Economics in regular program. After the accumulation of hismaster degree he joined Jinka University College of Agriculture and Natural Resource as lecturer in Department of Agricultural Economics.
Notes
1. The National Oceanic and Atmospheric Administration (NOAA) convened a panel of prominent social scientists established in in 1992, to assess the reliability of contingent valuation (CV) studies. The product of the panel’s deliberations was a report that laid out a set of recommended guidelines for CV survey design, administration, and data analysis.
2. The invalid responses are calculated by multiplying the sum total percentage of the protest responses in the sample by the total population in the command area. Expected invalid response = 0.017 * 1171 = 20 households. Thus, the valid number of responses = 1171–20 = 1151 households.
3. k = 1 + 3.322 log288 = 9, where:288 is sample size /n.
4. , where: x max and x min are MWTP then W = 333.3.
References
- Alemayehu, T. (2014). Smallholder farmer’s willingness to pay for improved irrigation water: A contingent valuation study in Koga irrigation project, Ethiopia. Journal of Economics and Sustainable Development, 5(19), 5–22.
- Aman, M., Shumeta, Z., & Kebede, T. (2020). Economic valuation of improved irrigation water use: The case of Meskan District, Southern Ethiopia. Cogent Environmental Science, 6(1), 1843311. https://doi.org/10.1080/23311843.2020.1843311
- Angella, N., Dick, S., & Fred, B. (2014). Willingness to pay for irrigation water and its determinants among rice farmers at Doho rice irrigation scheme (DRIS) in Uganda. Journal of Development and Agricultural Economics, 6(8), 345–355. https://doi.org/10.5897/JDAE2014.0580
- Assefa, N. (2012). Valuing the economic benefit of irrigation water: Application of choice experiment and contingent valuation methods to Ribb irrigation and drainage project in south Gondar, Ethiopia. a m.sc. Thesis presented to the school of graduate studies of addis ababa university
- Ayana, M. (2015). Irrigation water pricing in awash river basin of Ethiopia: Evaluation of its impact on scheme-level irrigation performances and willingness to pay. African Journal of Agricultural Research, 10(6), 554–565. https://doi.org/10.5897/AJAR2014.9381
- Aydogdu, M. H. (2016). Agricultural water management and pricing in Sanliurfa-Harran plain, problems and solutions, Ph.D. Thesis, Harran University.
- Ayenew, B., & Meride, Y. (2015). Labor as a payment vehicle for valuing soil and water conservation practice: An application of contingent valuation method in Abaro-Toga watershed, Southern Ethiopia. Journal of Economics and Sustainable Development, 6(15), 17–26.
- Balew, A. (2021). Suitable potential land evaluation for surface water irrigation using remote sensing and GIS–MCE in the case of Rib–Gumara watershed, Ethiopia. Journal of the Indian Society of Remote Sensing, 1–18.
- Bateman, I., & Turner, R. (1993). Valuation of the environment, methods and techniques: The contingent valuation method. sustainable environmental economics and management, principles and practice. John Wiley and sons Ltd.
- Birara Endalew Beneberu Assefa. (2019). Determinants of households’ willingness to pay for the conservation of church forests in northwestern Ethiopia: A contingent valuation study. Cogent Environmental Science, 5(1), 1570659. https://doi.org/10.1080/23311843.2019.1570659
- Birhane, M., & Geta, E. (2016). Farmers’ willingness to pay for irrigation water use: The case of agarfa district, Bale Zone, Oromia national regional State. International Journal of Agricultural Economics, 1(2), 35–39.
- Cameron, T. A., & Quiggin, J. (1994). Estimation using contingent valuation data from a ”dichotomous choice with follow-up” questionnaire. Journal of Environmental Economics and Management, 27(3), 218–234. https://doi.org/10.1006/jeem.1994.1035
- Carson, R. T., & Mitchell, R. C. (1993). The value of clean water: The public’s willingness to pay for boatable, fishable, and swimmable quality water. Water Resources Research, 29(7), 2445–2454. https://doi.org/10.1029/93WR00495
- Cooper, J. C., Hanemann, M., & Signorello, G. (2002). One-and-one-half-bound dichotomous choice contingent valuation. Review of Economics and Statistics, 84(4), 742–750. https://doi.org/10.1162/003465302760556549
- D. and P. Mariel. (2010). Contingent valuation: Past, present and future. Prague Economic Papers, 4(2010), 329–343.
- Ejeta, T. T., Legesse, B., & Aman, M. (2019). Determinants of farmers’ willingness to pay for improved irrigation water use: the case of woliso district, Ethiopia. International Journal of Rural Development, Environment and Health Research, 3(3), 101–109. https://doi.org/10.22161/ijreh.3.3.4
- Fikirie, K., Tesema, E., & Tesfaye, Y. (2017). Challenges in women-managed small scale irrigation practices: The case of Lume district, central rift valley of Ethiopia. World, 4(1), 111–119.
- Gebremariam, A. (2021). Determinants of farmers’ level of interaction with agricultural extension agencies in Northwest Ethiopia. Sustainability, 13(6), 3447. https://doi.org/10.3390/su13063447
- Gelo, D., & Koch, S. F. (2015). Contingent valuation of community forestry programs in Ethiopia: Controlling for preference anomalies in double-bounded CVM. Ecological Economics, 114, 79–89. https://doi.org/10.1016/j.ecolecon.2015.03.014
- Getaneh, K. (2011). Impact of selected small-scale irrigation schemes on household income and the likelihood of poverty in the Lake Tana basin of Ethiopia project Paper presented to the faculty of the graduate school of Cornell University in partial fulfillment of the requirements for the degree of master of professional studies139p
- Giordano, M., Barron, J., & Ünver, O. (2019). Water scarcity and challenges for smallholder agriculture, in sustainable food and agriculture. Elsevier, 75–94.
- Greene, W. H. (2003). Econometric analysis (Fifth ed.). New York University Pearson Education, Inc., publishing as Prentice Hall.
- Haab, T. C., & McConnell, K. E. (2002). Valuing environmental and natural resources: The econometrics of non-market valuation. Edward Elgar Publishing.
- Haile, G. G., & Kasa, A. K. (2015). Irrigation in Ethiopia: A review. Academia Journal of Agricultural Research, 3(10), 264–269.
- Hanemann, M., Loomis, J., & Kanninen, B. (1991). Statistical efficiency of double‐bounded dichotomous choice contingent valuation. American Journal of Agricultural Economics, 73(4), 1255–1263. https://doi.org/10.2307/1242453
- Hanemann, W. M., & Kanninen, B. (1996). The statistical analysis of discrete-response CV data.
- K, A., Solow, R., Portney, P. R., Leamer, E. E., Radner, R., & Schuman, H. (1993). Report of the NOAA panel on contingent valuation. Federal Register, 58, 4601–4614.
- Kassahun, H. T. (2009). Payment for environmental service to enhance resource use efficiency and labor force participation in managing and maintaining irrigation infrastructures: The case of upper blue nile basin. Cornell University.
- Kedir, A. (2011). Contingent valuation technique: A review of literature. Journal of Health and Environmental Sciences, 1(1), 8–16.
- Kljajic, N., Vukovic, P., & Arsic, S. (2013). Current situation in irrigation in the republic of serbia. in sustainable technologies, policies, and constraints in the green economy (pp. 123–139). IGI Global.
- Krinsky, I., & Robb, A. L. (1986). On approximating the statistical properties of elasticities. The Review of Economics and Statistics, 68(4), 715–719. https://doi.org/10.2307/1924536
- Mekuria, W. (2010). Effectiveness of modular training at farmers’ training center: the case of fogera district, Amhara national regional State. Haramaya University.
- Mequanent, D. (2021). Impact of irrigation practices on Gilgel Abay, Ribb and Gumara fisheries, Tana Sub-Basin, Ethiopia. Heliyon, 7(3), e06523. https://doi.org/10.1016/j.heliyon.2021.e06523
- Meseret Birhane and Endrias Geta. (2016). Determinants of farmers’ willingness to pay for irrigation water use: The case of Agarfa district, Bale Zone Oromia national regional State. Journal of Agricultural Economics and Rural Development, 3(1), 073–078.
- Mezgebo, A., Tessema, W., & Asfaw, Z. (2013). Economic values of irrigation water in Wondo Genet District, Ethiopia: An application of contingent valuation method. Journal of Economics and Sustainable Development, 4(2), 23–36.
- Mezgebo, G. K., & Ewnetu, Z. (2015). Households willingness to pay for improved water services in Urban areas: A case study from Nebelet town, Ethiopia. Journal of Development and Agricultural Economics, 7(1), 12–19. https://doi.org/10.5897/JDAE2014.0604
- Ministry of Agriculture (MOA) 2005 Fogera woreda pilot learning site diagnosis and program design. ILRI Fogera PLS planning workshop program 2004 October 12;Woreta Town
- Mitchell, R. C., & Carson, R. T. (2013). Using surveys to value public goods: The contingent valuation method. Rff Press.
- Ndlovu, T. (2015). Farmer participation: A drive towards sustainable agricultural production in makwe irrigation scheme, Zimbabwe. Glob. J. Agric. Econ. Ext. Rural Dev, 3, 308–320.
- Perman, R. M. G. J., & Common, M. (2003). Natural resource and environmental economics (3rd ed.). Person education limited printed and bounded By Bell and Bain Ltd.
- Shiferaw, P. A., & Hamito, D. (2002). Determinants of farmers’ willingness to participate in Soil conservation practices in the highlands of bale: the case of dinsho farming system area. Haramaya University.
- Teshome, A., & Halefom, A. (2020). Potential land suitability identification for surface irrigation: In case of Gumara watershed, blue nile basin, Ethiopia. Modeling Earth Systems and Environment, 6(2), 929–942. https://doi.org/10.1007/s40808-020-00729-6
- Tolera, T., Legesse, B., & Aman, M. (2019). Determinants of farmers’ willingness to pay for improved irrigation water use: the Case of woliso district, Ethiopia. International Journal of Rural Development, Environment and Health Research, 32456–38678.
- Worku, Y., Alem, T., & Abegaze, S. (2015). Socio-economic characterization of the Gumara-maksegnit watershed, in mitigating land degradation and improving livelihoods. Routledge.
- Yaman. (1967). Statistics: An introductory analysis.
- Yibeltal, W. (2018). Willingness to pay for watershed protection by domestic water users in Gondar town, Ethiopia. International Journal of Applied Research, 1(10), 475–48.
- Zakaria, H. (2014). Factors affecting farmers willingness to pay for improved irrigation service: A case study of bontanga irrigation scheme in Northern Ghana