
 ?Mathematical formulae have been encoded as MathML and are displayed in this HTML version using MathJax in order to improve their display. Uncheck the box to turn MathJax off. This feature requires Javascript. Click on a formula to zoom.
Abstract
This study aims to analyze the economic impacts of infrastructure investment in Africa, focusing on the Guinea-Bissau economy. Through a dynamic CGE model, we find that the natural resource revenues (or aid)-funded infrastructure investments generate externalities that increase factor returns. The private investment improvements propagate externalities effects on GDP and job opportunities outcomes. Household income and consumption were positively impacted, though the poorer benefited the most. The income inequality has reduced. However, funding by the mix of debt and direct taxes produces opposite effects. We suggest a potential pro-poor growth agenda in Africa.
1. Introduction
It is well known that one of the so-called African puzzles is the difficulty of growth facing the continent. Several institutional reforms stemming from structural adjustment programs (SAP) and economic openness in the mid-1980s and 1990s had produced marginal economic outcomes. Presumably, two arguments stand out. First, tariffs have no effects as they did years ago because the trading patterns have changed. Second, SAPs in the 1980s have led African governments to reduce investments in physical infrastructure, preventing the potential for private investments (African Development Bank (AfDB), Citation2018).
The AfDB group 2018 annual report was dedicated to infrastructure issues on the continent. It argues that the characteristics of African economies are archaic, implying low economic growth, preventing the creation of employment opportunities, and spreading jobless among young people, the reason why pro-poor growth is more challenging to implement. The dynamization of African economies involves promoting industrialization since SAPs and trade reforms have failed to improve competitiveness, growth, and poverty reduction.
The imperative of industrialization finds an incentive path through investments in water, electricity, and transport services, aiming at reducing transaction costs and making firms as competitive as their ex-continental peers. According to the AfDB group, financing infrastructure in Africa should not be merely a resource issue. The financing gap of between 67.6–107.5 US billion could be plugged by between 130–170 US billion a year in infrastructure investments that generate the economy’s growth and attract the inflow of private capital and firms from advanced economies. This paper explores some financing alternatives that African countries facing resource scarcity may use to bring on growth.
We aim to analyze the macro and micro levels implications of the public infrastructure investment in Guinea-Bissau using a recursive dynamic CGE model. The focus on Guinea-Bissau is justified, as it is a country that has also carried out structural reforms in the past but failed to achieve the expected results. Especially, Guinea-Bissau is still one of the poorest countries in Africa since about 69 percent of the population lives in absolute poverty (World Bank, Citation2019). It is a country with a low supply of infrastructure services and unpaved roads. As it has an agricultural-based economy and government revenues come primarily from trade taxes, fluctuations in agricultural production make sustaining development project financing even more difficult.
There is a vast literature on the economic impacts of infrastructure investments (Calderón et al., Citation2015; Calderón & Servén, Citation2014; Chakamera & Alagidede, Citation2018; Lokshin & Yemtsov, Citation2005). Directly, investment in infrastructure improves production efficiency and increases output per unit of capital (Chatterjee & AKM, Citation2011). Indirectly, infrastructure investment impacts broader economic outcomes. For instance, economic growth from improved factor productivity can increase household income and consumption (Calderón & Chong, Citation2004) and reduce income inequality (Zou et al., Citation2008) and transaction costs (Warner, Citation2014).
This study fits in various work on public investment economic outcomes (Chitiga et al., Citation2016; Go et al., Citation2016; Sangare & Maisonnave, Citation2018; Vanduzai & Chitiga, Citation2017). Sangare and Maisonnave (Citation2018) used a CGE model to examine the economic effects of public spending options from natural resources revenues in Nigeria. They found evidence that public spending in infrastructure increases public and private employee consumption by about 0.02% and agricultural employment by 0.03% in the long run, respectively.
Vanduzai and Chitiga (Citation2017) examined the implications for growth and employment of public economic infrastructure investment in South Africa using a recursive dynamic CGE model. They analyzed three scenarios, namely adjustment in government deficit, taxation, and a combination of government deficit and tax. Both scenarios produced positive macro results, but the third scenario contributes more to increasing GDP, employment, and private investment in the long run. The households’ income and consumption increased by about 0.10% and 0.36%, respectively, as unemployment and price level decline.
Go et al. (Citation2016) studied spending strategies for Niger from oil and uranium export revenues. They found that when the government uses additional resources to increase public infrastructure, GDP and household income increase more than when it adopts lump-sum transfer type. In cases where exogenous mineral export income is used to raise human and public capital, that is, to improve productivity, the consumption and (non-oil) GDP, respectively, increase by about 9.2% and 8.8% a year.
Chitiga et al. (Citation2016) used a dynamic CGE model to examine the impacts of infrastructure investments financed in various forms in South Africa. Deficit-financed infrastructure investment increases agricultural production by about 0.03% in the long run and the production of the food sector by 0.92%. The households were benefited because of the decrease in unemployment and the increase in wages share in income gains. In fiscal scenario for which investments in infrastructure are financed via changes in the tax scale, they found that infrastructure financed by firm tax is less harmful to GDP and across all categories of workers.
Most closely related works to ours are Savard and Adjovi (Citation1998), Adam and Bevan (Citation2006), Savard (Citation2009), Savard (Citation2010), Estache et al. (Citation2012), and Boccanfuso et al. (Citation2014). Like them, we model externalities of public infrastructure investment; however, we deal with an economy with different characteristics.
This paper contributes to these past studies in several directions. First, although infrastructure has been placed as an engine of growth, little has been done to analyze its economic impacts in Guinea-Bissau. This study is the first attempt to analyze productive spillovers and the distributive effects of infrastructure investment in this country. Second, the dynamic structure of our model, the first to be applied to this economy, takes into account investment lags since new investments may take l time to manifest into the economy as a whole. Third, unlike previous studies, there is not only one representative family, but several household groups and workers with different initial conditions living in rural and urban environments. New infrastructure may impact individuals differently, according to their location. We therefore examine individual income gains and long-term consumption before and after implementation of the investment program to assert its implications for poverty alleviation. Finally, the infrastructure funding schemes can allow us to understand how a government in poor countries may rationalize scarce resources to boost productive investments.
The remainder of this study is structured as follows: Section 2 briefly builds the theoretical framework. Section 3 presents and discusses the results. Sections 4 and 5 policy implications and limitations, respectively. Section 6 concludes.
2. Theoretical framework
We build on previous works that explicitly model the externalities of public infrastructure investment (e.g., Estache et al., Citation2012; Savard, Citation2009, Citation2010). The closest work to ours is Boccanfuso et al. (Citation2014).
Let representing the government g revenues at time t, given by:
where ;
and
are the direct taxes on household h and firms f’ incomes, respectively;
are the indirect taxes on industry production;
are the imports duties on commodity; and
are transfers from households (
), firms (
) and rest of the world, row, (
).
First the government can finance infrastructure investments, therefore, using tax resources. Income taxes are described in EquationEq. 2(2)
(2) and Equation3
(3)
(3) as linear functions of total incomes of households (
) and firms (
), respectively. In both equations the marginal rate (
) is different from the average rate of taxation for non-zero intercepts (
) that are fully indexed to changes in the consumer price index (
).
Second, the government also may fund investment using transfers from abroad (). Row transfers are equal to their SAM values (
) and grow each period at the same population (
) growth rate (EquationEq.4)
(4)
(4) .
However, the government may face budgetary constraints to fund infrastructure investments. Current government budget () constraint (EquationEq. 5)
(5)
(5) is difference between government revenue and its expenditures, which consist of transfers to non-governmental agents (
) and current expenditures on goods and services (
).
From this relationship, the government may adjust the current budget or deficit as a funding mechanism (EquationEq.6)(6)
(6) as follows:
If effectively implemented, infrastructure investments can have externalities on the economy. The externality of public infrastructure investment has the following functional form:
where, at time t, is the externality (or sectoral productivity effect) as a function of the ratio of current stock of public capital (
) over public capital of the previous period (
), and
is a sector-specific elasticity.
At the macro level, the government spending in infrastructure investment program may rise the public capital stock and generate a positive production externality. The propagation occurs first through value-added () Equationequation (8)
(8)
(8) :
where is the scale parameter;
and
the labor and capital demand by industry
, respectively; and
the Cobb–Douglas parameter.
Note that represents a productivity improvement, so that public investment in infrastructure may act as a source of comparative advantage (Estache et al. (Citation2012).
At the micro-level, there are income and prices effects that impact the individual welfare components. The production growth may lower food prices, while an increase in employment may improve household income gains. This assumption is consistent with past works by Irz et al. (Citation2001), Minten and Barrett (Citation2008), and DeJanvry and Sadoulet (Citation2002) and De Janvry & Sadoulet (Citation2010), in which productivity improvements in agricultural -based economy led to growth in total product and food prices reduction.
2.1. Database
We use a SAM for Guinea-Bissau with seven sectors from International Food Policy Research Institute. Based on the work by Thiele and Piazolo (Citation2002), we calculated the added value and share of formal and informal activities by sector. Since this SAM contains formal activities, the consideration of informal activities includes only the weighted values of informal, defined as the proportion of informality in a sector activity multiplied by its share in the value-added ().
Table 1. Share of formal and informal activities in the agricultural sectors, 2014
Next, we have used the 2014 official minimum wage to disaggregate households in two urban and two rural types and then emerge the resulting shares with every row and column in the SAM to obtain an updated 2014 SAM ().
Table 2. Household disaggregation by minimum wage
summarizes four scenarios of simulation. The main scenario is one when investment is funded 100 per cent by natural resources. The choice of this scenario is justified because natural resources generate about 30% of the country’s wealth (Guinea-Bissau, Citation2015). According to Boccanfuso et al. (Citation2014), a government may follow a tax-based infrastructure financing scheme. Thus, scenarios from 2 to 4 are alternatives strategies as the robustness checks of scenario 1 outcomes. The goal is to conduct a comparative analysis of various funding schemes for implementing infrastructure investment.
Table 3. Simulations of different scenarios for infrastructure investment
We refer to the Gini coefficient measurements to establish income inequality. The Gini index measures the concentration of incomes between the extremes of 0 (absolute equality) and 1 (maximum inequality). It can tell us how unequal the current policy scenarios will be across period.
3. Results
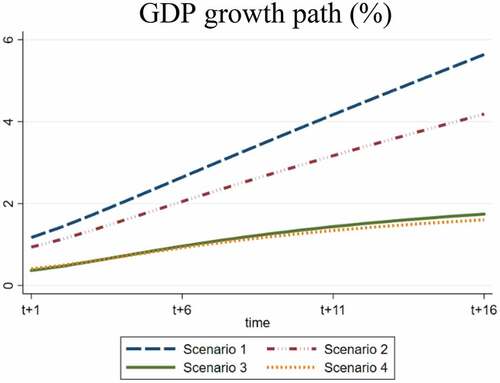
This section discusses the results of the simulation scenarios, starting with the macro impacts and then moving on to sectoral and household level implications. The GDP path growth traced from a 1% increase in infrastructure investment financed by various mechanisms is shown in . Both scenarios imply a positive trajectory of GDP over sixteen periods (i.e., from the year 2015 to 2030). The growth trajectory is higher when natural resource revenues or foreign aid resources are used to finance new infrastructure construction than when the government uses direct taxes to fund the investment program. The general equilibrium is as follows: an increase in infrastructure investment by 1% generates positive externalities observed by the level of economic activity. The added value of each sector increases, which leads to an increase in production and supply of goods at a lower price. The aggregate demand, household income, and consumption must rise.
Figure 1. GDP growth path (%).
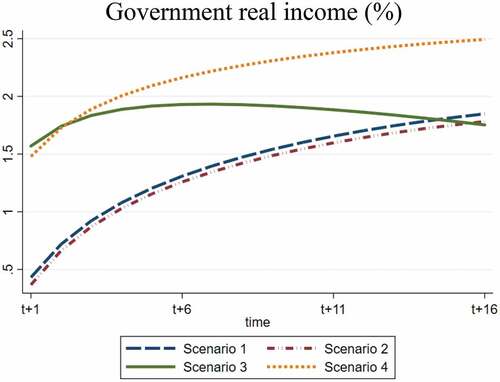
Government revenues from household income taxes decrease each period, implying a reduction in the resources available to the government to maintain its investment expenditure (). There is a loss of efficiency that prevents externalities from the construction sector from being propagated over time. On the other hand, financing through natural resources and aid increases government revenue, implying more minor financing needs for infrastructure investment. As a result, the amount required for investment purposes may not entirely come from the natural resources revenues or aid.
Figure 2. Government real income (%).
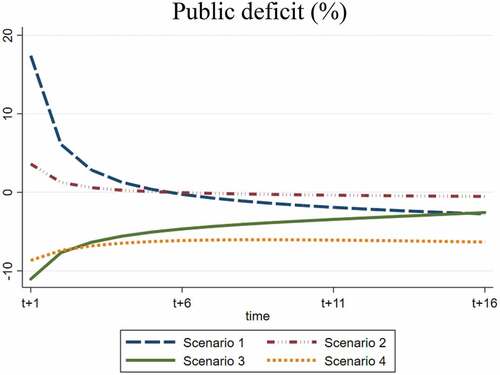
The deficit decreases in scenarios where the growth implied an increase in government revenue (). Thus, the government can finance investments using the own revenues from growth generated by initial investment in infrastructure instead of natural resource revenues or aid.
Figure 3. Public deficit (%).
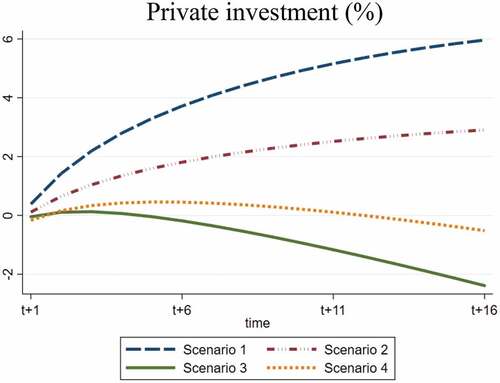
Natural resource revenues and aid-funded strategies have increased private investments () since the externalities generated implied a greater return on private capital. Conversely, in scenarios 3 and 4, private investment decreased because public investments financed by taxes on firms’ revenues have resulted in a lower return on capital allocated to the sectors’ production, hindering the propagation of the initial impacts.
Figure 4. Private investment (%).
reports the results of externalities and value-added by sector. There are positive externalities across industries from the current infrastructure funding strategies, though each sector responds differently to the shock performed. The agricultural food sector, industries, and non-tradable services sector concentrated most of the externality gains. The externalities are higher when infrastructure investment is funded by natural resources revenues and foreign aid than by mixed debt and direct taxes. The productivity externalities partially explained the value-added sector results. In scenarios 1 and 2, the productivity improvements observed implied an increase in the added value of agricultural food activities, industries, and the non-tradable services sector. The value-added outcomes have reflected the improvements in capital returns, which have increased the volume of private investment allocated to each industry. Conversely, we observe that the cumulative effects of externalities are insufficient to offset the lower factor return generated by scaling-up direct taxes as financing sources. The non-tradable sectors, where the return to the capital increases, concentrate the impacts.
Table 4. Externalities and value-added (% in t + 16)
Regarding job opportunities by worker skill level from the current funding schemes, strategies 1 and 2 positively impact the employment outcomes (). The effects are more significant across unskilled workers in rural and urban settings due to the increased demand in activities that is intensive in unskilled labor. On the other hand, funding schemes 3 and 4 have implied fewer job opportunities across workers, in which case the skilled rural worker jobs are the most affected.
Table 5. Employment (% in t + 16)
The natural resources and aid-financing strategies 1 and 2 positively impact households’ real income and consumption (). The more significant impact of financing scheme by natural resources reflects its effects on labor income gains. The poorer are the beneficiaries since their labor incomes have increased the most; however, in strategy 2, the non-poor has benefited the most when capital income plays a vital role in income outcomes. Conversely, strategies 3 and 4 negatively impacted the households gains in rural and urban areas. In this case, labor and capital incomes decrease, whereas the transfers from the government to the households were insufficient to generate positive income outcomes. Additionally, we observe that consumption increases with accumulated income but shrinks when financing strategies diminish income gains.
Table 6. Household level impacts (% in t + 16)
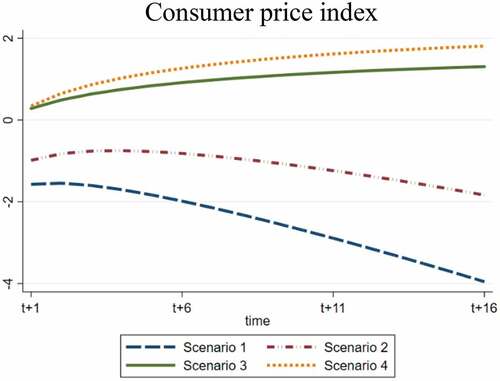
The income gains are essential for the nominal consumption outcomes; however, real consumption improvements are primarily due to the fall in the consumer price index (). By strategy 1, the increase in agricultural food production led to a fall in food prices, benefiting the consumption of poor households in urban and rural environments the most. In the strategies 2, the non-poor families have benefited the most in terms of increasing real consumption. Conversely, financing by mixing debt and direct taxes reduces income and increases the consumer price index. As a result, household consumption has drastically abridged in urban and rural settings.
Figure 5. Consumer price index.
There is a transmission from income and consumption results to household savings, which had increased when scenarios 1 and 2 were implemented but decreased with scenarios 3 and 4 in effect (). The poor save more than the non-poor because their disposable income has grown more. This dynamic adjustment is significant. First, increasing household savings rises the amount of total investment allocated to each economic activity. Second, the need of foreign aid to finance infrastructure investments decreases as the government can borrow from domestic agents. Finally, the requirement of government transfers to households in the form of direct assistance is mitigated. In this case, we observe that a significant part of the resources available for the government to maintain its investment spending is due to this transfer drops to private agents.
Table 7. Household saving (% in t + 16)
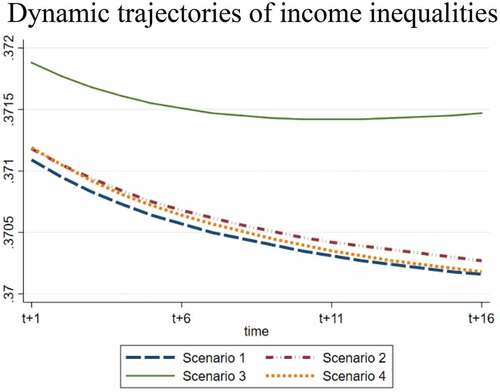
The observation that the poor gain and save more than the non-poor can have significant distributive implications. Adjustments that lead to household gains occur via saving that changes the individual’s wealth accumulation over time. The concentration of income in each group of individuals signals that pro-poor growth is not sustainable because it can perpetuate the inequality of opportunities between groups of individuals with different ex-post economic conditions. We trace the dynamic trajectories of income inequality (). Briefly, current financing strategies potentially reduce income inequality. Infrastructure investment financed by natural resource revenues decreases more the income gap over the period, while direct taxes on firms’ income will imply greater income inequality, rising slightly in later periods.
Figure 6. Dynamic trajectories of income inequalities.
We find some consistency between our findings and previous works. However, the model assumptions and the structure of the data may reflect the characteristics of each economy. For instance, Calderón and Servén (Citation2004) estimated the relationship between infrastructure development and income distribution for 1960–97 using cross-country and dynamic GMM panel regressions. They found evidence that 1% increase in infrastructure availability decreases income inequality by about 4.9% in developing economies versus 3.2% in all countries. The quality of infrastructure is more important in the former but less influential in the latter, a prelude to the model by Chatterjee and Turnovsky (Citation2012), which suggests that better infrastructure quantity reduced income inequality.
Zou et al. (Citation2008) argue that availability of the infrastructure may increase poor rural workers job possibilities and income gains by decreasing the distance between the urban center and the field. They estimated the implications of transport infrastructure on growth and poverty alleviation in China over the period 1994–2002 (panel data) and 1978–2002 (time series data). They found evidence that transport systems (roads and railways) have significant effects on growth and that the output elasticity of capital is as high as 0.65%. Moreover, they showed that as road availability creates mobility of factors, labor and capital investments have increased. As a result, the income inequality was reduced by about −0.05% and −0.069%, respectively.
Agénor et al. (Citation2010) developed a macro model calibrated with Ethiopian economy data. They used this model to assess the impacts of aid on public investment, growth, and the poor linking the model to a household survey. They find evidence that a 1% increase in foreign aid leads to an initial increase in public investment in the order of 0.7% of GDP. Over time, output grows at a higher rate of approximately 0.2 percentage points as the infrastructure investment crowds in private investment. Calderón and Servén (Citation2010) also assessed the impact of infrastructure development on growth and inequality in Sub-Saharan Africa for 1960–2005. They found evidence that the infrastructure stocks positively affected long run growth (0.3397%) but negatively impact income inequality (−0.5667%). They show that reducing Sub-Saharan Africa’s infrastructure gap to advanced economies requires approximately 15% of GDP in additional investment. Moreover, Calderón and Servén (Citation2014) saw a fall in income inequality of 0.5667. We find a decreasing trajectory of income inequality as the government uses its revenues from natural resources to fund infrastructure construction.
4. Policy implications
The political implications of this study for Guinea-Bissau’s economy can be understood by presenting the challenge of promoting growth that this country has faced for nearly 50 years. Since independence in 1973, Guinean policymakers believed that to put the economy on a self-sustaining growth path is required a development model based on a planned economy. Thus, the centralized planning model was in force through the 1970s. During this period, however, there was a significant gap between potential and effective GDP since sectorial output did not respond to government policy initiatives. The persistent imbalances in government accounts aggravated public finance problems, limiting available resources to finance productive investment and policies to fight against poverty.
The centralized planning model was phased out in the mid-1986s with the implementation of the structural adjustment program (SAP). Many factors contributed to the failure of this model, notably the difficulty in executing the centralized plans and the agricultural crisis. As the tasks are divided among different departments, planning, implementing, and managing a planned economy is so complex since one department could neglect the interests of another related or complementary activity. The control mechanisms were not as sophisticated as they do nowadays so that resources could be used in other activities beyond the purpose. The government revenue applied to finance productive investment also depended on the performance of the agricultural sector since the government received the income from the capital invested in this sector. Thus, the drought in 1983 has reduced agricultural production by about 23%, and government revenue fell by 45% (World Bank, Citation2019).
Given the precariousness of the tax structure in a newly independent country, approximately 80 percent of the financial resources of the public sector were derived from external sources (Sanhá, Citation1988). But because the country practiced a one-party regime and a planned economic system controlled by a government, access to financial resources became restricted since most of the loans and aid received came from pro-democracy international organizations, such as the International Monetary Fund and World Bank. After reforms, multiparty regime and economic openness occurred in the 1980s. Since then, several funded-pro poor growth pilot programs have been implemented, such as the National Development Plan in 1983, the Structural Adjustment Program in 1989, the National Strategy for Poverty Reduction in 2005 and 2011, and the Infrastructure Investment Program in 2014. However, these programs failed as many of them were not implemented due to a lack of funding resources.
This study attempts to analyze that, for a country where the government faces resource constraints to finance initial growth, orienting natural revenues towards productive investments may boost growth. We found that as the government invests in infrastructure, the economy grows, increasing government revenue. Financing needs decrease as a result. Public investment externalities drive the return to the private, encouraging private agents to invest more.
The job opportunities responded to the dynamism in economic activities, which increase labor demand. The intensity and characteristics of the demanded worker reflect the intensity of use of factors by the sector. Unskilled workers benefited from demand by agricultural and food production industries, while skilled ones are impacted due to increasing demand for skilled workers in services sectors.
This result is significant for financing pro-poor growth programs. At the macro level, investment in infrastructure positively impacted output and employment, generating both price and income effects: as the production of a sector increases, the domestic supply of the product also grows, generating a decrease in food price. The improvement in employment opportunities causes an increase in household income. As the consumer price index decreases, families consume and save more. Accumulated wealth was essential to explain the fall in the trajectories of income inequality.
Our findings are significant; first, to inform how governments in countries that face severe financial resource constraints, such as Guinea-Bissau, must ration part of their revenue for product purposes. That could be a first step in solving the puzzle of growing difficulty and spreading it to families in Africa. The high informality in Africa prevents the governments from using other fundraising schemes to increase their revenue. In such a context, the increase in the scale of tariffs can generate tax evasion, and informal practices may increase as well (Chalfin, Citation2001; Golub, Citation2012; Golub & MBAYE, Citation2009). We found that externalities by increasing direct taxes strategies are penalized. The increase in government revenue has been insufficient to finance infrastructure investments continually, and the finding needs are still present even after the program has been completed. Second, many of the African countries enjoy a more significant number of natural resources. In Guinea-Bissau, existing natural resources include bauxite and copper, representing around 12% of government revenue. Managing these resources for productive purposes is a challenge that must be faced. This study can contribute to the debate on how governments in Africa may use natural resource revenues to finance development programs.
5. Limitations and future works
It is worth mentioning financial and economic complexities within our theoretical framework that can be addressed in future studies. The investment shock was in the construction sector and propagated in the economy through transaction costs savings. For example, the availability of the infrastructure may enable agriculture producers to have access to inputs (Sahoo & Dash, Citation2012; Warner, Citation2014). Vehicle operating and freight cost savings will increase agricultural production and economic growth with more significant job and income opportunities for the poor. Additionally, infrastructure provision can serve to support other pro-poor pilot programs to produce the desired effects. Previous studies suggest that incremental infrastructure improvement in disadvantaged areas can bring considerable economic benefits than in wealthier areas (Calderón & Chong, 2010).
However, several aspects may hinder the applicability of this study in some African countries. First, the impacts of social infrastructure investment on GDP and jobs may depend on a completely different set of financial benefits. Second, while the priority of development institutions in Africa has been prioritizing the financing of infrastructure construction, this does not seem to be the focus of individual countries. In several Sub-Saharan African countries, governments are still carrying out administrative reforms to complete their economies’ regional and international insertion that began in the 1990s. The infrastructure sector receives a smaller share of funding than many other projects for the millennium development goals. Third, new infrastructure constructions can bring a higher medium-term cost to the government than, for example, encouraging the modernization of the agricultural sector. These costs can compromise the long-term impacts of new investments. Fifth, infrastructure investment externalities may depend on sectoral development and the degree of regional integration. Sixth, the effect of investment in infrastructure at the household level may be compromised by shocks such as Covid-19, which force governments to reallocate resources to short-term challenges. Finally, accountability must be taken into account in any financing schemes. Future studies should consider the existing institutional framework. Methodologically, a regional CGE model can best capture the reality of the Guinean economy.
6. Conclusion
This study analyzed the macro, sectoral, and household levels impacts of funded infrastructure investments in Africa. It took as an example of a developing country facing resource scarcity. Primarily, we develop a recursive dynamic CGE model for the economy of Guinea-Bissau. A one percent increase of infrastructure investments financed by natural resources generates externalities that positively impact the trajectory of GDP growth, job opportunities, income, and consumption outcomes. The supply of infrastructure increases returns on capital, which amplified the investment allocated to each sector, increasing sectorial value-added. The poor workers and households in rural and urban settings have beneficiated the most. The external aid financing strategy produces similar, albeit lesser, results; and in a situation where non-poor households are the most beneficiaries. The income inequality reduction indicates that current debt-based funding schemes can provide economic outcomes favoring the poor. Meanwhile, in the direct tax schemes, the initial externalities are insufficient to produce positive long-term macro and household-level results as they adversely affected the return to the capital.
The African puzzle may be solved by adopting various strategies to implement pro-poor growth. The format and type of the pilot program, however, may reflect each country’s characteristics. We suggest that in developing countries, such as Guinea-Bissau, the initial impetus for growth can be via natural resources to finance infrastructure construction. In the absence of such recourse, these countries can still use foreign aid to boost productivity. Scaling up taxes and debt to bring growth is less productive and distributive.
Disclosure statement
No potential conflict of interest was reported by the author(s).
Data availability statement
Data will be shared upon request.
Additional information
Funding
References
- Guinea-Bissau. (2015). Plan Strategique et Operationnel 2015-2020 « Terra Ranka » Document II: Rapport Final, 198pp. UNESCO. Guinea-Bissau.
- Adam, C., & Bevan, D. (2006). Aid and the supply side: Public investment, export performance and Dutch in low-income countries. World Bank Economic Review, 20(2), 261–16. https://doi.org/10.1093/wber/lhj011
- African Development Bank (AfDB). (2018). African economic outlook 2018: Macroeconomic developments and structural change: Infrastructure and its financing.
- Agénor, P. R., Bayraktar, N., & AynaouI, K. E. (2010). Roads out of Poverty? Assessing the links between aid, public investment, growth, and poverty reduction. Journal of Development Economics, 86(2), 277–295. https://doi.org/10.1016/j.jdeveco.2007.07.001
- Boccanfuso, D., Joanis, M., Richard, P., & Savard, L. (2014). A comparative analysis of funding schemes for public infrastructure spending in Quebec. Applied Economics, 46(2), 1–12. https://doi.org/10.1080/00036846.2014.909576
- Calderón, C., & Chong, A. (2004). Volume and quality of infrastructure and the distribution of income: An empirical investigation. Review of Income and Wealth, 50(1), 87–105. https://doi.org/10.1111/j.0034-6586.2004.00113.x
- Calderón, C., & Servén, L. (2010). Infrastructure and economic development in Sub-Saharan Africa. Journal of African Economies, 19(suppl_1), i13–i87. https://doi.org/10.1093/jae/ejp022
- Calderón, C., & Servén, L. (2014). Infrastructure, growth, and inequality: An overview. World Bank Policy Research Working Paper. No. 7034, World Bank, Washington, DC.
- Calderón, C., Moral‐Benito, E., & Servén, L. (2015). Is infrastructure capital productive? A dynamic heterogeneous approach. Journal of Applied Econometrics, 30(2), 177–198. https://doi.org/10.1002/jae.2373
- Chakamera, C., & Alagidede, P. (2018). The nexus between infrastructure (quantity and quality) and economic growth in Sub Saharan Africa. International Review of Applied Economics, 32(5), 641–672. https://doi.org/10.1080/02692171.2017.1355356
- Chalfin, B. (2001). Border zone trade and the economic boundaries of the State in North-East Ghana. Africa, 71(2), 202–224. https://doi.org/10.3366/afr.2001.71.2.202
- Chatterjee, S., & AKM, M. M. (2011). Infrastructure provision and macroeconomic performance. Journal of Economic Dynamics and Control, 35(8), 1288–1306. https://doi.org/10.1016/j.jedc.2011.03.007
- Chatterjee, S., & Turnovsky, S. J. (2012). Infrastructure and inequality. European Economic Review, 56(8), 1730–1745. https://doi.org/10.1016/j.euroecorev.2012.08.003
- Chitiga, M., Mabugu, R., & Maisonnave, H. (2016). Analyzing job creation effects of scaling up infrastructure spending in South Africa (pp. 1–16). Development Southern Africa.
- De Janvry, A., & Sadoulet, E. (2010). Agricultural growth and poverty reduction: Additional evidence. World Bank Research Observer, 25(1), 1–20. https://doi.org/10.1093/wbro/lkp015
- DeJanvry, A., & Sadoulet, E. (2002). World poverty and the role of agricultural technology: Direct and indirect effects. Journal of Development Studies, 38(4), 1–16. https://doi.org/10.1080/00220380412331322401
- Estache, A., Perrault, J.-F., & Savard, L. (2012). The impact of infrastructure spending in Sub-Saharan Africa: A CGE Modeling Approach. Economics Research International, 012(18), 01–18. https://doi.org/10.1155/2012/875287
- Go, D., Robinson, S., & Thierfelder, K. (2016). Natural resource revenue, spending strategies and economic growth in Niger. Economic Modelling, 52(PB), 564–573. https://doi.org/10.1016/j.econmod.2015.10.001
- Golub, S. S., & MBAYE, A. A. (2009). National trade policies and smuggling in Africa: The case of the Gambia and Senegal. World Development, 37(3), 595–606. https://doi.org/10.1016/j.worlddev.2008.08.006
- Golub, S. S. (2012). Entrepôt trade and smuggling in West Africa: Benin, Togo, and Nigeria. The World Economy, 35(9), 1139–1161. https://doi.org/10.1111/j.1467-9701.2012.01469.x
- IFPRI: International Food Policy Research Institute. Social accounting matrix for Guinea Bissau. AGRODEP Data Report, n.05. IFPRI. http://www.agrodep.org/dataset/2007-social-accounting-matrix-sam-guinea-bissau
- INEC (Institute National of Statistics)-MICS (Guinea-Bissau Multiple Indicators Survey. (2014). Available on: https://mics.unicef.org/surveys
- Irz, X., Lin, L., Thirtle, C., & Wiggins, S. (2001). Agricultural productivity growth and poverty alleviation. Development Policy Review, 19(4), 449–466. https://doi.org/10.1111/1467-7679.00144
- Lokshin, M., & Yemtsov, R. (2005). Has rural infrastructure rehabilitation in Georgia helped the poor? The World Bank Economic Review, 19(2), 311–333. https://doi.org/10.1093/wber/lhi007
- Minten, B., & Barrett, C. (2008). Agricultural technology, productivity and poverty in Madagascar. World Development, 36(5), 797–822. https://doi.org/10.1016/j.worlddev.2007.05.004
- Sahoo, P., & Dash, R. K. (2012). Economic growth in South Asia: Role of infrastructure. The Journal of International Trade & Economic Development, 21(2), 217–252. https://doi.org/10.1080/09638191003596994
- Sangare, S., & Maisonnave, H. (2018). Mining and petroleum boom and public spending policies in Niger: A dynamic computable general equilibrium analysis. Environment and Development Economics, 23(5), 1–11. https://doi.org/10.1017/S1355770X18000104
- Sanhá, I. (1988). Guiné-Bissau: Programa de Ajustamento Estrutural. Boletim de Informação sócio-Econômica, Ano, 3, 37–52.
- Savard, L., & Adjovi, É. (1998). Externalités de la santé et de l’éducation et bien-être: Un modèle d’équilibre général calculable appliqué au Bénin. L’actualité Économique, 74(3), 523–560. https://doi.org/10.7202/602273ar
- Savard, L. (2009). Impact Evaluation of infrastructure programs: A review and user guide for application of CGE micro-simulation. Impact Evaluation of infrastructure program. Université de Sherbrooke. Report 2009. 105.
- Savard, L. (2010). Scaling up infrastructure spending in the Philippines: A cge top- down bottom-up microsimulation approach. International Journal of Micro-simulation, 3(1), 43–59. https://doi.org/10.34196/ijm.00024
- Thiele, R., & Piazolo, D. (2002). Constructing a social accounting matrix with a distributional focus - the case of Bolivia. Kiel Working Paper No. 1094, Kiel Institute for the World Economy. https://ssrn.com/abstract=299160_or_http://dx.doi.org/10.2139/ssrn.299160.
- Vanduzai, M., & Chitiga, M. (2017). Growth and employment impacts of public economic infrastructure investment in South Africa: A dynamic CGE analysis. Journal of Economic and Financial Sciences, 10(2), 235–252. https://doi.org/10.4102/jef.v10i2.15
- Warner, A. M. (2014). Public investment as an engine of growth. International Monetary Fund. Working Paper, 148, 76.
- World Bank. (2019). World development indicators. http://worldbank.org
- Zou, W., Zhang, F., Zhuang, Z., & Song, H. (2008). Transport infrastructure, growth, and poverty alleviation: Empirical analysis of China. Annals of Economics & Finance, 9(2), 345–371.