
 ?Mathematical formulae have been encoded as MathML and are displayed in this HTML version using MathJax in order to improve their display. Uncheck the box to turn MathJax off. This feature requires Javascript. Click on a formula to zoom.
Abstract
This study aimed to estimate the Technical Efficiency (TE) of youth crop farmers in Njombe Region of Tanzania, and analyze the determinants of technical inefficiency for crops produced. Data were collected from 572 youths in 16 villages of Njombe Region by using a random sampling technique. The Stochastic Production Function (SPF) model analysed technical efficiency among the youth crop farmers. Results show that youth crop farmers in the study region exhibited decreasing returns to scale, as confirmed by the Returns to Scale of 0.275. The mean TE of crops produced was 19.32%, implying that youth farmers still have room to improve their farming efficiency by 80.68% using the same land resources. Most youth farmers had technical efficiency scores from 18.5% to 20.5%. In addition, the estimated SPF model and inefficiency parameters showed that age, land ownership, and extension contact are factors which reduced technical inefficiency in the study region. Thus, more emphasis might focus on enhancing the accessibility of youth farmers to extension services, land ownership, and efficient use of farm inputs might improve the TE of youth crop farmers in Tanzania and the world as a whole.
PUBLIC INTEREST STATEMENT
An efficient production system in the agricultural sector is vital for overall development. It provides food security, raw material for industries, and employment globally. Crop production in Tanzania is vital for national food security and nutrition, employment, industrial raw material and foreign earnings, which is very important for the country’s economic development. Moreover, crop production contributes to SDGs 1 and 2 (No poverty and zero hunger). However, the study indicates that youth crop farmers have very low technical efficiency of 19.32%, implying that they still have room to improve their farming efficiency by 80.68% using the same land resources. This would enable youth to obtain maximum output from their given inputs. Thus, more emphasis must focus on enhancing the accessibility of youth farmers to extension services, and efficient use of farm inputs might increase the technical efficiency of youth farmers in Tanzania and the world as a whole.
1. Introduction
Agriculture is an important sector in the economic development, food and nutrition security, and poverty reduction drives of many countries (New Partnership for African Development (NEPAD), Citation2013). The importance of this sector is more noticeable in Tanzania, where it accounts for food security (100%), export earnings (30%), and employs about 65.5% of the labour force in the country; it contributes to 29% of GDP and 65% to industrial raw materials (Chongela, Citation2015; United Republic of Tanzania (URT), Citation2019). Again, horticulture is one agricultural sub-sector that can attract youth to participate in agribusinesses. Horticulture provides quick yields and returns on investment (short growing season average of 3 months) and requires limited land (0.1 to 2.0 hectares) (Horticultural Development Council of Tanzania (HODECT), Citation2010). Horticulture is also more labour-intensive and generates more employment throughout the short crop cycle (planting, weeding, and harvesting) than staple crops (Rajendran, Citation2014).
In Tanzania, youth can contribute to economic development through their involvement in agriculture, which is the main activity in rural areas. Conversely, the Tanzanian population and housing census show that about 67 percent of the labour force, including youth between 15 and 35 years, are unemployed (Population and Housing Census (PHC), Citation2012). In Tanzania, agricultural production is still carried out using a hand hoe, which is inversely proportional to ageing. Unlike adults, youth are energetic, innovative, and risk-takers. They could take the lead in agriculture production to feed the world as most African farmers are older people averaging 60–70 years of age (Yami et al., Citation2019). Therefore, investing in rural youth is a key to enhancing agricultural productivity, food, and nutrition security, boosting rural economies, and creating employment (FAO, OECD, Citation2014).
Meanwhile, the low productivity of land and labour hinders the growth of agriculture. Numerous factors cause this situation. The key factors are poor production techniques, underdeveloped market infrastructure, farm-level value addition, poor rural infrastructure, including rural roads, telecommunications, and electricity, and inadequate agricultural finance (United Republic of Tanzania (URT), Citation2017). One way of improving productivity is to increase farm output by increasing technical efficiency.
This paper aims to estimate levels of productivity and TE of youth crop farmers in the Njombe region of Tanzania and analyze the determinants of technical inefficiency of crops produced. Various studies have examined the productivity and technical efficiency of smallholder farmers in Tanzania (Habiyaremye et al., Citation2019; Hepelwa, Citation2013; Kidane et al., Citation2013; Miho, Citation2017; Citation2008; Rajendran, Citation2014; Selejio et al., Citation2018). All focused on one cash or food crop or two crops, including food and cash crops in one area. Little attention has been placed on estimating the technical efficiency of youth crop farmers in Tanzania, focusing on accumulating different crop enterprises. The present study is relatively comprehensive as it analyzed different crop enterprises in one study area. This study also used SFA with STATA Version 15 powered by sfcross (StataCorp, Citation2015). This method allows simultaneous estimation of both inefficiency and unobserved heterogeneity, preferred over a two-step procedure (Wang & Ho, Citation2010). Many studies have focused on separating inefficiency and unobserved heterogeneity in cross-section data under stochastic frontier analysis using FRONTIER 4 (Habiyaremye et al., Citation2019; Ochieng & Hepelwa, Citation2018; Selejio et al., Citation2018). Hence, deliberate efforts to estimate the technical efficiency of youth crop farmers and its determinants motivated this study. The present study is relatively comprehensive as it analyzed different crop enterprises to understand the efficiency of youth in various crops they produce. This study has provided comprehensive strategic interventions for policymakers and private sectors to improve youth technical efficiency in their crop production. The article is organized as follows: After the introduction, the second part presents empirical literature on technical efficiency; a method for analysis section, along with the case study, data set, and the applied model; the empirical findings are presented and discussed in the results and discussion section; and finally conclusion and policy implications and limitation of the study.
2. Relevant literature on crop technical efficiency
According to the neo-classical definition of technical efficiency, a production process is technically efficient if it yields the maximum possible output from a given technology and input set level. The concept of efficiency can be explained more easily using input or output-oriented approaches. There are two approaches to measuring technical efficiency: output-oriented and input-oriented. In the output-oriented approach, the issue is to what extent output could be increased at a given level of inputs. While in the second approach, the interest is on the amount by which inputs could be minimized to achieve a technically efficient level of production (Asefa, Citation2011; Ngango & Kim, Citation2019; Yadava, Citation2021; Zewdie et al., Citation2021).
Moreover, there is a probability of increasing productivity through more efficient use of farmers’ resources with the given technology (Schultz Citation1964). The classical production theory is based on the view that firms are efficient and any actual output variation from the frontier is due to external shocks. According to the neo-classical production theory, different farmers can produce different output levels even if they use the same inputs and technology. The variation in observed outputs can be explained by external shocks and differences in efficiency using existing resources (Kidane et al., Citation2013). Frequently, many researchers used productivity and efficiency interchangeably and considered both as the measure of performance of a smallholder farmer. So far, these two phenomena are not equal (Asefa, Citation2011). According to Ellis (Citation1988) technical efficiency is the extent to which the best output level is produced from a given set of inputs. Moreover, a producer is allocatively efficient if production occurs in specific economic regions of the set production possibility. Therefore, if a farmer has achieved both technical and allocative efficiencies, he is economically efficient
2.1. Empirical studies on technical efficiency
Most empirical studies on the technical efficiency of farmers indicated that demographic economic, socioeconomic, institutional, environmental, and resource factors are the major determinants of efficiency differentials among farmers (Battese & Coelli, Citation1995; Kehinde et al., Citation2010; Mbehoma & Mutasa, Citation2013). For instance, Ahmed et al. (Citation2013), in analyzing farm households’ technical efficiency in the production of smallholder farmers in the Girawa District of Ethiopia, proved that farmers’ technical efficiency is positively associated with education, extension services, and livestock holdings, and use of irrigation. This indicates that education and extension services increase a farmer’s efficiency by increasing awareness and ability on the proper use of agricultural inputs and overall farm production management. Likewise, Ngango and Kim (Citation2019) in Rwanda found that education, access to credit, extension services, and an improved variety of coffee have positive and significant effects on technical efficiency. Similarly, Dessale (Citation2019) found that age, education, training, and improved seeds positively correlate with increasing TE of small-holder wheat-growing farmers of Ethiopia. Based on the available information, small-scale maize farmers in the East African countries of Ethiopia, Kenya, Tanzania, and Uganda are efficient at 57%, and thus, they can raise output with a limited combination of inputs without increasing the existing technology if they improve their technical efficiency by 43% (Kibirige et al., Citation2014). The low maize productivity and relative lower technical efficiency of maize farmers in East Africa may partly be explained by external shocks such as drought and floods, which hit the region hard between 2011 and 2012, resulting in hunger (IFAD, WFP, FAO, Citation2013). The most affected countries were Ethiopia and Kenya (IFAD, WFP, FAO, Citation2013). Thus, to mitigate hunger, East African countries have to improve their technical efficiency by about 43%. Moreover, improved productivity and technical efficiency are thought to reduce maize import budgets and these funds could be allocated elsewhere within the economy. In addition to that Empirical findings from this study provide the government and other stakeholders with the needed evidence towards achieving the sustainable development goals of eradicating poverty and hunger as well as the implementation of Tanzania’s Development vision 2025.
3. Methodology of the study
3.1. Description of the study area
The study was conducted in three administrative areas of the Njombe Region (Njombe Town Council, Njombe District Council, and Makambako Town Council). The data collection exercise was conducted from November 2018 to December 2018. The respondents in the study were youth aged between 15 and 35 years, as per the definition by the African Union Commission (African Union Commision (AUC), Citation2006). The districts were selected due to their potential in crop production. Cash crops grown in Njombe region are tea, coffee, vegetable, and fruit; major food crops are maize, Irish potato, and partly beans. Other crops include wheat, paddy, banana, sweet potato, and pyrethrum. According to (PHC Citation2012) Tanzania Population and Housing Census, about 67% of the labour force comprises youth aged between 15 and 35 years and they are mostly unemployed. The agriculture sector provides an opportunity for youth to be involved in crop production as a source of income-generating activity and to reduce rural poverty. In addition, youth provide labour force to the agriculture sector, which is important in increasing production, food security and reducing poverty.
Most youth farmers in the study area are small-scale farmers with an average farm size of one acre. As a result of the limited resources, youth are conscious of what to produce. It is known that allocating a given amount of resource to one enterprise automatically reduces the amount that can go to another enterprise. In addition, the youth farmers normally limit the acreage of a particular crop to what they can effectively manage. Again, the choice of crop and farm size is based on family food security and cash income for both farm operations and other cash requirements.
Cultivation practices of youth farmers in the study area involve using simple implements such as the hand hoe. Hired labour and family labour are the major sources of labour in the study area. Due to shortage of household labour during the peak period, farmers introduce hired labour. Most farmers in the study area produce mainly to meet household food security. The surplus is sold to meet other household needs. Male and female youth farmers in rural areas access market information, land, farm inputs, and output market differently. Hence, they operate at a different level of efficiency. This study collected data on youth farmers who cultivated food and horticulture crops.
3.2. Research design and sampling procedure
Three districts out of six district councils of Njombe Region were purposively selected based on horticultural potential. Sixteen villages out of 97 villages in the study districts were randomly selected. Those villages were Igongolo, Itipingi, Tagamenda, Ramadhani, Yakobi, Iwungilo, Mjimwema, Kifanya, Utalingolo, Lupembe, Ihang’ana, Welela, Ninga, Utengule, Kitandililo, and Ukalawa. With the help of village executive officers, a list of youth was prepared in each village, and 572 youth were chosen using a simple random selection method.
3.3. Primary data collection
A cross-sectional survey collected data from the three target district councils, namely the Njombe district council, Njombe town council and Makambako town council, whereby youth were the targeted respondents. Pre-tested questionnaires with open and closed-ended questions were used for the interview. Tablet with Survey CTO application was used for data and coordinate capturing. Primary qualitative data include access to land, education, extension contact, credit availability, poultry keeping, communication devices, marital status, gender and postharvest management innovation such as postharvest handling, packaging material and storage facility. The second group was primary quantitative data on age, household size, farm size, crop output, sales and farming experience were collected through surveys.
3.4. Model Specification
The technical efficiency (TE) is estimated using the stochastic frontier analysis (SFA) as indicated by (Habiyaremye et al., Citation2019; Hepelwa, Citation2013; Jote et al., Citation2018; Kehinde et al., Citation2010). The model was developed initially by Aigner, Lovell, Schmidt et al. (Citation1977a). The production and cost analysis in the stochastic frontier framework involves two steps. In the first step, the frontier model is usually estimated by maximum likelihood, while in the second, the estimated model is used to determine inefficiency measures. The technical relationship between inputs and outputs of a production process is described by a production function that establishes the maximum level of output attainable from a given input measure when using the stochastic frontier approach. This is the reason why it is called the production frontier. The SFA has been more popular because it can handle statistical noise, resulting in more accurate specifications. A more complete specification is essential for precise efficiency measures because the estimated frontier is conditional on the functional form. The stochastic frontier analysis is preferred because it differentiates the error term into two, according to sources; the component that incorporates unobserved factors beyond the farmer’s control and the error component depicting technical efficiency relative to the stochastic frontier (Meeusen & van den Broeck, Citation1977a; Sharma et al., Citation1999). There are two common methods used in analyzing productivity and TE in literature.
The two common methods used in literature are the Stochastic production frontier Analysis (SFA) and the Data Envelope Analysis (DEA). SFA resulted from ground-breaking works (Aigner, Lovell, Schmidt et al., Citation1977a; Meeusen & van den Broeck, Citation1977b) in estimating a stochastic frontier production function. The authors estimated two error terms: stochastic and one-sided errors signifying technical inefficiency. On the other hand, DEA was independently developed by (Charnes et al., Citation1978). DEA is a non-parametric approach that employs mathematical programming and assumes that deviation from the production frontier only results from technical inefficiency. The strength of DEA is its ability to accommodate numerous inputs and outputs and its non-specification of a functional form. However, the major drawback of DEA is its implicit assumption of no stochastic error.
Agriculture production in most African countries is typically rain-fed, is usually prone to shocks like weather and climate risks and the incidence of pests and diseases. Ignoring this may lead to biased estimates in our analysis. Hence, we adopt SFA in estimating productivity and TE level of youth crop farmers in Njombe region since it differentiates deviations from the frontier into two components of inefficiency. SFA is a parametric approach that focuses on TE since it entails the optimal allocation of scarce resources purchased within a defined budget. Stochastic production frontier is specified as:
is the vector of explanatory variables and control variables and
is the vector of parameters while
and
are the component error terms.
The
error term represents variations due to measurement errors and factors beyond the farmer’s control which follows normal distribution;
The
The stochastic frontier estimation estimates then another function that relates the inefficiency measured in the first stage with the explanatory variables corresponding to farm and farmer characteristics.
The inefficiency equation is written as:
Where is the vector of factors affecting technical inefficiency of the i-th observation and
represents parameters while
is the error term.
3.5. Description of inefficiency variable used in Stochastic Frontier model
Finally, after combining the two equations, TE can now be defined as the ratio between actual output and the possible maximum output.
Technical Efficiency (TE) estimation in this model is estimated using the translog production function (TLPF). TLPF is an attractive, flexible function because the model assumes the existence of a linear and nonlinear relationship between the outputs and the inputs, and that the production elasticities are not constant (Berndt & Christensen, Citation1973). The adopted TLPF model for estimation of technical efficiency is based on three main factors: labor, farm size and fertilizer (manure), and the annual value of crops produced by youth farmers as output, the model specified in Equationequation (5)(5)
(5) below:
Where represents the total value of crop produced (Tshs) of each youth, farm size
is the total area planted in acres, labour (EX) represents the total cost incurred in hiring labour (labour expenditures in Tshs) and fertilizers
represents the total costs used in manure fertilizers,
s is unknown parameters to be estimated while
is a random error which is associated with random factors outside the control of youth farmers, such as weather and disease) and
stands for random error for technical inefficiency component.
The inefficiency model (Equationequation 3(3)
(3) ) is estimated the following variables, which are: age of the youth, household size, poultry keeping, marital status, land ownership, access to extension services, access to credit, level of education and Njombe district council, Njombe town council, and Makambako town council ().
Table 1. Inefficiency variables measurement with their expected sign
The coefficients of the frontier model and the technical inefficiency model are estimated by the maximum likelihood estimation technique (MLE) in STATA 15 powered by the sfcross package that estimates the stochastic frontier models.
Returns to Scale (RTS) is also computed from the production function. The RTS is the sum of the output elasticities for various inputs, given as: RTS = Ʃ εqi
Decision rule: RTS > 1 implies increasing returns to scale
RTS < 1 implies decreasing returns to scale
RTS = 1 implies constant returns to scale
4. Results and discussion
4.1. Results of descriptive statistics
The average farm size was 1 acre per youth, the average value of crop output per youth was 1,684,059.4Tshs. The mean hired labor expense was Tshs.18,386. The mean organic fertilizer (manure) expense was Tshs.35, 663 as shown in Table . The average age of youth was 29 years, indicating that most were young adults. Some 59% of the youth were males meaning 41% were females. A total of 74.7% were married and 85.5% owned land, with only 14.5% not owning land. 58.5% of the youth had access to extension services and 55% had access to credit. About 1.2% of the youth had not attended any formal education, most (77%) had primary education, while 18.5% had secondary education, with only 3% tertiary education graduates. The majority of youth involved in crop production are from Njombe district council (64%), Njombe town council (26%), and Makambako council (18%; Table ).
Table 2. Summary of descriptive statistics of key variables used in the analysis
4.2. Model performance
The estimated TLPF was tested by looking at the hypotheses of the overall model, the frontier model and the TE model (Coelli et al., Citation2005). The overall model performance was satisfactory. The Wald chi-square of overall model significance had a critical value of 14.27% at a 1% significance level. Hence, the null hypothesis that the model is insignificant was rejected (Table ). The frontier model was significant at 5%. Hence, we rejected the null hypothesis that the frontier model was insignificant. The variance parameter of the frontier model shows that 62% of the variation of the value of output were caused by factors beyond the control of the farmers.
Table 3. Hypothesis testing of frontier and technical inefficiency models with variances
The technical inefficiency model () was found significant at a 1% significance level. Hence, the null hypothesis which states that no technical inefficiency effects (y = 0,) was rejected, and the factors used to determine the technical inefficiency successfully explain the technical inefficiency model. The results show that 78% of output variations were associated with the technical inefficiency of the youth farmers resulting from factors within their control. Moreover, the lambda coefficient is 1.52% (Table ). The value is different from 0 and statistically significant at a 1% level, assuming the stochastic nature of the production function. It implies that the study area’s output variation is attributed to statistical noise and technical inefficiency effects. These results are in parallel with studies conducted by (Hepelwa, Citation2013) in Tanzania, Hayatullah (Citation2017) in Afghanistan, and Tenaye (Citation2020) in Ethiopia.
Table 4. Maximum likelihood estimates of the Frontier model
4.3. Stochastic production frontier model estimation
The parameters of the truncated normal stochastic production frontier and inefficiency effects model are statistically significant (Table ). The results reveal that the estimated first-order coefficients of the three inputs, only farm size (lnFS) is positive and significant at 5%. This implies that a 5% increase in crop farm size leads to a corresponding 5.37% increase in crop value. This signifies the importance of land as the primary input of any agricultural production process. While expenditure on fertilizer (lnMA) is negative and significant at 10%. This implies that 10% increase in fertilizer use reduce value of crop output by 5.27%. Similarly, double increase expenditure in fertilizer (ln MA)2 is positive and significant at 5%. This implies that double expenditure in fertilizer lead to double value of crop output by 27%. However, the interaction between farm size and expenditure on labour (lnFSlnEX), and expenditure in farm size and fertilizer (lnFSlnMA) was negative and significant at a 10% level. This implies that a simultaneous increase in farm size and expenditure on labour, and increase in farm size and expenditure on fertilizer leads to a reduction in crop value output by 15% and 35%, respectively. This indicates that the increase in these inputs should not increase simultaneously. Instead, increase one factor when another factor is held constant. This finding is in line with Habiyaremye et al. (Citation2019) on efficiency and productivity on vegetable and poultry integration in Tanzania.
4.4. Factors influencing technical inefficiency
The efficiency model was estimated in a two-step process whereby the stochastic frontier production function was first evaluated to generate efficiency scores, and then the generated efficiency scores were regressed on farm-specific characteristics. The variance inflation factor (VIF) tested the estimated efficiency model for multicollinearity. The mean VIF of the predictors was 3.1, which is well within the acceptable range, suggesting no severe multicollinearity. The problem of multicollinearity is present if the value of VIF is greater than 10.
Table presents the factors affecting the technical inefficiency of youth crop farmers in the Njombe region. A negative coefficient means an increase in efficiency hence a positive effect on productivity. The signs and significance of the estimated coefficients in the inefficiency model have important implications on the technical efficiency of youth farmers.
Age is negative and significant at 10% confidence level. This implies that increase in age by 1 year reduces technical inefficiency by 60% under ceteris peribus. Age directly relates to experience, the higher the age, the more experience reduces inefficiency in crop production to certain level. This study considered youth age between 15 and 35 years. This age is productive age group as youth are energetic, risk takers and easy for them to adopt new technology compared to aged people. This finding is associated with the finding by Saiyut et al. (Citation2019) in Thailand who found that age structure between 15 and 59 years reduced technical inefficiency in Thai crop production.
Poultry keeping is negative and significant at 10% significant level. This implies that an increase in poultry keeping has a positive relationship with an increase in efficiency. This indicates that youth who kept poultry were more likely to have higher technical efficiency in crop production than youth who did not keep poultry. This can be attributed to more use of manure obtained from the poultry enterprise resulting into increased productivity and TE. This result is in line with the findings of Taye et al. (Citation2018) in Ethiopia. Land ownership is negative and significant at 5%. This implies that an increase in land occupancy decreases technical inefficiency. This means that youth owning land are aware of proper land management, reducing technical inefficiency and increasing productivity and efficiency. This result aligns with Koirala et al. (Citation2016) in the case of the Philippines, who found that being a landowner has a significant impact on technical efficiency compared to being a leaseholder. Similarly, Ahmed et al. (Citation2018) found that farmers who own land are more efficient in potato production.
Extension contact is negative and significant at 10%, implying that youth who have access to an extension agent reduce technical inefficiency by 3% than those with no access to extension officers. The main role of extension agents is to transfer knowledge and marketing information to the farmers to have the best farming practices and improve their efficiency. This result is in line with Rajendran (Citation2014) and Hayatullah (Citation2017), who found that extension services increase technical efficiency. However, this result contradicts Jote et al. (Citation2018), who found that extension services reduce efficiency. Njombe district council was positive and significant at 5%. This implies that youth crop farmers in this district were more technically inefficient. A possible reason for this may be limited access to extension officers who rarely visit youth farms to impart them with new technology and better agronomic practices, and poor rural roads to transfer their produce to the market. The coefficient for the household size, use of tractor, access to credit, Njombe Town Council, and Makambako Town Council were non-significant. This implies that the relationship between these variables and TE were non-significant.
4.5. The elasticity of production and return to scale
The production elasticities were estimated by using Equationequations 6(6)
(6) to 8. The results in (Table ) show that all inputs used in the production function are inelastic, implying that a 1% increase in each input leads to less than a 1% increase in the value of crop output. For all the three input variables considered in our model (farm size, expenditure on labour, and expenditure on organic fertilizer) farm size appeared to be the most important factor of production that has the highest effect on the value of crop output with an elasticity of production equal to 14.6%. This implies that a 1% increase in farm size increases crop output value by 14.6% ceteris paribus. Also, a percentage increase expenditure on labour increases the value of crop output by 43.6%. In contrast, expenditure in organic fertilizer has an absolute value of less than one (0.38). The elasticities less than unity were estimated to be positive decreasing functions, indicating that the allocation and utilization of the variables were in the stage of economic relevance of production function (stage II).
Table 5. Elasticity of output with respect to inputs
The RTS calculated was 0.275 (Table ). Based on these findings, we can conclude that a 1% increase in input raises output by less than a unit. This shows that the production in the study area was operating at a decreasing return to scale. Additional application of existing inputs would result in a lesser rise in output in relative terms. This suggests there is a need to introduce other inputs and those currently used to improve crop production. This result aligns with Ashfaq et al. (Citation2012), Hepelwa (Citation2013), Selejio et al. (Citation2018), Abate et al. (Citation2019), and Ngango and Kim (Citation2019), who found decreasing returns to scale of smallholder farmers. These elasticities suggest that a percentage change in farm size, cost of hired labour, and expenditure on fertilizers would have a considerable positive effect on the value of crop output.
4.6. Technical efficiency results
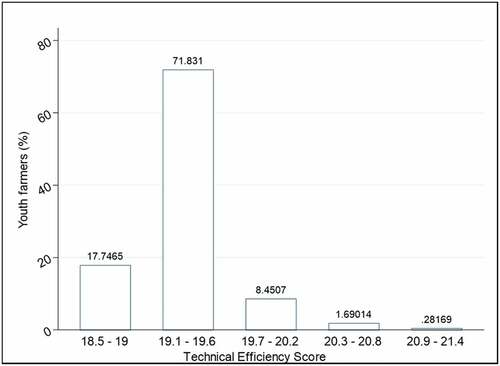
The study observed that the mean TE of the value of crops produced was very low (19.32%), implying that youth farmers still have room to improve their farming efficiency by 80.68% using the same amount of land resources. The results also show that most youth farmers had a technical efficiency score between 18.5 and 20.5 (Figure ). This finding is lower than the TE score estimated by empirical researchers in African countries (33%, 44%, 66.1%, and 44.33%) by Hepelwa (Citation2013), Joseph (Citation2014), and Jote et al. (Citation2018), and (Zewdie et al., Citation2021), respectively. The reason for very low TE in Njombe Region was contributed by inefficient use of land resources and farm inputs like fertilizer and the use of more hired labour than the requirements. Thus, improvement of inefficiency in utilization of land resources, farm inputs and proper use of hired labour might increase TE of youth crop producer in the study region.
Figure 1. Distribution of TE of youth crop farmers in Njombe.
4.7. Male and female youth relationship between income TE and farm size
The mean income for youth males and females was Tshs. 2,418,151 and Tshs. 616,000, respectively. There is a significant difference in income because males tend to earn around four times more than their female counterparts (Table ). This exhibits gender-based income inequality among youth crop farmers. On average, males had a farm size of 1.26 acres while females owned slightly smaller farms of 0.85 acres. This implies that most female youth are constrained by African culture, limiting them from owning major means of production such as land resources, access to credit and market information. This finding is in line with Ng’atigwa et al. (Citation2020), who found that female youth access to land is constrained with African culture. There was slight difference in TE between male (19.3) and female (19.2) youth in crop production (Table ). Furthermore, the t-test result leads to the rejection of the null hypotheses of no difference in TE between male and female youth in their crop production at a 1% significance level (Table ). This implies that the interventions towards improving technical efficiency in crop production among the youth should consider more female youth to improve their TE. Nevertheless, both male and female youth can increase their current level of technical efficiency without undertaking additional investment on the new agricultural technology, given that the technical efficiency of farmers is directly related to the overall productivity of the agriculture sector.
Table 6. Technical efficiency farm size and income differences between males and females
Table 7. Two-sample t-test with equal variance among male and female youth TE
4.8. Relationship between technical efficiency and district
Results in (Tables ) indicated that all districts had same level of technical efficiency. The t-test was taken to establish any significant difference in TE between the districts. The result from Table fails to reject the null hypothesis of no significant difference in TE between districts in crop production by youth crop farmers in the study region. This means that the interventions towards improving TE should be prioritised in all districts.
Table 8. Technical efficiency by district
Table 9. Two-sample t-test with equal variances for districts’ technical efficiency
5. Conclusion and policy implication
5.1. Conclusion
This study estimates the TE of youth crop farmers in Njombe Region and analyses the determinants of TE for crops produced. The maximum likelihood parameter estimates showed that farm size at 5% positively and significantly influenced crop output. The combination of farm size, expenditure on labour, and interaction between farm size and fertilizer were negative and significant at 10%. The study has shown that TE in the study area is very low. The estimated TE for youth crop farmers ranged from 18.5% to 20.5%, with mean TE of 19.32%. This showed that it is possible to raise TE among youth crop farmers with a given technology by 80.68%. This would enable youth farmers to obtain maximum output from their given inputs, and increase their farm incomes, so reducing rural poverty and unemployment. The production in the study area is operating at a decreasing return to scale (0.275). Hence, youth farmers were operating in a rational zone (stage II) of the production function.
Furthermore, TE between male and female youth is different. Male TE was higher than that for females in crop production and statistically significant at a 5%. TE between districts was the same. There was no significant difference in TE between districts. The estimated SPF model and inefficiency parameters showed that age, poultry keeping, extension contact, and land ownership reduced technical inefficiency at 10%, 10%, 10%, and 5%, respectively. However, the Njombe district council was a variable increasing technical inefficiency at a 5% significant level. Generally, the government should ensure that it undertakes programs to enable youth to improve their farming efficiency, operate closer to frontier output level with existing inputs, and introduce new inputs.
Youth crop farmers have remained technically inefficient despite continued government investment in the agriculture sector, such as providing extension services, promoting new technology, and marketing infrastructure.
5.2. Policy implication
The study recommends that in the future, the government should revive projects like NAIVS, which supports small-holder farmers to access important farm inputs like improved seed varieties and chemical fertilizer. Introducing this supporting project will boost production and productivity, increasing availability and accessibility to capture food and nutrition security. Capturing food and nutrition contributes to increased income and reduced youth unemployment and rural poverty. Also, primary school education should be strengthened to provide good agricultural management practices, including crop management, improved seed and fertilizer application, and improved management of a combination of production factors.
The study also recommends that the government and private sector collaborate to provide extension gear to extension agents to encourage regular visits and monitor the progress of the youth crop farmer to ensure the technology delivered to them is used effectively. Furthermore, youth empowerment should be promoted. This implies that promoting youth activities and enabling youth, especially females, to access important resources like land, farm inputs, credit, and market information could increase their level of productivity. In turn, increasing the production level would enhance their income as they could participate more in markets due to the surplus obtained from increased crop output and reduce rural poverty and unemployment problem.
5.3. Future research
Future research should consider analysing sources of inefficiency in the agriculture sector in Tanzania, an analysis of TE and welfare effects of horticulture production by youth farmers in the Njombe Region, Tanzania.
5.4. Limitation of the study
This study was done in one Region of Tanzania. Expansion of the study to other regions of Tanzania may provide comprehensive results. Also, this study did not look at sources of inefficiency among youth crop producers. This provides an area to be researched in the future.
Abbreviations
TE: Technical Efficiency; IRS: Increasing return to scale; RTS: Return to scale; SFA: Stochastic Frontier Approach; NAIVS: National Agricultural Input Voucher Scheme; URT: United Republic of Tanzania; HODECT: Horticultural Development Council of Tanzania; IFAD: International Fund for Agriculture Development; WFP: World Food Program; FAO: Food Agriculture Organization; PHC: Population and Housing Census; UDSM: University of Dar es Salaam; IITA: International Institute of Tropical Agriculture; NEPAD: New Partnership for African Development; EAC: East African Community; SADC: Southern African Development Community; USAID: United States Agency for International Development; IGC: International Growth Centre.
Authors’ contribution
All authors in this paper contributed to the data analysis and write-up of the manuscript. All authors read and approved the final manuscript.
Availability of data and materials
The data that support the findings of this study are available from the University of Dar es Salaam (UDSM), Department of Agricultural Economics and Business, and International Institute of Tropical Agriculture, Tanzania (IITA). However, restrictions apply to the availability of these data. Data are yet available from the authors upon reasonable request and permission from UDSM and IITA.
Acknowledgements
Our appreciation goes to Njombe Region, districts, village executive officers where the research took place, youth farmers for their passion throughout the interview process, enumerators who assisted with data collection. Mr Filbert Y. Kavia for providing logistical support during fieldwork. Moreover, we extend our gratitude to the University of Dar es Salaam, the International Institute of Tropical Agriculture, and the Ministry of Agriculture to support this study.
Disclosure statement
No potential conflict of interest was reported by the authors.
Additional information
Funding
Notes on contributors

Adella A. Ng’Atigwa
Adella A. Ng’Atigwa is a former PhD student at the Department of Agricultural Economics and Business at the University of Dar es Salaam Tanzania. She is working with the Ministry of Agriculture as Principal Agricultural Economist. Her research interest includes technical efficiency analysis, commercialization analysis, and youth involvement in horticulture agribusiness in Tanzania.
Aloyce Hepelwa
Aloyce Hepelwa is working with the University of Dar es Salaam as a Senior Lecturer and is EfD Research Fellow. He completed his PhD studies at Vrije Universiteit Brussel (VUB) and his research was on “Environmental Resources Sustainability Indicators: An Integrated Assessment Model for Tanzania”.
Victor Manyong
Victor Manyong is an Agricultural Economist at IITA. He oversees IITA’s contribution to the CGIAR Research Programs on Policies, Institutions and Markets (CRP2) and Agriculture for Improving Nutrition and Health (CRP4). Victor obtained his PhD in Agricultural Economics from the Catholic University of Louvain-la-Neuve (UCL) in Belgium.
Shiferaw Feleke
Shiferaw Feleke is an Agricultural Economist at IITA. He has a PhD in Agricultural Economics (2006) from the University of Florida, USA. He worked as Research Associate at the Dairy Systems Management, University of Florida (2006-2007). He was also a Research Assistant at the Food and Resource Economics Department, University of Florida (2000-2006).
References
- Abate, T. M., Dessie, A. B., & Mekie, T. M. (2019). Technical efficiency of smallholder farmers in red pepper production in North Gondar zone Amhara regional state, Ethiopia. Journal of Economic Structures, 8(1), 1–17.
- African Union Commision (AUC) (2006). African Youth Charter. https://au.int/en/treaties/african-youth-charter
- Ahmed, K. D., Burhan, O., Amanuel, A., Diriba, I., & Ahmed, A. (2018). Technical efficiency and profitability of potato production by smallholder farmers: The case of Dinsho District, Bale Zone of Ethiopia. Journal of Development and Agricultural Economics, 10(7), 225–235. https://doi.org/10.5897/jdae2017.0890
- Ahmed, B., Haji, J., & Geta, E. (2013). Analysis of farm households’ technical efficiency in production of smallholder farmers: The case of Girawa district, Ethiopia. American Journal of Agricultural & Environmental Sciences, 13(7), 1615–1621. https://doi.org/10.5829/idosi.aejaes.2013.13.12.12310
- Aigner, D., Lovell, C. A. K., & Schmidt, P. (1977). Formulation and estimation of stochastic frontier production function models. Journal of Econometrics, 6(1), 21–37. https://doi.org/10.1016/0304-4076(77)
- Asefa, S. (2011) Analysis of technical efficiency of crop producing smallholder farmers in Tigray,Ethiopia. MPRA Paper No. 40461.
- Ashfaq, M., Abid, M., Bakhsh, K., & Fatima, N. (2012). Analysis of resource use efficiencies and return to scale of medium-sized Bt cotton farmers in Punjab, Pakistan. Sarhad Journal of Agriculture, 28(3), 493–498.
- Battese, G. E., & Coelli, T. J. (1995). A model for technical inefficiency effects in a Stochastic Frontier production function for panel data. Empirical Economics, 20(2), 325–332. https://doi.org/10.1007/BF01205442
- Berndt, E. R., & Christensen, L. R. (1973). The translog function and the substitution of equipment, structures, and labor in U.S. manufacturing 1929-68. Journal of Econometrics, 1(1), 81–113. https://doi.org/10.1016/0304-4076(73)
- Charnes, A., Cooper, W. W., & Rhodes, E. (1978). Measuring the efficiency of decision making units. European Journal of Operational Research, 2(6), 429–444. https://doi.org/10.1016/0377-2217(78)
- Chongela, J. (2015). Contribution of agriculture sector to the Tanzanian economy. American Journal of Research Communication, 3(7), 57–70.
- Coelli, T. J., Prasada Rao, D. S., O’Donnell, C. J., & Battese, G. E. (2005). An introduction to efficiency and productivity analysis (2nd ed.). Springer Science & Business Media.
- Dessale, M. (2019). Analysis of technical efficiency of small holder wheat‑growing farmers of Jamma district, Ethiopia. Agriculture & Food Security, 8(1), 1–8. https://doi.org/10.1186/s40066-018-0250-9
- Ellis, F. (1988). Peasant Economics: Farm households and agrarian development. In Peasant economics: Farm households and agrarian development (2nd ed.). Cambridge Universiy Press. https://doi.org/10.2307/635095
- FAO, OECD (2014). Opportunities for economic growth and job creation in relation to food security and nutrition: Report to the G20 development working group FAO and the OECD with inputs from Asian Development Bank, IFAD, ILO, IFPRI and WTO.
- Habiyaremye, N., Tabe-Ojong, M. P., Ochieng, J., & Chagomoka, T. (2019). New insights on efficiency and productivity analysis: Evidence from vegetable-poultry integration in rural Tanzania. Scientific African, 6, e00190. https://doi.org/10.1016/j.sciaf.2019.e00190
- Hayatullah, A. (2017) Crop diversification and technical efficiency in Afghanistan: Stochastic frontier analysis. CREDIT Research Paper, No. 17/04. Nottingham
- Hepelwa, S. A. (2013). Technical efficiency as a sustainability indicator in continuum of integrated natural resources management. Resources and Environment, 3(6), 194–203. https://doi.org/10.5923/j.re.20130306.04
- Horticultural Development Council of Tanzania (HODECT). (2010). Tanzania horticultural development strategy 2012-2021. Government Printer: Dar es Salaam.
- IFAD, WFP, FAO. (2013). The state of food insecurity in the world: The multiple dimensions of food security.
- Joseph, A. I. (2014). Analysis of the determinants of technical efficiency among some selected small scale farmers in Kogi State. International Journal of African Asian Stud an Open Access International Journal, 5, 24–30.
- Jote, A., Feleke, S., Tufa, A., Manyong, V., & Lemma, T. (2018). Assessing the efficiency of sweet potato producers in the southern region of Ethiopia. Experimental Agriculture, 54(4), 491–506. https://doi.org/10.1017/S0014479717000199
- Kehinde, A. L., Awoyemi, T. T., Omonona, B. T., & Akande, J. A. (2010). Technical efficiency of sawnwood production in Ondo and Osun states, Nigeria. Journal of Economics, 16(1), 11–18. https://doi.org/10.1016/j.jfe.2009.04.001
- Kibirige, D., Raufu, M., & Masuku, M. (2014). Efficiency analysis of the Sub-Saharan African small-scale agriculture: A review of literature on technical efficiency of maize production. IOSR Journal of Agriculture and Veterinary Science, 7(12), 124–131. https://doi.org/10.9790/2380-07122124131
- Kidane, A., Hepelwa, A., Tingum, E., & Hu, T. (2013). Agricultural inputs and efficiency in Tanzania small scale agriculture: A comparative analysis of tobacco and selected food crops. Tanzanian Economic Review, 3(1-2), 1–13.
- Koirala, K. H., Mishra, A., & Mohanty, S. (2016). Impact of land ownership on productivity and efficiency of rice farmers: The case of the Philippines. Land Use Policy, 50, 371–378. https://doi.org/10.1016/j.landusepol.2015.10.001
- Mbehoma, P., & Mutasa, F. (2013). Determinants of technical efficiency of smallholders dairy farmers in Njombe District, Tanzania. African Journal of Economic Research, 1(2), 15–29.
- Meeusen, W., & van den Broeck, J. (1977a). Efficiency estimation from cobb- production functions with composed error. International Economic Review, 18(2), 435–444. https://doi.org/10.2307/2525757
- Meeusen, W., & van den Broeck, J. (1977b). Efficiency estimation from Cobb-Douglas production function with composed error. International economic review.
- Miho, A. (2017). Comparing technical efficiency of maize smallholder farmers in Tabora and Ruvuma regions of Tanzania: A frontier production approach. Asian Journal of Agriculture and Rural Development, 7(9), 180–197. https://doi.org/10.18488/journal.1005/2017.7.9/1005.9.180.197
- Msuya, E., Hisano, S., & Nariu, T. (2008). Explaining productivity variation among smallholder maize farmers in Tanzania. International Rural Sociol Associaton, 33. https://doi.org/10.1080/09718923.2007.11892573
- New Partnership for African Development (NEPAD). (2013). African Agriculture, Transformation and outlook. Johannesburg.
- Ng’atigwa, A. A., Hepelwa, A., Yami, M., & Manyong, V. (2020). Assessment of factors influencing youth involvement in horticulture agribusiness in Tanzania: A case study of njombe region. Agriculture, 10(7), 287. https://doi.org/10.3390/agriculture10070287
- Ngango, J., & Kim, S. G. (2019). Assessment of technical efficiency and its potential determinants among small-scale coffee farmers in Rwanda. Agriculture, 9(7), 1–12. https://doi.org/10.3390/agriculture9070161
- Ochieng, N., & Hepelwa, A. (2018). Effects of small-scale agricultural crop commercialisation on rural household welfare in Tanzania: A case study of Liwale District, Lindi region. International Journal of Agricultural Economics, 3(5), 103–111. https://doi.org/10.11648/j.ijae.20180305.12
- Population and Housing Census (PHC) (2012). Population and housing census: Population distribution by administrative areas. https://www.nbs.go.tz/index.php/en/census-surveys/population-and-housing-census/162-2012-phc-population-distribution-by-administrative-areas. Accessed 28 Apr 2020
- Rajendran, S. (2014). Technical efficiency of fruit and vegetable producers in Tamil Nadu, India: A stochastic frontier approach. Asian Journal of Agricultural Sciences, 11(1362-2016-107725), 17.
- Saiyut, P., Bunyasiri, I., & Sirisupluxana, P. (2019). Kasetsart journal of social sciences The impact of age structure on technical ef fi ciency in Thai agriculture. Journal of social sciences, 40(3), 539–545.
- Schultz, T. W. (1964). Transforming Traditional Agriculture. American Journal of Agricultural Economics, 70(1), 198–200. https://doi.org/10.2307/1241992
- Selejio, O., Lokina, R. B., & Mduma, J. K. (2018). Smallholder agricultural production efficiency of adopters and nonadopters of land conservation technologies in Tanzania. The Journal of Environment & Development, 27(3), 323–349. https://doi.org/10.1177/1070496518770235
- Sharma, K. R., Leung, P., & Zaleski, H. M. (1999). Technical, allocative and economic efficiencies in swine production in Hawaii: A comparison of parametric and non-parametric approaches. Agricultural Economics, 20(1), 23–35. https://doi.org/10.1111/j.1574-0862.1999.tb00548.x
- StataCorp (2015) Stata statistical software release 14. In: StataCorp LP. https://www.scirp.org/(S(i43dyn45teexjx455qlt3d2q))/reference/ReferencesPapers.aspx?ReferenceID=1858523. Accessed 3 Jul 2021
- Taye, M., Abebe, B. D., & Tadie, M. A. (2018). Determinants of commercialization by smallholder onion farmers in Fogera district, South Gondar Zone, Amhara national regional State, Ethiopia. Journal of Development and Agricultural Economics, 10(10), 339–351. https://doi.org/10.5897/jdae2018.0964
- Tenaye, A. (2020). Technical efficiency of smallholder agriculture in developing countries: The case of Ethiopia. Economies, 8(2), 1–27. https://doi.org/10.3390/ECONOMIES8020034
- United Republic of Tanzania (URT). (2017). Agricultural sector development programme Phase II (ASDP II): AgriculturalSector for industrial development. Government Printer.
- United Republic of Tanzania (URT) (2019). Budget speech, Ministry of Agriculture. Government Printer, Dar es Salaam. https://www.kilimo.go.tz/index.php/en/resources/view/hotuba-ya-waziri-wa-kilimo-mheshimiwa-japhet-ngailonga-hasunga-mb-kuhusu-ma. Accessed 27 Apr 2020
- Wang, H. J., & Ho, C. W. (2010). Estimating fixed-effect panel stochastic frontier models by model transformation. Journal of Econometrics, 157(2), 286–296. https://doi.org/10.1016/j.jeconom.2009.12.006
- Yadava, A. K. (2021). Benchmarking the performance of organic farming in India. Acad Pap, 21(2), e2208. https://doi.org/10.1002/pa.2208
- Yami, M., Feleke, S., Abdoulaye, T., Alene, A. D., Bamba, Z., & Manyong, V. (2019). African rural youth engagement in agribusiness: Achievements, limitations, and lessons. Sustain, 11(1), 1–15. https://doi.org/10.3390/su11010185
- Zewdie, M., Moretti, M., Tenessa, D., Ayele, Z. A., Nyssen, J., Tsegaye, E., Minale, A. S., & Passel, S. V. (2021). Agricultural technical efficiency of smallholder farmers in Ethiopia: A stochastic frontier approach. Land, 10(3), 246. https://doi.org/10.3390/land10030246