
 ?Mathematical formulae have been encoded as MathML and are displayed in this HTML version using MathJax in order to improve their display. Uncheck the box to turn MathJax off. This feature requires Javascript. Click on a formula to zoom.
Abstract
The study examines the dynamics between oil price, exchange rate, and stock market performance in South Africa using DCC-GARCH, time-varying VAR, and multivariate Markov regime switching models. Monthly data on oil price, exchange rate, and market capitalization as a measure of stock performance from 2003(01) to 2019(7) were employed. The results of DCC-GARCH model show that dynamic conditional correlation among the variable was stable with few exceptionalities. The empirical findings from time-varying VAR show existence of feedbacks from stock market to oil price. Markov regime switching VAR model results show that exchange rate and market capitalization have significant effects on oil price in booming period. The study concludes that stock market performance provides an important policy help in stemming the erratic fluctuations in oil price. Appropriate knowledge of the linkage between oil price, exchange rate and stock market performance in South African economy is important because of her heavy reliance on oil importation. The upward change in oil price has so many overlapping effects on many sectors of the economy in form of increase in cost of goods and services (inflation) and lower standard of living among others. Hike in oil price is believed to also worsen the external value of Rands. This could send some dangerous signals to foreign investors in the stock market, which may undermine the performance of the stock market. Empirical knowledge of this dynamic could assist the policy makers to come up with mitigating policies to reduce the effects of oil price volatility on other economic fundamentals.
Keywords:
1. Introduction
Assessing the dynamic relationship between oil price and macroeconomic aggregates such as exchange rate, inflation, and gross domestic product (GDP) among others has attracted considerable attention in the literature. Existing studies have largely examined the nexus between oil prices and macroeconomic variables (e.g., Aloui et al., Citation2013; Arora & Tanner, Citation2013; Berument et al., Citation2014; Buetzer et al., Citation2016; Chen & Chen, Citation2007; Li et al., Citation2012; Reboredo, Citation2012; M. I. Turhan et al., Citation2014), and the evidence is well documented. Similarly, stock market of a country is an important fragment of economic activity because it is regarded as a reflection of social mood of a country as well as a pointer to her economic strength and development (Hamilton, Citation1983, Citation1996, Citation2008; Kilian, Citation2009; Mork et al., Citation1994). Oil price changes affect performance of stock in many ways. Cash flows and discount rates are important factors affecting stock performance according to stock pricing model. Meanwhile, crude oil is an essential element in production process, and oil price changes affect stock prices through higher manufacturing costs and the expected cash flows of companies. Production costs are raised by higher oil prices, which in turn leads to lower cash flow. Also, the discount rate plays an important role in stock prices determination and is influenced by oil price fluctuation via exchange rate. Oil price changes is expected to significantly affect stock prices of oil importing countries like South Africa through exchange rate. As a result, subsequent empirical efforts have also focused on the relationship between oil price and stock market but with divergent and varying conclusions (Hamdi et al., Citation2019; Wang et al., Citation2020). Narayan and Gupta (Citation2015), Bjørnland (Citation2009), Gogineni (Citation2008), Narayan et al. (Citation2008), Sadorsky (Citation1999), and Cunado and de Gracia (Citation2014) among others found positive relationship between oil price and stock price performance, while El-Sharif et al. (Citation2005), Arouri and Rault (Citation2012), O’Neill et al. (Citation2008), Papapetrou (Citation2001), and Sadorsky (Citation1999) observed a negative relationship between oil price and stock performance.
On the other hand, some studies noted that there is no relationship between oil price and stock price (Apergis & Miller, Citation2009; Sukcharoen et al., Citation2014). Empirical studies on this subject matter remain inconclusive, while the evidence from South African economy is still very lean. Most of the available studies in South African economy, such as Kin and Courage (Citation2014), have mainly focused on oil price and exchange rate dynamics without recourse to stock market dynamics. The major assumption of standard time series analysis is that parameters of the data generating model are constant across the time. Most of the empirical studies have followed suits by assuming parameters constant. While constant parameters are often assumed, parameters changing are however often observed in real life. Hence, this study would be adopting time-varying analysis between oil price, exchange rate, and stock market dynamics. Based on the findings of the Shahrestani and Rafei (Citation2020) that the impact of oil price on stock market is regime dependent, this study also adopts multivariate Markov switching model to examine the impact of oil price and exchange rate on stock market performance. Empirical studies on this subject matter have largely focused on the feedbacks from oil price to stock market with little attention on the feedback effects from stock market to oil price. The present study considers the possibility of feedback effects from stock market to oil price in South African economy since South Africa is a widely opened economy with myriads of investors being foreign investors. As such, whatever happens in the stock market would expectedly affect exchange rate and perhaps the oil price since the economy is majorly an oil importing economy.
South Africa is the most developed economy in sub-Saharan Africa and unarguably the second largest economy in Africa, but unfortunately nearly half of the population could be said to be poor. Oil is fundamental to South Africa’s economy because the economy heavily depends on imports for more than two-thirds of her petroleum fuel needs. An increase in the oil price has myriads of negative effects on transport, industry, and agriculture because they are oil driven. The impact of oil price increase portends great danger for the agricultural and industrial sectors in form of increase in cost of goods and services (inflation) and loss of jobs. Also, the impacts of oil price increase further worsen the performance of Rands as it increases the demand for foreign currency relative to Rand. The negative effects are aggravated by the increase in domestic cost of production of goods and services, which might lead to more importation and hence further weaken the Rand.
The remainder of the study is structured as follow: section 2 synthesizes the existing literature. Empirical approach is outlined in section 3. Section 4 presents the empirical findings. The last chapter concludes the study.
2. Empirical review
The nexus between oil price and various macroeconomic variables have been extensively explored by a handful of empirical studies, such as Hamilton (Citation1983), Gisser and Goodwin (Citation1986), Mork (Citation1989), Davis and Haltiwanger (Citation2001), and Hooker (Citation2002) among others. For instance, the nexus between oil price and inflation has received substantial research efforts (Chen, Citation2009; De Gregorio, Citation2012; De Gregorio et al., Citation2007; Hooker, Citation2002; Van den Noord & André, Citation2007). Of significance to the current discussion is the nexus between oil price, exchange rate, and stock market performance. Habib and Kalamova (Citation2007) studied the relationship between oil price and exchange rate in Russia, Norway, and Saudi Arabia. They concluded no significant impacts of oil price on exchange rates in Norway and Saudi Arabia, while significant positive impact was found in Russia. El Abed et al. (Citation2016) investigated the effects of exchange rate on oil price fluctuations in MENA countries. Their findings showed that shocks to oil prices produced a significant effect on exchange rate in short run, while the effect was found to be insignificant in the long run. Similarly, Turhan et al. (Citation2013) considered the influences of oil prices on the exchange rates of some selected evolving economies (namely Brazil, Argentina, Colombia, Mexico, Indonesia, Peru, Nigeria, Poland, Russia, Philippines, South Africa, South Korea, and Turkey). Their findings showed that, with the exception of Argentina and Nigeria, shocks to oil price provoked reduction in value of the exchange rates. This position was corroborated by some other empirical studies on oil price and exchange rate nexus (Ahmed et al., Citation2016; Buetzer et al., Citation2016 among others; Jiranyakul, Citation2015; Ogundipe et al., Citation2014; Rickne, Citation2009). These studies failed to however explore the possibility of feedback effect from exchange rate to oil price apart from ignoring the role of time variation in their analysis. The present empirical efforts contribute to few empirical studies on time-varying relationships between oil price and exchange rate nexus and also considered the possibility of feedbacks from exchange rate and to oil price.
The studies on the dynamics between oil price and stock market performance has not received desired empirical attentions and without any consensus as to the impacts of oil price on stock market performance. Findings from the empirical efforts are entirely inconclusive and largely unsettled, and as such, evidence from empirical findings can be classified on three different strands. Evidence of a negative effect of oil price on stock market performance was documented by (Awerbuch & Sauter, Citation2006; Basher & Sadorsky, Citation2006; Hammoudeh & Choi, Citation2006; Jones & Kaul, Citation1996; Kilian & Park, Citation2009; Miller & Ratti, Citation2009, among others; Nandha & Faff, Citation2008; Papapetrou, Citation2001; Sadorsky, Citation1999). A more recent empirical findings by Köse and Ünal (Citation2020) on the subject matter also argue that oil price has significant negative effects on stock returns in Iran, Kazakhstan, and Russia. This position is also recently corroborated by Singhal et al. (Citation2019). They explored the dynamic relationship between oil prices, international gold prices, exchange rate, and stock market performance in Mexico. They found that oil price negatively affects stock market performance, while exchange rate was also found to be negatively affected.
On the other hand, some studies (e.g Arouri & Rault, Citation2012, Citation2012 among others; El-Sharif et al., Citation2005; Narayan et al., Citation2008; Zhang & Chen, Citation2011) also argued that oil price has significant positive effects on stock market performance. Bernanke (Citation2016) contends that fundamental demand factor is responsible for most of the significant positive impacts of oil price on stock market. Reboredo and Rivera-Castro (Citation2014) examined the interdependence between oil price shocks and the stock returns in the post global financial crisis with a focus on the aggregate and sectoral level. They found positive relationship between oil price shocks and the stock market performance. Similarly, Ferreira et al. (Citation2019) queried the relationship between oil prices and stock markets of some selected countries. The empirical evidence showed that there is low but positive correlation between oil price and stock markets performance. They also provided evidence of oil prices having a positive effect on the stock market. Mixed evidence was provided by another recent study by Thorbecke (Citation2019). He argued that oil price has positive impacts on stocks market performance in some East and Southeast Asian countries, while negative impacts were also found in some other East and Southeast Asian countries. The last group of findings conclude that oil prices has no effects oil stock market performance (e.g., Blanchard & Gali, Citation2007; Lescaroux & Mignon, Citation2008; Henriques & Sadorsky, Citation2008; Miller & Ratti, Citation2009; Apergis & Miller, Citation2009; Sukcharoen et al., Citation2014).
One of the most recent arguments in the literature is that the relationship between oil price and stock return is time varying (Reboredo & Rivera-Castro, Citation2014; Nasir et al., Citation2018). This study therefore employed time-varying approach to query the relationship between oil price and stock market performance as few studies have followed the time-varying approach on oil price and stock returns nexus. This study specifically uses time-varying VAR to explore the possibility of feedbacks from stock market to oil price, which hitherto has not been given a consideration in the literature. Also, the present study contributes to the submission of Shahrestani and Rafei (Citation2020) that the impact of oil price on stock market is regime dependent. This study hence employed multivariate Markov switching model to examine the dynamics between oil price, exchange rate, and stock market performance.
3. Data and methodology
3.1. Data description and summary
Time series data were collected from the South African Reserve Bank (SARB). Monthly data on oil price, exchange rate, and market capitalization as a measure of stock performance from 2003(01) to 2019(7) were employed. The study aims at examining the time-varying correlation among the variables using dynamic conditional correlation (DCC-GARCH model), time-varying responses using time-varying VAR, and the impacts of oil price and exchange rate on stock market performance using multivariate Markov switching model.
The movements of all the variables are depicted in Figure . The variables depict both increasing and decreasing trend over the period of the study. Oil price displayed high fluctuating trend with spikes around 2007 and 2008. The value of South African Rand fell largely during the period under consideration relative to US Dollar as the exchange rate increased on the average over study period. Also, the market capitalization also increased during the study period with lowest fall around 2007 and 2008 due to global economic crisis of that era.
Figure 1. Trend of the variables.
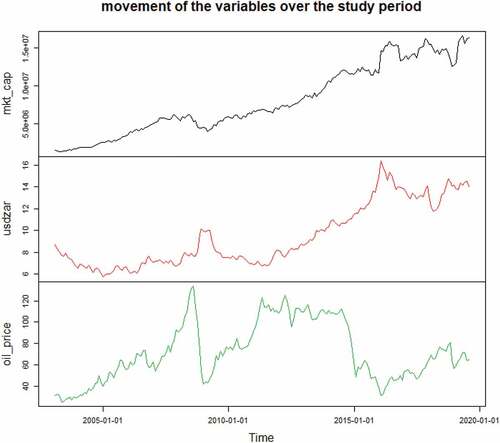
Table presents the summary statistics for the log-returns (dl) of the variables under considerations. The means for all the returns are closed to zero. Oil price displays the highest volatility as suggested by standard deviation. The most important deductions from the descriptive statistic is that the null hypothesis of normality assumptions is rejected as shown by the significance of Jacque Berra statistic. This underscores the need to use a GARCH-like model such as DCC. The non-normality of the variables is further affirmed by histogram plots of the monthly returns, as displayed in Figure .
Figure 2. Histogram plots of the variables.
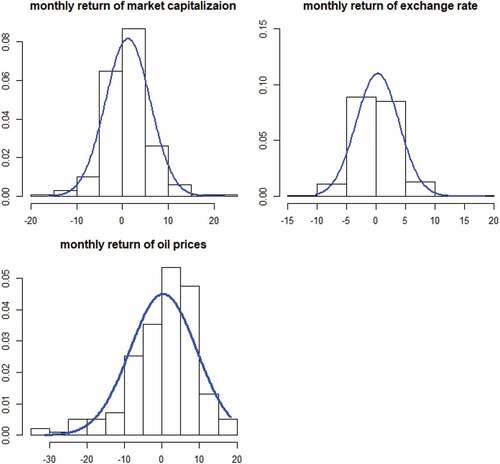
Table 1. Descriptive statistics of the variables
Table and present the pair wise correlation coefficients, which is static correlation coefficient. Expectedly, the correlation coefficients between the variables is low. These correlation coefficients are however static as they do not show the correlation changes, which occur over time. It only presents the contemporaneous or instant relationship over a period. The present study utilizes Dynamic Conditional Correlation (DCC-GARCH) to investigate time-varying correlation among the variables.
Figure 3. Static correlation chart of the variables.
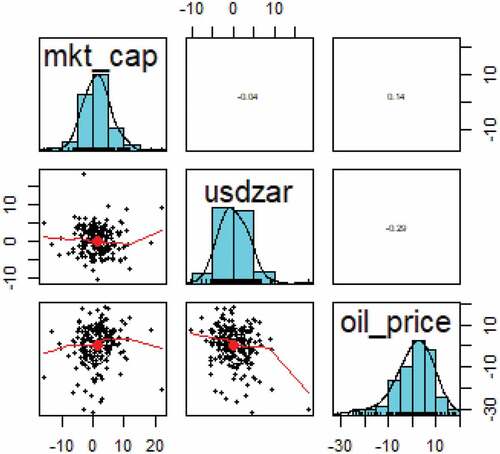
Table 2. Correlation matrix
3.2. GARCH-DCC model, TVP-VAR model, and multivariate Markov switching model
3.2.1. GARCH-DCC model
The specified GARCH(p,q) model is employed using model is estimated using Maximum Likelihood Estimation (MLE) techniques. It is represented by the subsequent equations where is a residual from fitted VAR equation.
=
=
is already standardized disturbance term as a result of mean removal from the VAR residual series. The log of volatility of
is given as a function of its own lagged values and lagged standardized disturbance terms.
s are the persistence of volatility and
s represent the GARCH effects. We re-standardized the standardized residual from the VAR equations.
The following variant of DCC is used for estimation in R statistical package:
where is the Dynamic Conditional Correlation, and
is the standardized residuals from GARCH’s.
,
are the persistence of correlation,
is the initial correlation matrix at
i.e
.
The DCC-GARCH model is employed to examine the time-varying correlations among the three variables under considerations. The obtained correlations would shed light on the time -varying contemporaneous relationships among the variables.
3.2.2. TVP-VAR model
Primiceri (Citation2005) came up with multivariate time series model, which permits time variation in the coefficients and in the variance covariance matrix. The TVP-VAR model can be stated as follow:
where is a column matrix of the observed variables, while
are square matrix of time-varying coefficients;
is independently and identically distributed with
;
is the lower triangular matrix
And is the diagonal matrix
The model can be restated as
where the parameters , and
are all time-varying,
is assumed to be a stacked vector of the lower triangular elements in
, and
with
for j =1, … … .,k and t = s + 1, … … ., n. The parameters follow a random walk process and they are specified as follow:
3.2.3. Multivariate Markov regime switching model
The present study follows Hamilton (Citation1989). The probabilities of switching from one regime to another one is computed in a Markov switching model (Tong, Citation1983; Hamilton, Citation1989).
The model is given as
where assumes values in
and is a first-order Markov chain with transition probabilities. The state transition model is determined by the transition probabilities where,
where In matrix notation, the transition probability matrix is given as:
It is also of economic importance to calculate the steady state probabilities, which is the unconditional probabilities that the system is in regime one () and the system is regime two (
and are stated as follows:
4. Empirical results
4.1. DCC-GARCH results
All the variables are expressed in logarithmic form. Augmented Dickey Fuller and PP test were conducted to examine the stationary property of the series. Levels of the series showed presence of a unit root, while first differencing them showed the absence of a unit root and therefore stationary. Differenced variables are represented by adding “dl” to the level variable name. These differenced variables are then fitted to a DCC-GARCH model. DCC with multivariate Skew Student-t Distribution (sstd) and DCC with multivariate Student-t Distribution (std) were modeled. DCC with multivariate Student-t Distribution however yielded a lower Akaike Information Criteria and was fitted for the study.
The time-varying correlations among the variables are plotted in Figure . As displayed in Figure , the dynamic correlations among the variables are relatively stable.
Figure 4. Time-varying correlation among the variables.
The dynamic conditional correlations between market capitalization and oil price are entirely in positive region with highest coefficient value of 0.34 around 2004 and lowest correlation around 2016. Overall, the dynamic conditional correlation between the oil price and market capitalization during the study period is positive. This indicates both oil price and market capitalization move in the same direction, though the relationship during the entire period is weak as the highest correlation value was less than 0.5.
The dynamic correlation coefficients between market capitalization and exchange rate of US Dollar to South African Rand oscillate between the negative zone and positive zone with more coefficients taking negative values than positive value. The negative coefficients show the period the movement between market capitalization and the exchange rate move in opposite direction, though the strength of the relationship is also observed to be weak. Theoretically, increase in the exchange rate of US Dollar to South African Rand would have a downward effect on the performance of stock market. This perhaps explain why most of the coefficients are negative during the study period. The positive coefficients are however observed during some periods with highest positive value being 0.15. The positive coefficients could be associated to other underlying happenings in the economy. The dynamic conditional correlation coefficients between oil price and the exchange rate of US Dollar to South African Rand also oscillate between the positive and negative zones. Since South Africa is majorly an oil importer, one would expect that correlation coefficient values during the period to be completely positive as higher prices of oil motivate upward pressure on the Rand exchange rate. However, existing reality from empirical findings show that time-varying correlation between the two variables oscillate between the positive zone and negative zone. It is however worthy to be mentioned that correlation is not the same as causation as it only shows the strength of the relationship. The empirical analysis suggests that time-varying correlation among the variables under consideration over the entire study period is not really strong in South African economy.
4.2. TVP-VAR model results
The DCC-GARCH model is employed to explore the time-varying contemporaneous correlation among the variables. Nevertheless, this does not provide information on time-varying dynamic responses among the variables. This study therefore employed TVP-VAR model to investigate the dynamic relationship among the variables. The optimum lag order of 2 was selected based on the AIC rule. The impulse response graphs from the time-varying parameter VAR estimation approach are presented in Figures .
Figure 5. Impulse response to market capitalization shock.

Figure 6. Impulse response to Rand exchange rate shock.
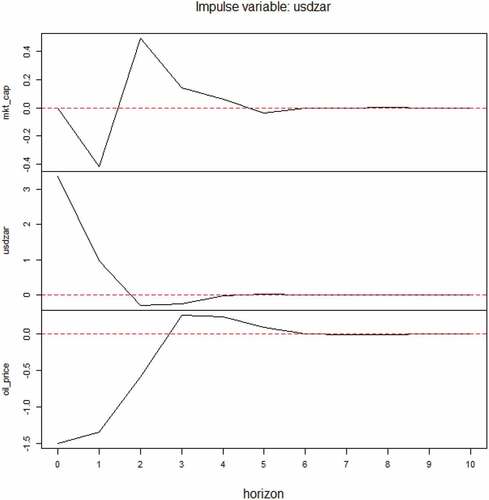
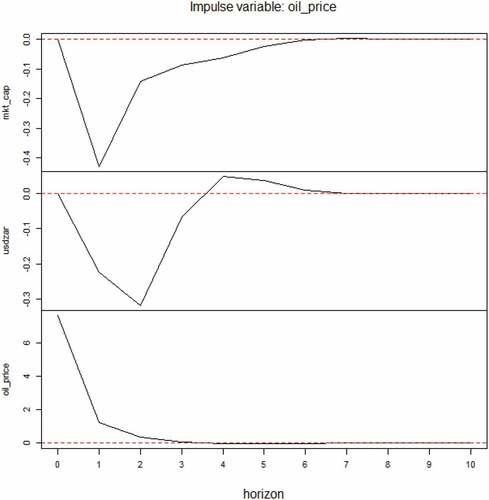
Figure 7. Impulse response to oil price shock.
The impulse response graph in Figure shows the time-varying responses of the variables to shock to market capitalization. The results show that market capitalization fell sharply in response to its own shock, while it slightly rose again as the effects begin to dissipate and subsequently fade away. Rand exchange rate fell sharply due to positive shocks to market capitalization. This means that positive shocks to market capitalization makes the South African Rand to appreciate possibly because of the increased demand for Rand due the higher demand for her stocks in foreign market. The exchange rate much later begin to rise till effects of the shocks completely fade away. Also, a shock to market capitalization lead to an initial but short rise in oil price and the oil price subsequently rose until the shock effects completely dissipate.
Figure shows the responses of the variables to exchange rate shocks. Rand exchange rate sharply fell, which signifies appreciation of the Rand relative to US Dollar in response to its own shock. It rose slightly much later and the effects subsequently faded away. The graph shows that positive shocks to exchange rate leads to immediate fall in market capitalization though the downward response was not much as it began to rise after a while and the rise spike up. The shock effects later begin to fall, until it finally fades away. The initial fall in market capitalization due to increase in exchange rate is not unexpected because of the effects of the appreciation of Rand in response to its own shocks. The appreciation means that more dollars would be needed by the foreign investors to trade in South African stock market, and this would contribute to fall in her stock demand by foreign investors and hence initial fall in market capitalization. Also, the shock to Rand exchange rate lead to increase in oil price. This is likewise not unexpected since import would become more expensive because the exchange rate shock lead to appreciation of Rand. This would make the oil price to rise since South Africa is fundamentally an oil importer.
Figure shows the response of the variables to oil price shock. Oil price sharply decline in response to its own shock. The fall in the oil price in response to its own shock persisted till the effects completely faded away. The Rand exchange rate fell (Rand appreciation) initially in response to the shock before it significantly rose again. The initial increase could be associated to increased value of Rand as fewer amounts of dollar would be demanded to import the same quantity of oil and hence increase in value of Rand. Consequent upon the initial appreciation of Rand due to oil price shock, fewer units of South African stocks would be demanded as more Rands would be needed to buy the same unit of stocks and hence fall in market capitalization. This explains why market capitalization immediate falls in response to oil price shocks, but subsequently rose as Rand exchange rate increases (depreciation of Rand) until the oil price shocks completely fade away.
4.3. Markov regime switching model results
Multivariate Markov switching regime analysis was done to reassess the position of Shahrestani and Rafei (Citation2020) that the effect of oil price on stock market performance is regime dependent. The result is contained in Table . From Table , our findings show that only exchange rate has significant effect on stock market performance in regime 1, which is the low regime. Both oil price and exchange rate have no significant effect on stock market performance in regime 2. Interestingly, stock market performance and exchange rate have significant effects on oil price in regime 2. The effects of stock market performance on oil price is negative, while the effect of exchange rate is found to be positive. This shows that during the period of booming economic activities, an improvement in stock market performance will increase the participation of foreign investors in South African stock market and hence increased demand for South African Rand. The increase in the demand for South African will lead to appreciation of Rand, which in turns would lower the oil prices as fewer amounts of Rand would be needed to buy the same unit of US Dollar. Also, oil price is found to have significant positive effect on exchange rate in booming period. This is not unexpected, if there is an increase in oil price perhaps due to exogeneous factors, more US Dollars would be demanded to import the same quantity of oil, and this would lead to increase in exchange rate, which is depreciation of Rand. Coming to the recent argument of Shahrestani and Rafei (Citation2020) that the impact of oil price on stock market performance is regime dependent in Tehran economy, the current empirical evidence from South African economy does not substantiate this submission. The impact of stock market performance on oil price is however found to be regime dependent. The transition probabilities that reveal the persistence of the impacts on each of the variable are also outlined in Table . The table shows that the probability that the impacts of exchange rate and oil price on stock market performance would persist in the low regime is 0.4119, while the probability of the impacts being persistence in high regime is very low and approaches zero. This by implication shows that exchange rate is an important factor affecting stock market performance during the period of low economic activities. This provides an important policy guide for government to moderate the fluctuation in exchange rate or increase in exchange rate (depreciation of Rand) during the period of low economic activities as it would have a negative impact on stock market performance. The empirical results further show that stock market performance and exchange rate have persistent impact on oil price in regime 2. The probability that impacts of exchange rate and stock market performance would have persistent effects on oil price during the booming period is almost 1. This implies that during the period of booming economic activities, exchange rate and stock market performance are important variables to influence the oil price in the economy. The impacts of oil price and stock market performance are more persistent when the economy is at low ebb, though the impact is not significant. However, during the booming period, government cannot close her eyes to oil price behavior as it is found to have significant impact on exchange rate despite the fact that the probability the economy will remain regime 2 is not high. These empirical findings are also corroborated by smoothed probabilities, presented in Figures . Smoothed probabilities present the probability of being in regime j at each period that is computed according to the available information of all the samples.
Figure 8. Smoothened probabilities for parameter impacts on stock market performance.
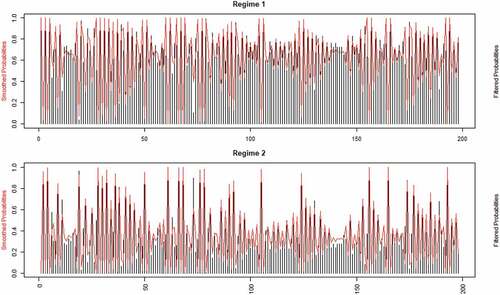
Figure 9. Smoothened probabilities for parameter impacts on oil price.
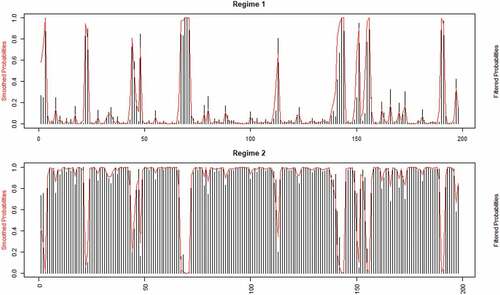
Figure 10. Smoothened probabilities for parameter impacts on exchange rate.
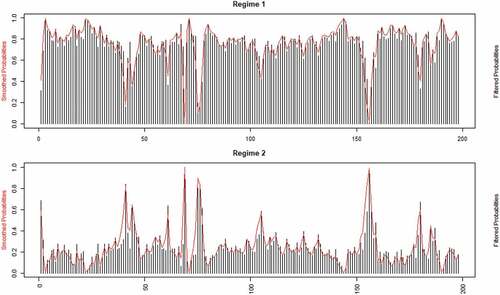
Table 3. Multivariate Markov regime switching results
5. Concluding remarks
The study examines the dynamics between oil price, exchange rate, and stock market performance in South Africa using time-varying approach and Markov regime switching VAR models. Time series data were sourced from the SARB. Monthly data on oil price, exchange rate, and market capitalization as a measure of stock performance from 2003(01) to 2019(7) were employed. The results of the static correlations show that the correlation among the variables is weak. The results of DCC-GARCH model show that dynamic conditional correlation between the oil price and market capitalization during the study period is positive. While the dynamic correlation coefficients between market capitalization and exchange rate of US Dollar to South African Rand oscillates between the negative zone and positive zone. Also, the dynamic conditional correlation coefficients between oil price and the exchange rate of US Dollar to South African Rand oscillate between the positive and negative zones. The empirical findings from time-varying VAR shows that Rand exchange rate fell sharply due to positive shocks to market capitalization and shock to market capitalization also produced responses from oil price, suggesting the existence of feedbacks from stock market to oil price. The Rand exchange rate fell (Rand appreciation) initially in response to the oil price shock before it significantly rose again and consequently initial fall in market capitalization. Markov regime switching VAR model results showed that oil price has no significant effects on stock market performance in both regimes, while exchange rate is found to exert significant impacts on stock market performance during the period of low economic activities. The results interestingly show that both exchange rate and market capitalization have significant effects on oil price in booming period. While oil price and stock market performance are found to have significant effects on exchange rate. The study concludes that stock market performance provides an important policy help in stemming the erratic fluctuations in oil price.
Disclosure statement
No potential conflict of interest was reported by the author(s).
Additional information
Funding
References
- Ahmed, R., Qaiser, I., & Yaseen, M. R. (2016). Nexus between exchange rate volatility and oil price fluctuations: Evidence from Pakistan. Pakistan Journal of Commerce and Social Sciences, 10(1), 122–18. https://www.econstor.eu/bitstream/10419/188244/1/pjcss283.pdf
- Aloui, R., Hammoudeh, S., & Nguyen, D. K. (2013). A time-varying copula approach to oil and stock market dependence: The case of transition economies. Energy Economics, 39, 208–221. https://doi.org/10.1016/j.eneco.2013.04.012
- Apergis, N., & Miller, S. M. (2009). Do structural oil-market shocks affect stock prices? Energy Economics, 31(4), 569–575. https://doi.org/10.1016/j.eneco.2009.03.001
- Arora, V., & Tanner, M. (2013). Do oil prices respond to real interest rates? Energy Economics, 36, 546–555. https://doi.org/10.1016/j.eneco.2012.11.001
- Arouri, M. E. H., & Rault, C. (2012). Oil prices and stock markets in GCC countries: Empirical evidence from panel analysis. International Journal of Finance & Economics, 17(3), 242–253. https://doi.org/10.1002/ijfe.443
- Awerbuch, S., & Sauter, R. (2006). Exploiting the oil–GDP effect to support renewables deployment. Energy Policy, 34(17), 2805–2819. https://doi.org/10.1016/j.enpol.2005.04.020
- Basher, S. A., & Sadorsky, P. (2006). Oil price risk and emerging stock markets. Global Finance Journal, 17(2), 224–251. https://doi.org/10.1016/j.gfj.2006.04.001
- Bernanke, B. (2016). The relationship between stocks and oil prices. Ben Bernanke’s Blog on Brookings Posted February.
- Berument, M. H., Sahin, A., & Sahin, S. (2014). The relative effects of crude oil price and exchange rate on petroleum product prices: Evidence from a set of Northern Mediterranean countries. Economic Modelling, 42, 243–249. https://doi.org/10.1016/j.econmod.2014.07.019
- Bjørnland, H. C. (2009). Oil price shocks and stock market booms in an oil exporting country. Scottish Journal of Political Economy, 56(2), 232–254. https://doi.org/10.1111/j.1467-9485.2009.00482.x
- Blanchard, O. J., & Gali, J. (2007). The macroeconomic effects of oil shocks: Why are the 2000s so different from the 1970s? (No. w13368). National Bureau of Economic Research.
- Buetzer, S., Habib, M. M., & Stracca, L. (2016). Global exchange rate configurations: Do oil shocks matter? IMF Economic Review, 64(3), 443–470. https://doi.org/10.1057/imfer.2016.9
- Chen, S. S., & Chen, H.-C. (2007). Oil prices and real exchange rate. Energy Economics, 29(3), 390–404. https://doi.org/10.1016/j.eneco.2006.08.003
- Chen, S. S. (2009). Revisiting the inflationary effects of oil prices. The Energy Journal, 30(4). https://doi.org/10.5547/0195-6574-EJ-Vol30-No4-5
- Cunado, J., & de Gracia, F. P. (2014). Oil price shocks and stock market returns: Evidence for some European countries. Energy Economics, 42, 365–377. https://doi.org/10.1016/j.eneco.2013.10.017
- Davis, S. J., & Haltiwanger, J. (2001). Sectoral job creation and destruction responses to oil price changes. Journal of Monetary Economics, 48(3), 465–512. https://doi.org/10.1016/S0304-3932(01)00086-1
- De Gregorio, J., Landerretche, O., Neilson, C., Broda, C., & Rigobon, R. (2007). Another pass-through bites the dust? Oil prices and inflation [with comments]. Economia, 7(2), 155–208. http://www.bcentral.cl/eng/stdpub/studies/workingpaper
- De Gregorio, J. (2012). Commodity prices, monetary policy, and inflation. IMF Economic Review, 60(4), 600–633. https://doi.org/10.1057/imfer.2012.15
- El Abed, R., Amor, T. H., Nouira, R., & Rault, C. (2016). Asymmetric effect and dynamic relationships between Oil prices shocks and exchange rate volatility: Evidence from some selected MENA countries. Topics in Middle Eastern and African Economies, 18(2).
- El-Sharif, I., Brown, D., Burton, B., Nixon, B., & Russell, A. (2005). Evidence on the nature and extent of the relationship between oil prices and equity values in the UK. Energy Economics, 27(6), 819–830. https://doi.org/10.1016/j.eneco.2005.09.002
- Ferreira, P., Pereira, É. J. D. A. L., da Silva, M. F., & Pereira, H. B. (2019). Detrended correlation coefficients between oil and stock markets: The effect of the 2008 crisis. Physica A: Statistical Mechanics and Its Applications, 517, 86–96. https://doi.org/10.1016/j.physa.2018.11.021
- Gisser, M., & Goodwin, T. H. (1986). Crude oil and the macroeconomy: Tests of some popular notions: Note. Journal of Money, Credit, and Banking, 18(1), 95–103. https://doi.org/10.2307/1992323
- Gogineni, S. (2008). The stock market reaction to oil price changes. Division of Finance, Michael F. Price College of Business, University of Oklahoma, Norman, 23. https://citeseerx.ist.psu.edu/viewdoc/download
- Habib, M. M., & Kalamova, M. M. (2007). Are there oil currencies? The real exchange rate of oil exporting countries. SSRN Electronic Journal. https://doi.org/10.2139/ssrn.1032834
- Hamdi, B., Aloui, M., Alqahtani, F., & Tiwari, A. (2019). Relationship between the oil price volatility and sectoral stock markets in oil-exporting economies: Evidence from wavelet nonlinear denoised based quantile and Granger-causality analysis. Energy Economics, 80, 536–552. https://doi.org/10.1016/j.eneco.2018.12.021
- Hamilton, J. D. (1983). Oil and the macroeconomy since World War II. Journal of Political Economy, 91(2), 228–248. https://doi.org/10.1086/261140
- Hamilton, J. D. (1989). A new approach to the economic analysis of nonstationary time series and the business cycle. Econometrica: Journal of the Econometric Society, 57(2), 357–384. https://doi.org/10.2307/1912559
- Hamilton, J. D. (1996). This is what happened to the oil price-macroeconomy relationship. Journal of Monetary Economics, 38(2), 215–220. https://doi.org/10.1016/S0304-3932(96)01282-2
- Hamilton, J. D. (2008). Oil and the Macroeconomy. The New Palgrave Dictionary of Economics, 2.
- Hammoudeh, S., & Choi, K. (2006). Behavior of GCC stock markets and impacts of US oil and financial markets. Research in International Business and Finance, 20(1), 22–44. https://doi.org/10.1016/j.ribaf.2005.05.008
- Henriques, I., & Sadorsky, P. (2008). Oil prices and the stock prices of alternative energy companies. Energy Economics, 30(3), 998–1010. https://doi.org/10.1016/j.eneco.2007.11.001
- Hooker, M. A. (2002). Are oil shocks inflationary? Asymmetric and nonlinear specifications versus changes in regime. Journal of Money, Credit, and Banking, 34(2), 540–561. https://doi.org/10.1353/mcb.2002.0041
- Jiranyakul, K. (2015). Oil price volatility and real effective exchange rate: The case of Thailand. International Journal of Energy Economics and Policy, 5(2), 574–579.
- Jones, C. M., & Kaul, G. (1996). Oil and the stock markets. The Journal of Finance, 51(2), 463–491. https://doi.org/10.1111/j.1540-6261.1996.tb02691.x
- Kilian, L., & Park, C. (2009). The impact of oil price shocks on the US stock market. International Economic Review, 50(4), 1267–1287. https://doi.org/10.1111/j.1468-2354.2009.00568.x
- Kilian, L. (2009). Not all oil price shocks are alike: Disentangling demand and supply shocks in the crude oil market. American Economic Review, 99(3), 1053–1069. https://doi.org/10.1257/aer.99.3.1053
- Kin, S., & Courage, M. (2014). The impact of oil prices on the exchange rate in South Africa. Journal of Economics, 5(2), 193–199. https://doi.org/10.1080/09765239.2014.11884996
- Köse, N., & Ünal, E. (2020). The impact of oil price shocks on stock exchanges in Caspian Basin countries. Energy, 190, 116383. https://doi.org/10.1016/j.energy.2019.116383
- Lescaroux, F., & Mignon, V. (2008). On the influence of oil prices on economic activity and other macroeconomic and financial variables. OPEC Energy Review, 32(4), 343–380. https://doi.org/10.1111/j.1753-0237.2009.00157.x
- Li, S. F., Zhu, H. M., & Yu, K. (2012). Oil prices and stock market in China: A sector analysis using panel cointegration with multiple breaks. Energy Economics, 34(6), 1951–1958. https://doi.org/10.1016/j.eneco.2012.08.027
- Miller, J. I., & Ratti, R. A. (2009). Crude oil and stock markets: Stability, instability, and bubbles. Energy Economics, 31(4), 559–568. https://doi.org/10.1016/j.eneco.2009.01.009
- Mork, K. A. (1989). Oil and the macroeconomy when prices go up and down: An extension of Hamilton’s results. Journal of Political Economy, 97(3), 740–744. https://doi.org/10.1086/261625
- Mork, K. A., Olsen, O., & Mysen, H. T. (1994). Macroeconomic responses to oil price increases and decreases in seven OECD countries. The Energy Journal, 15(4). https://www.iaee.org/energyjournal/article/1177
- Nandha, M., & Faff, R. (2008). Does oil move equity prices? A global view. Energy Economics, 30(3), 986–997. https://doi.org/10.1016/j.eneco.2007.09.003
- Narayan, P. K., Narayan, S., & Prasad, A. (2008). Understanding the oil price-exchange rate nexus for the Fiji islands. Energy Economics, 30(5), 2686–2696. https://doi.org/10.1016/j.eneco.2008.03.003
- Narayan, P. K., & Gupta, R. (2015). Has oil price predicted stock returns for over a century? Energy Economics, 48, 18–23. https://doi.org/10.1016/j.eneco.2014.11.018
- Nasir, M. A., Rizvi, S. A., & Rossi, M. (2018). A treatise on oil price shocks and their implications for the UK financial sector: Analysis based on time‐varying structural VAR model. The Manchester School, 86(5), 586–621. https://doi.org/10.1111/manc.12206
- O’Neill, T. J., Penm, J., & Terrell, R. D. (2008). The role of higher oil prices: A case of major developed countries. Research in Finance, 24, 287–299. https://doi.org/10.1016/S0196-3821(07)00211-0
- Ogundipe, O. M., Ojeaga, P., & Ogundipe, A. A. (2014). Oil price and exchange rate volatility in Nigeria. IOSR Journal of Economics and Finance, 5(4), 01–09. https://doi.org/10.9790/5933-0540109
- Papapetrou, E. (2001). Oil price shocks, stock market, economic activity and employment in Greece. Energy Economics, 23(5), 511–532. https://doi.org/10.1016/S0140-9883(01)00078-0
- Primiceri, G. E. (2005). Time varying structural vector autoregressions and monetary policy. The Review of Economic Studies, 72(3), 821–852.
- Reboredo, J. C. (2012). Modelling oil price and exchange rate co-movements. Journal of Policy Modeling, 34(3), 419–440. https://doi.org/10.1016/j.jpolmod.2011.10.005
- Reboredo, J. C., & Rivera-Castro, M. A. (2014). Wavelet-based evidence of the impact of oil prices on stock returns. International Review of Economics & Finance, 29, 145–176. https://doi.org/10.1016/j.iref.2013.05.014
- Rickne, J. (2009). Oil prices and real exchange rate movements in oil-exporting countries: The role of institutions. IFN Working Paper No. 810, 2009. ECONSTOR.
- Sadorsky, P. (1999). Oil price shocks and stock market activity. Energy Economics, 21(5), 449–469. https://doi.org/10.1016/S0140-9883(99)00020-1
- Shahrestani, P., & Rafei, M. (2020). The impact of oil price shocks on Tehran Stock Exchange returns: Application of the Markov switching vector autoregressive models. Resources Policy, 65, 101579. https://doi.org/10.1016/j.resourpol.2020.101579
- Singhal, S., Choudhary, S., & Biswal, P. C. (2019). Return and volatility linkages among International crude oil price, gold price, exchange rate and stock markets: Evidence from Mexico. Resources Policy, 60, 255–261. https://doi.org/10.1016/j.resourpol.2019.01.004
- Sukcharoen, K., Zohrabyan, T., Leatham, D., & Wu, X. (2014). Interdependence of oil prices and stock market indices: A copula approach. Energy Economics, 44, 331–339. https://doi.org/10.1016/j.eneco.2014.04.012
- Thorbecke, W. (2019). Oil prices and the US economy: Evidence from the stock market. Journal of Macroeconomics, 61, 103137. https://doi.org/10.1016/j.jmacro.2019.103137
- Tong, H. (1983). Threshold Models in Non-linear Time Series Analysis. In K. Krickegerg (Ed.), Vol. 21 of lecture notes in Statistics. Springer-Verlag.
- Turhan, I., Hacihasanoglu, E., & Soytas, U. (2013). Oil prices and emerging market exchange rates. Emerging Markets Finance and Trade, 49(sup1), 21–36. https://doi.org/10.2753/REE1540-496X4901S102
- Turhan, M. I., Sensoy, A., & Hacihasanoglu, E. (2014). A comparative analysis of the dynamic relationship between oil prices and exchange rates. Journal of International Financial Markets, Institutions and Money, 32, 397–414. https://doi.org/10.1016/j.intfin.2014.07.003
- Van den Noord, P., & André, C. (2007). Why has core inflation remained so muted in the face of the oil shock? ECO/WKP. https://www.oecd-ilibrary.org/docserver/206408110285
- Wang, L., Ma, F., Niu, T., & He, C. (2020). Crude oil and BRICS stock markets under extreme shocks: New evidence. Economic Modelling, 86, 54–68. https://doi.org/10.1016/j.econmod.2019.06.002
- Zhang, C., & Chen, X. (2011). The impact of global oil price shocks on China’s stock returns: Evidence from the ARJI (-ht)-EGARCH model. Energy, 36(11), 6627–6633. https://doi.org/10.1016/j.energy.2011.08.052