
 ?Mathematical formulae have been encoded as MathML and are displayed in this HTML version using MathJax in order to improve their display. Uncheck the box to turn MathJax off. This feature requires Javascript. Click on a formula to zoom.
Abstract
We investigate the impact of intellectual capital (IC) on firm performance (FP). This study contributes to the literature on IC by extending the IC components and exploring the moderating effect of intellectual property right (IPR) reform on the IC–FP association. An analysis of a dataset of non-financial enterprises with 6,303 firm-year observations collected from ASEAN member countries from 2009 to 2019 reveals thatFP is positively related to IC and IC components. Human capital is found to be the leading element because it exerts direct as well as indirect influences on FP. On the other hand, IPR determines both significance and the strength of the relationship between IP and FP.
PUBLIC INTEREST STATEMENT
In the world of hyper-competition, firms invariably keep making huge attempts to diagnose the sources of competitive advantage. The study highlights the enormous importance of human capital in creating sustainable advantage by continuously improving key business processes and accelerating innovativeness. Consequently, the firm possesses a highly competitive value proposition to the target customer. The findings of the study support the relation between human capital and firm performance. Additionally, firms that operate in knowledge-intensive industries and primarily hinge on intellectual property to create competitive advantage demand a well-developed system of intellectual property rights to keep their advantage sources from being imitated by rivals. Accordingly, nations in the transformation process to the knowledge-based development stage should acknowledge importance of intellectual property rights to improve their business environment.
1. Introduction
In the knowledge-based economy, intellectual capital (IC) attracts the undivided attention of scholars and practitioners because it justifies the extensive gap between book and market values (Galbraith, Citation1969), is the key to firms’ competitive advantage, and has been the bedrock of the transformation of many nations into innovation-driven economies (Schwab, Citation2017). The dominant source of competitive advantage and firm value or firm performance (FP) includes intangible assets—knowledge, intellectual property (IP), and experience (Conner & Prahalad, Citation1996). Several empirical studies have consistently revealed that IC, its elements (human and structural capital), and the interactions between elements are related to FP (Lin & Wu, Citation2014). More importantly, human capital (HC) is most important element of FP.
As a result, in the era of knowledge dominating value creation and capture, firms consider IC to be the most powerful competitive weapon. Accordingly, IC has been managed in attempts to maximize firm value through comprehensive frameworks such as the Balanced Scorecard, Skandia Navigator, or Dow’s intellectual asset management model. Moreover, a growing number of empirical studies have been investigating the contribution of IC to FP. They have been conducted on a wide range of industries across nations and have revealed a significantly positive relationship. However, the extent to which the IC is protected against piracy is expected to account for variations in the strength of its relationship with FP. Thus, this study aims to determine the association between IC and FP as well as the importance of intellectual property rights (IPR) reform in terms of that association.
The measurement of not only IC but also the relationship between IC and FP has been researched by many previous studies. In terms of IC estimation, the value-added (VA) intellectual coefficient (VAICTM) model developed by Pulic (Citation1998, Citation2000) and considered the first model for IC measurement, comprises three components: (i) HC efficiency, HCE; (ii) structural capital (SC) efficiency, SCE; and (iii) capital employed (CE) efficiency, CEE. To understand the concept of knowledge management, a study by Nimtrakoon (Citation2015) modifies Pulic’s VAICTM model by adding a fourth component: relational capital (RC) efficiency, RCE. However, this modified VAIC model still follows the VA calculation based on the Pulic’s VAICTM model without adjusting the marketing costs in the VA formula. Bayraktaroglu et al. (Citation2019) argue that if research and development (R&D) expenses and sales, as well as marketing and distribution expenses, reflect innovation capital, we should not consider these expenses as cost. By adjusting the VA calculation, Bayraktaroglu et al.’s modified VAIC model overcomes the limitations of both the Pulic’s VAICTM model and Nimtrakoon’s modified version. However, Bayraktaroglu et al.’s modified VAIC model also views IC as the total of three components comprising Pulic’s VAICTM model.
This study contributes to the previous IC literature in two aspects: The first is the application of a modified VAIC model as a proxy measure for IC to analyze the impact of IC on FP. We combine RCE—the fourth component of the VAIC model developed by Nimtrakoon (Citation2015), with VA estimation modified by Bayraktaroglu et al. (Citation2019). The modified VAIC and its four components—CEE, HCE, SCE, and RCE—are applied as proxy measures for IC in the empirical models. The second involves exploring the moderating effect of IPR reform—an important issue in emerging economies—on the IC–FP association.
Multiple regression analysis for panel data has been employed to identify the impact of IC components on firm value and the moderating effect of IPR reform on the IC-firm value relationship. For this study, data were collected from the Thomson Reuters database and from the financial statements of listed firms from member countries of the Association of South East Asian Nations (ASEAN, which include Singapore, Malaysia, Indonesia, the Philippines, and Vietnam) during the period 2009 to 2019. Our final sample covers an unbalanced panel and comprises 6,303 firm-year observations.
The remainder of this paper is structured as follows. Section 2 reviews the literature on the IC-FP relationship and the moderating role of IPR reform. Section 3 specifies the data and method used to address the research objectives. Section 4 reports the empirical results. Section 5 concludes the paper.
2. Literature review
2.1. IC, IC components, and FP
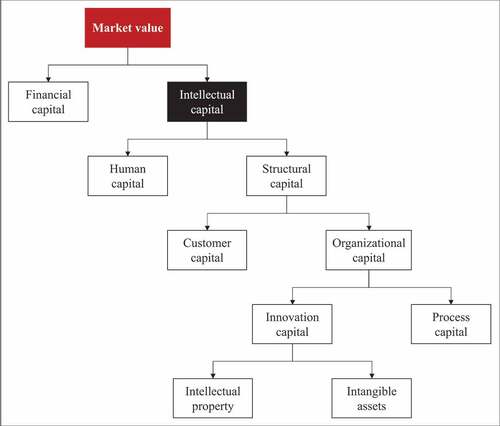
IC is defined as knowledge that is converted into value and comprises HC and SC according to the Skandia Value Scheme (Edvinsson, Citation1997; Edvinsson & Sullivan, Citation1996; Petrash, Citation1996) (see Figure ). Knowledge owned by individuals is considered to be HC, while knowledge embedded in the structure, processes, and culture of firms is defined as SC.
Several complementary resources, including production technologies or patents, have proved the importance of enhancing the demand-side mobility constraint of workers. The sufficiently high demand-side constraint allows firms to improve their bargaining power over workers, helping firms create a competitive advantage. However, this advantage may be stripped away if the complementary resources are imitated. In the words of Barney (Citation1991) and Wernerfelt (Citation1984), it is required that the key complementary resource be valuable, rare, inimitable, and non-substitutable (VRIN) in order for firms to have a sustainable competitive advantage (SCA).
On the supply-side, mobility constraints can be imposed by mobility costs borne by employees. Idiosyncratic employee preferences for a given employer due to the firm’s attractive compensation package or convenient working location can increase mobility costs. Additionally, legal institutions—noncompete agreements and patent enforcement—also increase mobility costs (Campbell et al., Citation2012). Similarly, a firm can sustain its competitive advantage if its resources that increase mobility cost are VRIN.
According to the above argument, as long as both the demand- and supply-side mobility constraints remain high and idiosyncratic resources are inimitable, the firms can realize SCA. IP is a typical asset to which this study is dedicated because it is the underlying element of strategic management.
Firm value is fundamentally computed based on prospective cash flows gained from presumably infinite periods of operations. At valuation, the future cash flows are estimated from the expected operating earnings after subtracting reinvestment. In turn, the earnings and their durability are highly dependent on firms’ abilities to maintain their competitive advantage in competitive markets. In other words, high firm performance necessitates SCA. In extant theory, the two contrary approaches to SCA—industry organization view and resource-based view—have been popularized by Porter (Citation1985), Barney (Citation1991), Wernerfelt (Citation1984), and Peteraf (Citation1993). This study places an emphasis on the resource-based view in justifying the manner of creating SCA. The firm acquires a wide variety of resources, such as assets, capabilities, knowledge, or organizational processes in operations (Barney, Citation1991). Those resources can be classified into different kinds of capital—physical and intellectual. In the post–World War II era, physical capital played a crucial role in providing firms with competitive advantage in efficiency-driven economies.
However, since the late 1990s some nations have transformed into innovation-driven economies; consequently, IC has gained considerable momentum in creating competitive advantage. Firms consider IC as the most powerful weapon to gain competitive advantage in this era of hyper competition (Wang et al., Citation2005). As a result, IC has been not only classified but also managed in attempts of maximizing FP through various comprehensive frameworks—Balanced scorecard, Skandia navigator, and Dow intellectual asset management model. In academics, a growing number of empirical studies have been conducted to investigate the contribution of IC and its elements to FP. Positive relationships have been found significant in empirical studies (e.g., Bontis et al., Citation2000; Clarke et al., Citation2011; Cohen & Kaimenakis, Citation2007; Firer & Mitchell Williams, Citation2003; Hejazi et al., Citation2016; Hitt et al., Citation2001; Nazari et al., Citation2008; Ozkan et al., Citation2017; Riley et al., Citation2017; Smriti & Das, Citation2018; Sydler et al., Citation2014; Tseng & James Goo, Citation2005; Wang et al., Citation2018; Wang et al., Citation2005).
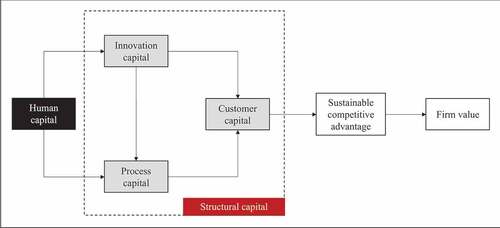
Wang et al. (Citation2005) illustrate how FP is determined by both IC and interactions between IC elements in the Taiwanese IT industry from 1997 to 2001 (see Figure ). First, unlike customer expectations, which cannot be controlled by firms, internal processes can easily be altered by new designs. Firms tend to increase customer satisfaction by implementing new internal process designs. In this way, customer capital is influenced by process capital. Brilliant internal processes hardly happen by chance; they need to be well designed, continuously innovated, and well implemented by qualified employees. Thus, process capital is determined by both innovation and HC. Finally, firms need to hire highly qualified employees because their capabilities and knowledge are the sources of innovation. Accordingly, HC is the starting point for establishing other IC elements and exerts an indirect influence on FP (Bollen et al., Citation2005; Nazari et al., Citation2008; Wang et al., Citation2005).
Figure 2. Interrelationship between IC elements and their impacts on performance.
HC also exerts a direct influence on FP, especially in the presence of labor market frictions and firm specificity (Campbell et al., Citation2012; Chadwick, Citation2017). A new comprehensive framework for HC-based competitive advantage is developed. Accordingly, this framework does not solely rely on firm-specificity HC but features supply-side and demand-side mobility constraints to determine how the HC-based competitive advantage is created and sustained (Campbell et al., Citation2012).
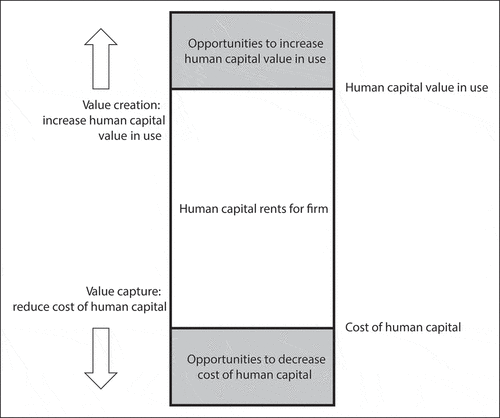
Chadwick (Citation2017) describes how labor market frictions and idiosyncratic firm capabilities and resources are employed to enhance competitive advantage through two processes: HC value creation and value capture (see Figure ). On the one hand, firms attempt to enhance the use value of HC to the maximum potential value such as employing inherently scarce HC, and firm complementary. On the other hand, on the purpose of capturing value generated by HC firms squeeze the HC cost by their capabilities in managing the HC administrative cost (e.g., infrastructure cost to acquire and retain HC) and abilities to leverage labor market frictions (e.g., information asymmetries regarding HC). In summary, HC ranks first in importance among IC elements in terms of competitive advantage (Alipour, Citation2012; Clarke et al., Citation2011; Wang et al., Citation2005). Therefore, HC is the primary factor on which management should expend the most effort (Wang et al., Citation2005).
2.2. IC measurement
IC value estimation methods are based on two approaches: financial and non-financial valuation. Information on measuring IC is unavailable because it is not reflected in financial statements. The VAICTM model (Pulic, Citation1998, Citation2000) of financial valuation is more advantageous when it allows researchers to employ data reported in audited financial statements to calculate IC and IC components. Pulic’s VAICTM model is popular because of its simplicity and has been adopted by both academics as well as practitioners to measure IC since 2000 (Nimtrakoon, Citation2015). Additionally, the results of the VAIC model are much more verifiable than those of other models (Young et al., Citation2009). Pulic’s VAICTM model defines IC as the total of three components: (i) HCE; (ii) SCE; and (iii) CEE.
However, some studies argue that while the VAICTM model is helpful in terms of data collection, its accounting aspect may not directly connect to the idea of knowledge management. Thus, some modified and extended models based on the VAICTM model were developed to ensure the appropriation in IC value (Nazari et al., Citation2008; Ulum et al., Citation2014). Nimtrakoon (Citation2015) argues that IC is the source of added value created from intangible assets including HC, SC, and RC. The study by Nimtrakoon (Citation2015) modifies Pulic’s VAICTM model by adding the fourth component: RCE, which is measured by the ratio of RC to VA, where RC represents marketing costs.
Regarding the accounting aspect, payments made to employees are considered to comprise the cost and are reported in financial statements. In terms of management, these payments can increase firm value because they reflect employees’ expertise, skills, experience, etc. Hence, Pulic (Citation2000) considers employee expenses as a proxy measure for HC instead of as costs. Riley et al. (Citation2017) show that firms will gain even larger value from their investments in HC if those investments are combined with complementary assets, namely R&D, physical capital, and advertising investments. Vomberg et al. (Citation2015) provide evidence of a complementary relationship between HC and brand equity. The findings of these two studies are consistent with the capabilities-based theory developed by Teece (Citation2015). Therefore, idiosyncratic complementarities justify significant differences in HC rent across firms (Chadwick, Citation2017).
Based on this idea, Bayraktaroglu et al. (Citation2019) argue that if R&D, sales, marketing, and distribution expenses reflect innovation capital, they should be shown in the VA formula. In other words, these expenses should not be considered as costs. By adjusting the VA calculation, Bayraktaroglu et al.’s modified VAIC model overcomes the limitations of both Pulic’s VAICTM model and the Nimtrakoon’s modified VAIC model. However, Bayraktaroglu et al.’s modified VAIC model still defines IC as the total of HCE, SCE, and CEE, without RCE. Because SC is measured by the difference between VA and HC, RCE of Nimtrakoon’s model can be reflected in the SCE of Bayraktaroglu et al.’s model.
2.3. The moderating role of IPR reform
IC is an affirmed source of competitive advantage. However, whether or not SCA can be gained strongly relies on how effectively IC and IPR are protected from being imitated. Consequently, IPR reform plays an important role in the relationship between IC and FP.
Legislating IPR is a solution for protecting IP from being imitated. A developed system of IPR effectively imposes severe punishments on rivals’ copying reserved technologies (Helpman, Citation1993). In contrast, in a primitive system of IPR, successful innovations in products will be immediately imitated prior to recovery of R&D costs. Therefore, IPR assures SCA for innovating firms (de Villemeur et al., Citation2019; Branstetter, Citation2017), especially for those employing IC as a source of competitive advantage (Arrow, Citation1962). At the macro level, IPR reforms are strongly recommended if nations wish to enhance their competitiveness because of their association with FDI inflows and technology transfer. Nations pursuing advances in patent rights will benefit from the massive flow of foreign investment (e.g., Eastern Europe in high-technology industries (Javorcik, Citation2004)), expansion of domestic firms (Branstetter et al., Citation2011), and advanced technologies transferred through multinational companies (Bilir, Citation2014; Wakasugi & Ito, Citation2009). Thus, we argue that IPR reforms play a moderating role on the IC-FP relationship.
3. Methodology
3.1. Data
We study the impact of IC on FP and investigate the moderating role of IPR reform on the IC-FP relationship. We examined the sample of all non-financial companies listed on the stock exchanges of ASEAN countries from 2009 to 2019 and exclude the financial institutions and utility firms because of the difference in capital structure (see Fama & French, Citation1992), ownership structure (see Lozano et al., Citation2016), and financial statement forms (see Basil & Khaled, Citation2011). Data were collected from the Thomson Reuters database and financial statements of listed firms from ASEAN countries. Our final sample covered an unbalanced panel comprising 6,303 firm-year observations.
Fixed effects model (FE) and random effects model (RE) were applied to address the aims of this paper. F-test, LM-test (Breusch-Pagan Lagrange Multiplier), and Hausman-test were used to select the most appropriate regression model. Additionally, the estimation strategy proceeded through two sequential stages: In accordance with popular previous studies, we first regressed the modified VAIC (MVAIC) and its components on FP. In the next stage, we divided the sample into two sub-groups—pre-IPR reform and post-IPR reform—to test the moderating role of IPR reform.
3.2. Variable definition
3.2.1. Firm performance
With regard to the finance aspect, return (i.e., return on assets, ROA; return on equity, ROE; return on sales, ROS) and Tobin’s Q were applied as proxy measures for FP. Empirical studies use Tobin’s Q as a proxy for firm value (e.g., Connelly et al., Citation2012; Hai-Ly & Kim-Duc, Citation2018), while return is employed to measure performance (e.g., Mbama & Ezepue, Citation2018; Nguyen et al., Citation2021). In this study, we employed two indicators, ROA and ROE, as proxy measures for FP. These have been frequently applied to measure FP in previous studies related to IC (e.g., Nimtrakoon, Citation2015). Following the valuation aspect, we adjusted both earnings and invested capital in the return on capital formula (i.e., ROA and ROE) (see Damodaran, Citation2012). Specifically, we used earnings before interest and after tax (EBIAT) and excluded net financial income. Similarly, cash, cash equivalents, and current financial assets were excluded from invested capital. Hence, ROA is the ratio of the adjusted EBIAT to the adjusted assets and ROE is the ratio of the net adjusted operating income to the adjusted equity.
3.2.2. Intellectual capital
This study contributes to the IC literature by expanding the IC components. We combine the RCE developed by Nimtrakoon (Citation2015), with the VA estimation modified by Bayraktaroglu et al. (Citation2019). The modified VAIC and its four components—CEE, HCE, SCE, and RCE—are applied as proxy measures for IC in the empirical models. The measurement of the modified VAIC is summarized as follows:
where VA is the value added of a specific firm; OUT is the total income; IN comprises the total expenses excluding employee costs and sales, marketing, and distribution expenses; CEE is the capital employed efficiency; CE is the capital employed—physical and financial—measured by the difference between total assets and intangible assets; HCE is the human capital efficiency; HC is the human capital, measured by total employee expenditures; RCE is the relational capital efficiency; RC is the relational capital, measured by sales, marketing, and distribution expenses; SCE is the structural capital efficiency; SC is the structural capital, measured by VA–HC—RC; ICE is the intellectual capital efficiency, measured by summing up HCE, SCE, and RCE; and MVAIC is the modified value added intellectual coefficient, measured by summing up ICE and CEE.
Besides MVAIC, we also applied three previous models (i.e., Pulic’s VAICTM, Nimtrakoon’s modified VAIC, and Bayraktaroglu et al.’s modified VAIC model) as other proxy measures for IC.
3.2.3. Moderating variable: IPR reform
This study features IPR reform as the moderating variable, which can exert influence on how IC contributes to FP. The firms operating in knowledge-intensive industries, for instance, inherently hinge on IC (e.g., IP) to create competitive advantage. Therefore, a continuously improved IPR system enhance the IC’s contribution to FP.
Regarding patent laws, the five main dimensions to present IPR reform include when (i) the range of eligible inventions is expanded; (ii) the IP is protected with the expansion within the effective scope; (iii) the length of IP protection is increased; (iv) the enforcement of IPR rights is improved; and (v) the administration of the IP system is improved (see Alimov, Citation2019). Table shows the reform years of four ASEAN countries and provides information about major IP reforms based on these five dimensions.
Table 1. The reform years of four countries in ASEAN
3.2.4. Control variables
The study includes several variables related to firm characteristics that have been used in other studies as control variables. These include firm size, measured by the natural log of book value of total assets (Riahi‐Belkaoui, Citation2003; Zéghal & Maaloul, Citation2010); firm age, measured by the natural logarithm of the year since the firm’s establishment (Connelly et al., Citation2012); financial leverage, measured by the ratio of the book value of total debt to the book value of common equity (Lev & Sougiannis, Citation1996; Zéghal & Maaloul, Citation2010); and property, plant, and equipment (PP&E), measured by the ratio of net PP&E to total assets (Dhaliwal et al., Citation2015). Table summarizes the variables used in our model and their measurements. It reports the number and the percentage of observations classified by year (Panel A), industry (Panel B), and country (Panel C).
Table 2. Sample selection
4. Results
4.1. Univariate analysis
Panel A of Table outlines our sample selection criteria by year. The sample begins with all firm-year observations in the Thomson Reuters database from 2009 to 2019. We chose 2009 as the start year because we wanted to ensure that all firms in the sample were not impacted by a financial crisis. Similarly, we chose 2019 as the end year to avoid the impact of the COVID-19 pandemic. Each year represents between 3.25% and 12.95% of the overall sample. Panel B of Table summarizes the industry composition of our sample. Industry groups follow the Global Industry Classification Standard (GICS) in Thomson Reuters’ database. The largest concentration of sample observations occurred in Industrials (22.9%), with no other industry reporting more than 15.3% of our sample observations. Panel C of Table presents the number of observations by country. We began with six countries—Singapore, Malaysia, Thailand, Indonesia, Philippines, and Vietnam—because the lack of data of the rest of the ASEAN member countries in the database. The final sample included four nations apart from Singapore and Thailand because of the lack of data of total employee expenditures to measure the main independent variable, HC. Indonesia had the highest number of observations (41%) while Malaysia had the lowest (15%).
Information on descriptive statistics, including the number of observations, mean, standard deviation, minimum, and maximum of all variables is reported in Table .
Table 3. Descriptive statistics
Panel A in Table summarizes the descriptive analysis of all firms. The mean scores of ROA and ROE were 4.76 and 8.83, respectively, implying that the average ROA of all firms is lower than the average ROE. This highlights the effectiveness of applying a capital structure of firms in ASEAN nations. The mean score of VAIC is 11.57, revealing that firms in this study created 11.57 units for every 1.00 unit. The HCE is the most influential component in creating wealth with the greatest mean value of 10.43, compared to SCE, RCE, and CEE with mean scores of 0.67, 0.18, and 0.30, respectively. This is consistent with previous findings, which show that HC is the most effective driver of value creation. FP, IC, IC components, and control variables may differ before and after the IPR reform year; hence, it is appropriate to examine variables in both periods. Panel B in Table summarizes the descriptive statistics for all variables in the years before and after the year of actual reform. In general, there are highly significant differences among two periods for FP, HCE, ICE, VAIC, firm age, firm size, and PP&E. In contrast, there are no significant differences for SCE, RCE, CEE, and leverage.
Before multivariate analysis, we considered the correlation among different variables. The correlation matrix reported in Table indicates that no correlation between independent variables exceeded the value of 0.2. Thus, multicollinearity was not a substantial problem in our multivariate analysis.
Table 4. Pairwise correlation
4.2. Multivariate analysis
In this study, we employed two sets of regression techniques—fixed-effects and random-effects—to test not only the impact of IC on FP but also the moderating role of IPR reform on the IC-FP relationship. F-test, LM-test (Breusch-Pagan Lagrange Multiplier), and Hausman-test results indicate that the fixed-effects estimations were more appropriate for all models of our study. To test the moderating role of IPR reform, we divided the sample into two sub-groups: pre-IPR and post-IPR.
4.2.1. IC and FP
Table presents the estimation results for two alternative specifications, where the proxy measure of the dependent variable is ROA or ROE. Panels A, B, and C present the estimation results regarding the impact of IC’s components, ICE, and VAIC on FP, respectively. For each dependent variable, there are four proxy measurements for IC value including Pulic’s IC, Nimtrakoon’s IC, Bayraktaroglo’s IC, and our extended IC. Nimtrakoon’s IC model extends Pulic’s IC model by adding the fourth component, RCE, but does not adjust the VA equation. By contrast, Bayraktaroglo’s IC model adjusts the VA equation but comprises the same number of IC components as Pulic’s IC. This means that RCE is reflected in SCE. Our extended IC combines the advantages of Nimtrakoon’s IC model and Bayraktaroglo’s IC model by considering four IC components and adjusting the VA equation.
Table 5. Regression of financial performance on intellectual capital
With regard to the sub-components of IC reported in Panel A, the results show that the coefficient of HCE is positive and highly significant in all estimated regressions with different IC measurements, indicating that the ROA is positively related to their HCE. The results are also consistent when FP is measured by ROE. The findings are similar to those of Nimtrakoon (Citation2015) and Bayraktaroglu et al. (Citation2019). There is a significant positive relationship between SCE and ROA when SCE follows the measurement of Pulic’s and Bayraktaroglo’s IC models, at the 10% and 5% levels, respectively. In this situation, SCE seems to include the RCE and our findings are similar to those of Bayraktaroglu et al. (Citation2019). However, our results are also consistent when the dependent variable is measured by ROE, although Bayraktaroglu et al. (Citation2019) reported that there is no significant SCE–ROE association. By contrast, with regard to the SCE measurements followed by Nimtrakoon (Citation2015) and our extended IC, the coefficients of SCE were negative and insignificant, which were also similar to the findings by Nimtrakoon (Citation2015). The SCE results were almost unchanged when FP was the ROE. However, we found that the relationship between RCE and ROA was negative and significant at the 5% level while the RCE–ROE relation was insignificant.
Regarding the ICE reported in Panel B, the ICE coefficients were positive and statistically significant at the 1% level for both proxy measures for FP, ROA, and ROE. In addition, there were positive and highly significant relationships at the 1% level between CEE and FP when we considered the sub-components of IC (Panel A) and ICE (Panel B). All results were almost unchanged when the dependent variable was the ROE. Most importantly, VAIC—the key explanatory variable reported in Panel C—had significant positive impacts on both ROA and ROE at the 1% level. The findings were similar to previous studies.
4.2.2. The moderating role of IPR reform
Table presents the role of IPR reform in the relationship between IC and FP. There are two proxy measurements for FP variables, ROA and ROE, and that are reported in Panel A and Panel B, respectively. Model 1 investigates the impact of ICE, CEE, and the interaction of ICE and CEE on FP. In contrast, model 2 analyzes the effects of VAIC and the interaction of VAIC and PP&E on FP.
Table 6. The role of IPR reform in the relation between intellectual capital and firm performance
When we split the total sample according to the years of IPR reform, the empirical findings confirm that IPR reform plays the moderating role on the IC-FP association. We thus confirm that the positive and significant impacts at the 1% or 5% level of ICE-CEE interaction and VAIC-PP&E interaction on ROA and ROE after the IPR reform year. In contrast, the regression results report the significant negative effects on FP as measured by ROE in the years before the year of actual reform. For ROA, there is no difference of ICE-CEE interaction among two periods, ex- and post-IPR reform. VAIC in model 2 and CEE in model 1 has positive impact on FP before and after IPR reform.
For the other control variables, there are the significant negative impacts of firm age, leverage, and PP&E on FP for both two proxy measures, ROA and ROE. In addition, we find a significant positive effect of firm size on FP. The results are also consistent when FP is proxied by ROE.
5. Conclusion
In pursuing competitiveness in the knowledge era, nations and enterprises entirely rely on IC as evidenced by economic theories and an increasing number of empirical papers that affirm the positive and statistically significant relationship between IC and FP. This study employed panel data on non-financial firms listed in ASEAN stock markets to test the contribution of IC, its elements, and the interactions of elements with FP in the presence of IPR reform as the moderator variable.
It contributes to the IC literature by extending the modified VAIC model by Nimtrakoon (Citation2015) and Bayraktaroglu et al. (Citation2019). We contribute to the proxy measurement for IC by combining the RCE—the fourth component of the VAIC model developed by Nimtrakoon (Citation2015), with VA estimation modified by Bayraktaroglu et al. (Citation2019). We also examine the moderating role of IPR reform on the IC–FP relationship.
Besides proposing an extended VAIC model, we contribute to the existing empirical results by providing insights into the IC–FP relationship in some ASEAN countries. The results are consistent with the theories and other empirical studies. However, our study has two unique findings: (1) HC was found to be the leading element because it exerts direct and indirect influences on FP; and (2) IPR reform determines both significance and the strength of the relationship between IC and FP. Accordingly, the study carries important implications for decision makers in private and public sectors.
First, business strategists, especially of enterprises operating in knowledge-intensive industries, will surely consider the state of IPR as the first criterion when selecting destinations/markets in which to make investments. Developed laws of intellectual property are efficient in averting infringement of intellectual property rights (e.g., copyrights, patents, trademarks, industrial designs, and trade secrets), thus entitle firms—the owner of inventions—to financial benefit and competitive advantage sources largely intact. Second, it is strongly advised that governments acknowledge the importance of IPR if they crave business environments favorable to creativity and innovation. Upon successful enforcement of the law, the nations or regions are endowed with competitiveness to attract investment as well as accumulate IC for the purpose of transforming to the highest economic development stage—the innovation-driven stage.
The limitation of this study also points to a future research opportunity. Previous empirical studies (e.g., Alipour Citation2012; Hejazi et al., Citation2016; Nimtrakoon, Citation2015; Smriti & Das, Citation2018) revealed that HC is the key component in the VAIC model. This study employed the conventional approach of measuring HC in the VAIC model. However, we argue that total employee expenditures do not completely reflect HC because of the difference between cost and value. Hence, future studies might explore and develop the model to measure HC.
Acknowledgements
We sincerely appreciate the editors and the two anonymous reviewers who reviewed our manuscript for their helpful comments. We are grateful to Professor John Dumay for the excellent suggestions in a deep discussion at the Macquarie University. We also thank the conference participants at the 16th International Conference on Intellectual Capital, Knowledge Management and Organisational Learning (ICICKM 2019) hosted in Australia in 2019 and the International SOB Conference hosted in Vietnam in 2020. Any errors or omissions are solely our responsibility. This research was funded by the University of Economics Ho Chi Minh City (UEH), Vietnam.
Disclosure statement
No potential conflict of interest was reported by the authors.
Additional information
Funding
Notes on contributors
Minh H. Do
Minh H. Do is currently a lecturer in business strategy at the Department of Planning, Investment, and Development; School of Economics; University of Economics Ho Chi Minh City (UEH). He holds an M.A. in development economics. His research interests include entrepreneurship, knowledge management, and economic growth.
Vo Thanh Tam
Vo Thanh Tam is currently a vice head of the Department of Human Resource Management, School of Economics, UEH. He holds an M.Sc. in Public Policy from the Fulbright Economics Teaching Program and a B.A. in Human Resource Management. His research interests are public policy, demography and development, development economics, and human capital.

Nguyen Kim-Duc
Nguyen Kim-Duc is currently a Director at the Centre for Economics, Law, and Governance and a lecturer at the Department of Valuation, UEH. He is also a valuer licensed by the Ministry of Finance and a professional advisor to many valuation firms in Vietnam. He holds an M.Sc. degree in Finance and two separate B.A. degrees in Audit and Valuation. His main research interests include valuations of businesses and intangible assets, asset pricing, and business valuation modeling.
References
- Alimov, A. (2019). Intellectual property rights reform and the cost of corporate debt. Journal of International Money and Finance, 91, 195–19. https://doi.org/10.1016/j.jimonfin.2018.12.004
- Alipour, M. (2012). The effect of intellectual capital on firm performance: An investigation of Iran insurance companies. Measuring Business Excellence, 16(1), 53–66. https://doi.org/10.1108/13683041211204671
- Arrow, K. J. (1962). Economic welfare and the allocation of resources for invention. National Bureau of Economical Research, 561, 609–626. https://doi.org/10.1521/ijgp.2006.56.2.191
- Barney, J. (1991). Firm resources and sustained competitive advantage. Journal of Management, 17(1), 99–120. https://doi.org/10.1177/014920639101700108
- Basil, A., & Khaled, H. (2011). Revisiting the capital‐structure puzzle: UK evidence. The Journal of Risk Finance, 12(4), 329–338. https://doi.org/10.1108/15265941111158505
- Bayraktaroglu, A. E., Calisir, F., & Baskak, M. (2019). Intellectual capital and firm performance: An extended VAIC model. Journal of Intellectual Capital, 20(3), 406–425. https://doi.org/10.1108/JIC-12-2017-0184
- Bilir, L. K. (2014). Patent laws, product life-cycle lengths, and multinational activity. American Economic Review, 104(7), 1979–2013. https://doi.org/10.1257/aer.104.7.1979
- Bollen, L., Vergauwen, P., & Schnieders, S. (2005). Linking intellectual capital and intellectual property to company performance. Management Decision, 43(9), 1161–1185. https://doi.org/10.1108/00251740510626254
- Bontis, N., Chua Chong Keow, W., & Richardson, S. (2000). Intellectual capital and business performance in Malaysian industries. Journal of Intellectual Capital, 1(1), 85–100. https://doi.org/10.1108/14691930010324188
- Branstetter, L., Fisman, R., Foley, C. F., & Saggi, K. (2011). Does intellectual property rights reform spur industrial development? Journal of International Economics, 83(1), 27–36. https://doi.org/10.1016/j.jinteco.2010.09.001
- Branstetter, L. (2017). Intellectual property rights, innovation and development: Is Asia different? Millennial Asia, 8(1), 5–25. https://doi.org/10.1177/0976399616686860
- Campbell, B. A., Coff, R., & Kryscynski, D. (2012). Rethinking sustained competitive advantage from human capital. Academy of Management Review, 37(3), 376–395. https://doi.org/10.5465/amr.2010.0276
- Chadwick, C. (2017). Toward a more comprehensive model of firms’ human capital rents. Academy of Management Review, 42(3), 499–519. https://doi.org/10.5465/amr.2013.0385
- Clarke, M., Seng, D., & Whiting, R. H. (2011). Intellectual capital and firm performance in Australia. Journal of Intellectual Capital, 12(4), 505–530. https://doi.org/10.1108/14691931111181706
- Cohen, S., & Kaimenakis, N. (2007). Intellectual capital and corporate performance in knowledge‐intensive SMEs. The Learning Organization, 14(3), 241–262. https://doi.org/10.1108/09696470710739417
- Connelly, J. T., Limpaphayom, P., & Nagarajan, N. J. (2012). Form versus substance: The effect of ownership structure and corporate governance on firm value in Thailand. Journal of Banking and Finance, 36(6), 1722–1743. https://doi.org/10.1016/j.jbankfin.2012.01.017
- Conner, K. R., & Prahalad, C. K. (1996). A resource-based theory of the firm: Knowledge versus opportunism. Organization Science, 7(5), 477–501. https://doi.org/10.1287/orsc.7.5.477
- Damodaran, A. (2012). Investment valuation: Tools and techniques for determining the value of any asset (3rd ed.). John Wiley & Sons, Inc.
- de Villemeur, E.B., Ruble, R., & Versaevel, B. (2019). Dynamic competition and intellectual property rights in a model of product development. Journal of Economic Dynamics and Control, 100, 270–296. https://doi.org/10.1016/J.JEDC.2018.11.009
- Dhaliwal, D. S., Erickson, M. J., Goldman, N. C., & Krull, L. K. (2015). Do foreign cash holdings influence the cost of debt? Proceedings. Annual Conference on Taxation and Minutes of the Annual Meeting of the National Tax Association, 108, 1–56. https://www.jstor.org/stable/90023204
- Edvinsson, L., & Sullivan, P. (1996). Developing a model for managing intellectual capital. European Management Journal, 14(4), 356–364. https://doi.org/10.1016/0263-2373(96)00022-9
- Edvinsson, L. (1997). Developing intellectual capital at Skandia. Long Range Planning, 30(3), 366–373. https://doi.org/10.1016/S0024-6301(97)90248-X90248-X
- Fama, E. F., & French, K. R. (1992). The cross-section of expected stock returns. The Journal of Finance, 47(2), 427–465. https://doi.org/10.1111/j.1540-6261.1992.tb04398.x
- Firer, S., & Mitchell Williams, S. (2003). Intellectual capital and traditional measures of corporate performance. Journal of Intellectual Capital, 4(3), 348–360. https://doi.org/10.1108/14691930310487806
- Galbraith, J. K. (1969). The consequences of technology. Journal of Accountancy, 127, 44–56. https://scholar.google.com/scholar_lookup?title=The%20consequences%20of%20technology&journal=Journal%20of%20Accountancy&volume=127&pages=44-56&publication_year=1969&author=Galbraith%2CJK
- Hai-Ly, T. T., & Kim-Duc, N. (2018). Corporate governance, pyramid ownership, and firm value: Evidence from Vietnam. Journal of Asian Business and Economic Studies, 25(1), 85–102. https://doi.org/10.24311/jabes/2018.25.S01.4
- Hejazi, R., Ghanbari, M., & Alipour, M. (2016). Intellectual, human and structural capital effects on firm performance as measured by Tobin’s Q. Knowledge and Process Management, 23(4), 259–273. https://doi.org/10.1002/kpm.1529
- Helpman, E. (1993). Innovation, imitation, and intellectual property rights. Econometrica, 61(6), 1247. https://doi.org/10.2307/2951642
- Hitt, M. A., Bierman, L., Shimizu, K., & Kochhar, R. (2001). Direct and moderating effects of human capital on strategy and performance in professional service firms: A resource-based perspective. Academy of Management Journal, 44(1), 13–28. https://doi.org/10.5465/3069334
- Javorcik, B. S. (2004). The composition of foreign direct investment and protection of intellectual property rights: Evidence from transition economies. European Economic Review, 48(1), 39–62. https://doi.org/10.1016/S0014-2921(02)00257-X
- Lev, B., & Sougiannis, T. (1996). The capitalization, amortization, and value-relevance of R&D. Journal of Accounting and Economics, 21(1), 107–138. https://doi.org/10.1016/0165-4101(95)00410-6
- Lin, Y., & Wu, L.-Y. (2014). Exploring the role of dynamic capabilities in firm performance under the resource-based view framework. Journal of Business Research, 67(3), 407–413. https://doi.org/10.1016/j.jbusres.2012.12.019
- Lozano, M. B., Martínez, B., & Pindado, J. (2016). Corporate governance, ownership and firm value: Drivers of ownership as a good corporate governance mechanism. International Business Review, 25(6), 1333–1343. https://doi.org/10.1016/j.ibusrev.2016.04.005
- Mbama, C. I., & Ezepue, P. O. (2018). Digital banking, customer experience and bank financial performance. International Journal of Bank Marketing, 36(2), 230–255. https://doi.org/10.1108/IJBM-11-2016-0181
- Nazari, J. A., Herremans, I. M., & Bontis, N. (2008). Extended VAIC model: Measuring intellectual capital components. Journal of Intellectual Capital, 8(4), 595–609. https://doi.org/10.1108/14691930710830774
- Nguyen, N. T. H., Kim-Duc, N., & Freiburghaus, T. L. (2021). Effect of digital banking-related customer experience on banks’ financial performance during Covid-19: A perspective from Vietnam”. Journal of Asia Business Studies, 16(1), 200–222. https://doi.org/10.1108/JABS-09-2020-0366
- Nimtrakoon, S. (2015). The relationship between intellectual capital, firms’ market value and financial performance: Empirical evidence from the ASEAN. Journal of Intellectual Capital, 16(3), 587–618. https://doi.org/10.1108/S0731-2199(2010)0000022004
- Ozkan, N., Cakan, S., & Kayacan, M. (2017). Intellectual capital and financial performance: A study of the Turkish banking sector. Borsa Istanbul Review, 17(3), 190–198. https://doi.org/10.1016/J.BIR.2016.03.001
- Peteraf, M. A. (1993). The cornerstones of competitive advantage: A resource-based view. Strategic Management Journal, 14(3), 179–191. https://doi.org/10.2307/2486921
- Petrash, G. (1996). Dow’s journey to a knowledge value management culture. European Management Journal, 14(4), 365–373. https://doi.org/10.1016/0263-2373(96)00023-0
- Porter, M. E. (1985). Competitive advantage: Creating and sustaining superior performance.
- Pulic, A. (1998). Measuring the performance of intellectual potential in knowledge economy.
- Pulic, A. (2000). VAICTM an accounting tool for IC management. International Journal of Technology Management, 20(5–8), 702–714. https://doi.org/10.1504/IJTM.2000.002891
- Riahi‐Belkaoui, A. (2003). Intellectual capital and firm performance of US multinational firms. Journal of Intellectual Capital, 4(2), 215–226. https://doi.org/10.1108/14691930310472839
- Riley, S. M., Michael, S. C., & Mahoney, J. T. (2017). Human capital matters: Market valuation of firm investments in training and the role of complementary assets. Strategic Management Journal, 38(9), 1895–1914. https://doi.org/10.1002/smj.2631
- Schwab, K. (2017). The global competitiveness report 2017-2018. In World Economic Forum. http://ci.nii.ac.jp/naid/110008131965/
- Smriti, N., & Das, N. (2018). The impact of intellectual capital on firm performance: A study of Indian firms listed in COSPI. Journal of Intellectual Capital, 19(5), 935–964. https://doi.org/10.1108/JIC-11-2017-0156
- Sydler, R., Haefliger, S., & Pruksa, R. (2014). Measuring intellectual capital with financial figures: Can we predict firm profitability? European Management Journal, 32(2), 244–259. https://doi.org/10.1016/J.EMJ.2013.01.008
- Teece, D. J. (2015). Intangible assets and a theory of heterogeneous firms. In Intangibles, market failure and innovation performance (pp. 217–239). Springer International Publishing. https://doi.org/10.1007/978-3-319-07533-4_9.
- Tseng, C.-Y., & James Goo, Y.-J. (2005). Intellectual capital and corporate value in an emerging economy: Empirical study of Taiwanese manufacturers. R and D Management, 35(2), 187–201. https://doi.org/10.1111/j.1467-9310.2005.00382.x
- Ulum, I., Ghozali, I., & Purwanto, A. (2014). Intellectual capital performance of Indonesian banking sector: A modified VAIC (M-VAIC) perspective. Asian Journal of Finance & Accounting, 6(2), 103. https://doi.org/10.5296/ajfa.v6i2.5246
- Vomberg, A., Homburg, C., & Bornemann, T. (2015). Talented people and strong brands: The contribution of human capital and brand equity to firm value. Strategic Management Journal, 36(13), 2122–2131. https://doi.org/10.1002/smj.2328
- Wakasugi, R., & Ito, B. (2009). The effects of stronger intellectual property rights on technology transfer: Evidence from Japanese firm-level data. The Journal of Technology Transfer, 34(2), 145–158. https://doi.org/10.1007/s10961-007-9073-8
- Wang, W., Chang, C., & Bontis, N. (2005). Intellectual capital and performance in causal models. Journal of Intellectual Capital, 6(2), 222–236. https://doi.org/10.1108/14691930510592816
- Wang, Z., Cai, S., Liang, H., Wang, N., & Xiang, E. (2018). Intellectual capital and firm performance: The mediating role of innovation speed and quality. The International Journal of Human Resource Management, 32(6), 1–29. https://doi.org/10.1080/09585192.2018.1511611
- Wernerfelt, B. (1984). A resource-based view of the firm. Strategic Management Journal, 5(2), 171–180. https://doi.org/10.1002/smj.4250050207
- Young, C.-S., Su, H.-Y., Fang, S.-C., & Fang, S.-R. (2009). Cross-country comparison of intellectual capital performance of commercial banks in Asian economies. The Service Industries Journal, 29(11), 1565–1579. https://doi.org/10.1080/02642060902793284
- Zéghal, D., & Maaloul, A. (2010). Analysing value added as an indicator of intellectual capital and its consequences on company performance. Journal of Intellectual Capital, 11(1), 39–60. https://doi.org/10.1108/14691931011013325