
 ?Mathematical formulae have been encoded as MathML and are displayed in this HTML version using MathJax in order to improve their display. Uncheck the box to turn MathJax off. This feature requires Javascript. Click on a formula to zoom.
Abstract
In this paper, the generalised autoregressive heteroskedasticity (GARCH) model is applied to the pricing of collateralised options in the South African equity market. Symmetric GARCH and nonlinear asymmetric GARCH (AGARCH) models are considered. The models are used to price fully collateralised and zero collateral options (European, Asian, and lookback options). The effect of collateral is illustrated by the difference between zero collateral and fully collateralised option price surfaces. Finally, the effect of asymmetry is shown by the difference between the symmetric and asymmetric GARCH option price surfaces.
PUBLIC INTEREST STATEMENT
The Global Financial Crisis has been a turning point for financial markets. The previous market standard for the pricing of financial derivatives does not account for all factors that are important in the current market. An important factor that needs to be considered in markets today is collateral. By making use of a modern pricing framework, we illustrate the effect of collateral and asymmetry on both vanilla and exotic options in a South African market context.
1. Introduction
The Global Financial Crisis (GFC) of 2008 was a turning point for financial markets, especially for financial modelling and risk management of contingent claims. These claims, such as financial options (contingent claims), were typically valued in the Black-Scholes-Merton framework (Black et al., Citation1973). Common modelling assumptions within this modelling paradigm are the existence of constant unique risk-free interest rate, constant volatility, normally distributed asset returns, and no transaction costs (Black et al., Citation1973). Previously, the pricing of derivative instruments was not as complicated.
An important factor that needs to be considered after the GFC is the effect of funding, which, in essence, imposes constraints on the balance sheet of the financial intermediating entity. This has forced financial modelling researchers and practitioners to develop a new pricing framework. Piterbarg (Citation2010) extended the Black-Scholes framework by relaxing the assumption of a unique risk-free rate. The purpose of the model derived by Piterbarg (Citation2010) is the pricing of derivatives in the presence of collateral. Three different rates are required when pricing derivatives in this framework: the repurchase agreement rate, the collateral rate, and the funding rate.
As mentioned, we frequently assume that volatility is constant over the life of an option. This is not a reasonable assumption either. Duan (Citation1995) made use of an econometric approach applied to option pricing, in which volatility follows a generalised autoregressive heteroskedasticity (GARCH) process. However, collateral is not considered in the Duan (Citation1995) framework. Therefore, this work was recently extended by Labuschagne and Von Boetticher (Citation2017) to account for collateral.
The main contribution of this paper is that the GARCH option pricing model (in the presence of collateral) derived by Labuschagne and Von Boetticher (Citation2017) is extended to two different models, namely the symmetric GARCH(1,1) model and the non-linear asymmetric GARCH (AGARCH) model. This is done to illustrate the effect of asymmetry when pricing collateralised options in the GARCH option pricing framework. In addition, this work is also extended to exotic options (Labuschagne & Von Boetticher, Citation2017 considered vanilla options only). The purpose of our analysis is to demonstrate pricing effects of contingent claims in the presence of balance sheet constraints, and use a stochastic volatility model to relax volatility assumptions. The remainder of this paper is structured as follows: Section 2 focuses on recent and relevant literature. The methodology is considered in Section 3, Section 4 reports the empirical results, and concluding remarks are made in Section 5.
2. Literature review
The application of GARCH models to option pricing is well documented in the literature. In a recent study, Oberholzer and Venter (Citation2019) made use of the Heston-Nandi model to approximate option price surfaces for the CIVETS (Colombia, Indonesia, Vietnam, Egypt, Turkey and South Africa) countries’ equity indices. Their empirical results indicate that the option price surfaces obtained from the model are consistent with those usually found in the market. However, the options considered do not incorporate collateral agreements. Furthermore, only vanilla options were considered.
Christoffersen and Jacobs (Citation2004) compared a wide range of different GARCH models for option valuation market traded option prices. Their results showed that market option-based objective functions and models that allow for a standard leverage effect produce the most parsimonious GARCH option pricing model. However, the estimation of these models were done in the Black-Scholes framework which does not account for collateral. As mentioned previously, collateral agreements have become very important after the GFC. Therefore, a more modern pricing framework (Piterbarg, Citation2010) is considered in this paper.
In a similar study, Hsieh and Ritchken (Citation2005) compared the Heston-Nandi model to the AGARCH option pricing model by Duan (Citation1995). The accuracy of the models was tested by comparing the model option prices to actual market option prices on the Standard and Poor’s 500 index. Their results indicated that the AGARCH model is superior to the Heston-Nandi model, and should be considered by traders and risk managers. Similar to Christoffersen and Jacobs (Citation2004), this study was performed before the GFC. Hence, collateral was not considered.
In a recent paper, Levendis and Venter (Citation2019) made use of local volatility in the Piterbarg framework to price collateralised Asian options. Local volatility assumes that volatility is a deterministic function of the spot price and time. Levendis and Venter (Citation2019) explain that no closed-form solution exists for an arithmetic Asian option in the Piterbarg framework. Therefore, Monte Carlo simulation was used. Their empirical results indicate that the presence of collateral has a greater effect on in-the-money options (i.e., more expensive). The calibration of local volatility requires an implied volatility surface which is not always available in emerging markets (GARCH models can be calibrated to historical data). Assuming that volatility is a deterministic function of the spot price and time is a better assumption than constant volatility. However, this does not capture the stochastic nature of volatility. Therefore, GARCH models are applied in this study.
In an attempt to determine which GARCH option pricing model is superior when modelling the GARCH implied South African Volatility index (SAVI), Venter and Maré applied symmetric GARCH, Glosten, Jagganathan, and Runkle (GJR) GARCH, and asymmetric GARCH (AGARCH) models in a South African equity context. Venter and Maré considered three different likelihood functions (historical data, historical SAVI, and a joint likelihood function based on both historical returns and SAVI). Their empirical results indicate that the asymmetric models outperform the symmetric GARCH model. However, exotic options and the effect of collateral in a South African equity context were not considered.
Labuschagne and Von Boetticher (Citation2017) extended the GARCH option pricing model by Duan (Citation1995) to incorporate collateral in the Piterbarg (Citation2010) framework. The GJR-GARCH and exponential GARCH (EGARCH) models were considered. Their empirical results showed that both the GJR-GARCH and exponential GARCH models produce the characteristic volatility skew that can be observed in the markets. These two models are among the most popular GARCH models applied in financial modelling research. The estimation of the EGARCH models has been a controversial topic in recent years. According to McAleer and Hafner (Citation2014), the statistical properties of the maximum likelihood estimator of the EGARCH model are not available under general conditions, but rather only for special cases (restrictive and unverifiable). In addition, McAleer and Hafner (2014a) show that neither the GJR-GARCH, nor the EGARCH models are capable of capturing the leverage effect.
Given the shortcomings of the GJR-GARCH and EGARCH models, the symmetric GARCH and AGARCH (can capture leverage) are applied in this study. These models are used to illustrate the effect of asymmetry in a South African equity context when collateralised options are considered. Labuschagne and Von Boetticher (Citation2017) did not consider collateralised exotic options in a GARCH option pricing framework. In addition, Labuschagne and Von Boetticher (Citation2017) estimated volatility skews only, we extend the analysis to volatility surfaces (take the effect of maturity into account). These are other important gap that are addressed in this paper.
3. Methodology
In this paper, the GARCH option pricing model is used to price collateralised options on the FTSE/JSE Top40 Index (Top40). We use closing spot levels of the Top40 from 1 January 2010 to 31 October 2019 to fit the parameters. The remainder of this section is divided into two subsections, the first focuses on the Piterbarg (Citation2010) framework and the second focuses on the GARCH option pricing model.
3.1. The piterbarg framework
As mentioned previously, the Piterbarg (Citation2010) model extends the Black-Scholes framework to incorporate three different interest rates: the collateral rate (), the repurchase agreement rate (
), and the funding rate (
) In general, the following inequality holds,
The prices of fully collateralised () and zero collateral (
) European call options in the Piterbarg framework are given by,
respectively. Here is the price of the underlying asset at time
is the strike price,
is the time to expiry (from time
), and
denotes the cumulative normal distribution function. Finally,
and
are given by,
where is the implied volatility. The GARCH option pricing model is considered in the next subsection.
3.2. GARCH Option pricing
Labuschagne and Von Boetticher (Citation2017) make the following assumption regarding the dynamics of the underlying asset under the real-world measure ,
where
is some GARCH process, and
is the unit risk premium. In this paper, the conditional variance is assumed to be driven by a GARCH(1,1) and an AGARCH(1,1) process, respectively. According to Alexander (Citation2008), the dynamics of the GARCH(1,1) and AGARCH(1,1) models are given by,
respectively, under the real-world measure The parameters
and
are determined using maximum-likelihood estimation. From the equations above, it is clear that positive and negative shocks have the same effect on the rise in volatility when the GARCH(1,1) model is used to model volatility. The AGARCH(1,1) model does take asymmetry into account. The Akaike (AIC) and Schwarz information criteria (SIC) are used to compare the goodness-of-fit of the models.
Glasserman (Citation2013) explains that the price of an option is the expectation of the numeraire denominated payoff, under the risk-neutral measure. Labuschagne and Von Boetticher (Citation2017) show that the dynamics of the underlying asset under the risk-neutral measure are given by,
where The risk-neutral dynamics of the GARCH(1,1) and AGARCH(1,1) models are given by,
respectively. Hence, the parameters are estimated under the real-world measure However, the risk-neutral dynamics are used for pricing.
In this study, the GARCH model parameters are estimated using the maximum-likelihood method based on historical returns data (implied volatility is not required). Furthermore, Monte Carlo simulation (50,000 simulations) is used to approximate option price surfaces. Hence, different realisations of EquationEquation 2(2)
(2) are simulated to obtain the expectation of the discounted payoff of an option.
Both vanilla and exotic (Asian and lookback) options are considered in this study. The payoff of a (vanilla) European call option is given by,
where is the price of the underlying at the expiry date
and
is the strike price. The payoff of an Asian call option is given by,
where is the number of averaging periods. In this study, daily averaging throughout the life of the option is assumed. The payoff of a (fixed) lookback call option is,
where is the maximum underlying asset price achieved during the life of the option. The empirical results are reported in the next section.
4. Empirical results
This section is divided into two subsections. The first subsection considers the preliminary data analysis in which the statistical properties of the Top40 are illustrated. The second subsection focuses on the approximated GARCH option price surfaces, which illustrate the effect of collateral and asymmetry.
4.1. Preliminary data analysis
In this subsection, the statistical properties of the Top40 are illustrated and compared to the stylised facts of financial time series (see, e.g., Danielsson, Citation2011; Cont, Citation2001; McNeil et al., Citation2015). The level of the Top40 over the estimation period is plotted below:
Figure 1. Line Graph: Top40 Index Level.
As expected, the spot level of the Top40 plotted in seems trended over time. As shown in EquationEquation 1(1)
(1) , the GARCH model parameters are estimated using logarithmic returns. The Top40 returns are plotted in Figure below:
Figure 2. Line Graph: Top40 Returns.
The logarithmic returns seem to show signs of volatility clustering. This is consistent with the stylised facts of financial returns (Danielsson, Citation2011).
The descriptive statistics are reported in Table below:
Table 1. Descriptive Statistics: Top40 Returns
the Jarque-Bera statistic indicates that the Top40 Returns are not normally distributed. Furthermore, The descriptive statistics confirm expectations of leptokurtosis. Finally, the mean is very close to zero, this is consistent with the stylised facts of financial time series. The option price surfaces are considered in the next subsection.
4.2. GARCH Option pricing
In this subsection, the GARCH option price surfaces are plotted and compared. Both European call options and Asian call options are considered. For the estimation of parameters, is assumed to be consistent with the 91 day treasury bill rate (6.67%). In addition, we assume that
and
The GARCH model parameters are reported in Table below:
Table 2. GARCH Model Parameters
The GARCH model parameters in the table above are used to approximate the option price surfaces that follow. The asymmetry term () of the AGARCH(1,1) model is positive and statistically significant. This is usually the case when applying the AGARCH model to equity returns (Alexander, Citation2008).
In this study, both vanilla and exotic call option price surfaces are considered. The GARCH(1,1) (vanilla) European call option price surfaces are plotted in Figure below. Both the full collateral and zero collateral surfaces are plotted. In addition, the differences between the zero and full collateral surfaces are also plotted to show the effect of collateral. All price surfaces and differences are expressed as a percentage of the initial spot price.
Figure 3. GARCH(1,1) European call option price surfaces.
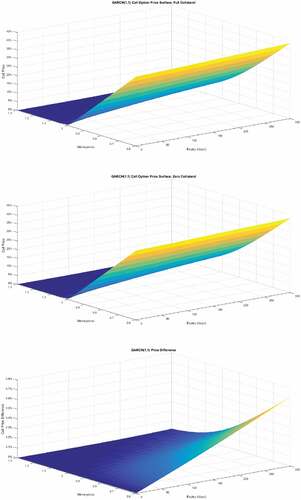
Similar option price surfaces were obtained when using the AGARCH(1,1) model. The difference in the full collateral and zero collateral surfaces increases as the option price increases. The call option is more in the money and over longer expires. This is consistent with Levendis and Venter (Citation2019).
The difference between the GARCH(1,1) and AGARCH(1,1) surfaces are plotted in Figure below to illustrate the effect of asymmetry. Similar results were obtained for full collateral and zero collateral, therefore only the difference between the full collateral surfaces is considered.
Figure 4. European option price differences.
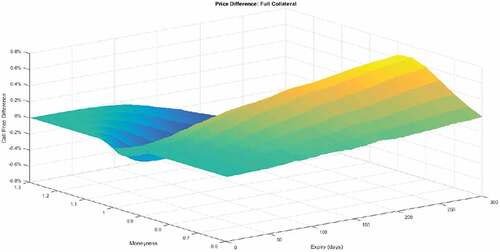
Small differences are obtained when the GARCH(1,1) and AGARCH(1,1) option prices are compared. However, the difference in prices tends to increase as the time to expiry increases. This is consistent with expectations because the probability of negative shocks is greater over a longer period of time (more uncertainty).
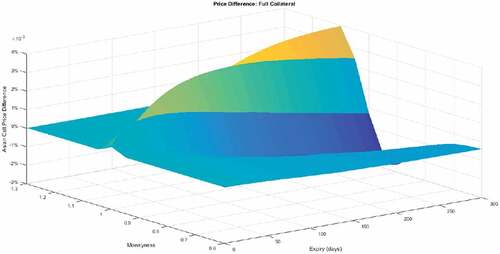
Collateral has a similar effect on the Asian call option price surface. However, to illustrate the effect of asymmetry on Asian options, the difference between the AGARCH(1,1) Asian call option price surface and the GARCH(1,1) full collateral Asian call option price surface is plotted below.
The difference between the AGARCH(1,1) and GARCH(1,1) Asian call option price surfaces in Figure illustrates that asymmetry is not as significant when pricing Asian options in the collateralised GARCH option pricing framework. This is consistent with expectations, because the averaging feature of Asian options reduces the volatility inherent in the options (see, e.g., Jeon et al., Citation2016). This also explains why Asian options are generally cheaper than European options.
Figure 5. Asian option price differences.
The difference between the full and zero collateral price of the lookback call option price surface is illustrated in Figure below.
Figure 6. Effect of collateral (lookback option).
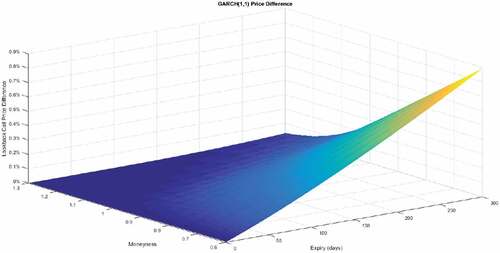
Collateral clearly has a greater impact on the lookback option (when compared to the vanilla option price difference). This is intuitive, as the price of a lookback call option is always greater than, or equal to, the price of a vanilla call option (greater option price implies greater collateral). The difference between the AGARCH(1,1) and GARCH(1,1) price surfaces of fully collateralised lookback options is plotted in Figure below:
Figure 7. Lookback option price differences.
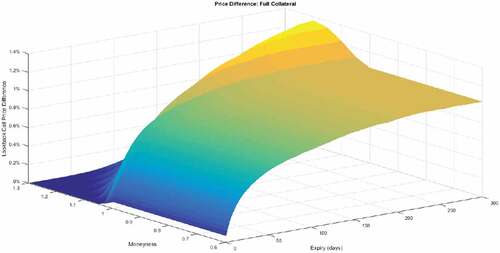
Asymmetry clearly also has a greater effect on the price of a lookback option.
The empirical results show that asymmetry and collateral have different effects on exotic and vanilla options. As the option price increases, the amount of collateral increases. When dealing with an Asian option (generally cheaper than a vanialla option), less collateral is required. Furthermore, asymmetry is also less significant. Therefore, it will be less computationally expensive to price Asian options using a symmetric model. When it comes to lookback options, both asymmetry and collateral are more significant when compared to the vanilla option. Hence, it is important to use a model that accounts for asymmetry when pricing lookback options.
5. Conclusion
In this paper, the work by Labuschagne and Von Boetticher (Citation2017) is extended to two different models, the symmetric GARCH(1,1) and the asymmetric AGARCH(1,1) model to price European options on the Top40 in the presence of collateral. The preliminary data analysis showed that the statistical properties of the Top40 are consistent with the stylised facts of financial time series.
Full collateral and zero collateral option price surfaces were approximated using the GARCH(1,1) and AGARCH(1,1) option pricing models. The difference between the full collateral and zero collateral surfaces indicates that the effect of collateral increases as the option price increases, this is consistent with previous findings in the literature. The difference between the GARCH(1,1) and AGARCH(1,1) surfaces indicated that asymmetry has a greater effect on the option price as the expiry increases. This is in line with expectations as there is greater probability for negative shocks as the time to expiry increases.
In order to illustrate the effect of collateral and asymmetry on options with exotic features, a similar analysis was performed using Asian and lookback option price surfaces. Collateral has a similar effect on the Asian option price surface. Furthermore the difference between the collateralised GARCH(1,1) and AGARCH(1,1) Asian option price surfaces indicates that asymmetry is not as important when pricing collateralised Asian options on the Top40. Hence, it will be more efficient to price collateralised Asian options using the GARCH(1,1) model. However, this is not the case for lookback options on the Top40. It is important to take asymmetry into account when pricing lookback options.
Interest rates in South Africa are fairly high, which implies greater differences between collateral and funding rates. Lower spreads are expected in developed markets with lower interest rates. Therefore, an important area for future research is the comparison of collateralised option pricing in other developed and emerging markets. Other areas for future research include different error distribution assumptions that incorporate skewness and kurtosis. In addition, the hedging performance of the GARCH option pricing models should be tested when applied to collateralised options. Furthermore, the application of the collateralised GARCH option pricing model should also be applied to single stocks in the South African market. Finally, the hedging performance of the collateralised GARCH option pricing model should also be tested when applied in a South African equity context.
Disclosure statement
No potential conflict of interest was reported by the author(s).
Additional information
Funding
Notes on contributors

Pierre J Venter
Pierre J Venter currently works in industry as a quantitative analyst. He is busy with a PhD in Actuarial Science at the University of Pretoria. He is also appointed as a research associate at the Department of Finance and Investment Management, University of Johannesburg. His research interests include quantitative finance and financial econometrics.
Alexis Levendis
Alexis Levendis currently works in industry as a quantitative analyst. He is busy with a PhD in Actuarial Science at the University of Pretoria. He is also appointed as a research associate at the Department of Finance and Investment Management, University of Johannesburg. His research interests include quantitative finance and numerical methods.
Eben Mare
Eben Mare has worked as a portfolio manager in the asset management industry for the last 25 years. He holds a PhD in Applied Mathematics and holds a position as Associate Professor in the Department of Mathematics and Applied Mathematics at the University of Pretoria, South Africa. His research interests are in the financial markets and mathematical modelling.
References
- Alexander, C. (2008). Market risk analysis, practical financial econometrics. John Wiley & Sons.
- Black, B. S., Scholes, F. M., & Scholes, M. (1973). The pricing of options and corporate liabilities. Journal of Political Economy, 81(3), 637–12. https://doi.org/10.1086/260062
- Christoffersen, P., & Jacobs, K. (2004). Which GARCH model for option valuation management science, 50 (9), 1204–1221. http://www.jstor.org/stable/30046228
- Cont, R. (2001). Empirical properties of asset returns: Stylized facts and statistical issues. Quantitative Finance, 1(2), 223–236. https://doi.org/10.1080/713665670
- Danielsson, J. (2011). Financial risk forecasting: The theory and practice of forecasting market risk with implementation in R and Matlab. John Wiley & Sons.
- Duan, J. C. (1995). The GARCH option pricing model. Mathematical Finance, 5(1), 13–32. https://doi.org/10.1111/j.1467-9965.1995.tb00099.x
- Glasserman, P. (2013). Monte Carlo methods in financial engineering. Springer Science & Business Media.
- Hsieh, K. C., & Ritchken, P. (2005). An empirical comparison of GARCH option pricing models. Review of Derivatives Research, 8(3), 129–150. https://doi.org/10.1007/s11147-006-9001-3
- Jeon, J., Yoon, J. H., & Kang, M. (2016). Valuing vulnerable geometric Asian options. Computers & Mathematics with Applications, 71(2), 676–691. https://doi.org/10.1016/j.camwa.2015.12.038
- Labuschagne, C. C., & Von Boetticher, S. T. (2017, January). The GJR-GARCH and EGARCH option pricing models which incorporate the Piterbarg methodology. In 2017 International Conference on Economics, Finance and Statistics (ICEFS 2017). Atlantis Press.
- Levendis, A., & Venter, P. (2019). Implementation of local volatility in Piterbarg’s framework. In International Conference on Applied Economics (pp. 507–521). Springer, Cham.
- McAleer, M., & Hafner, C. M. (2014). A one line derivation of EGARCH. Econometrics, 2(2), 92–97. https://doi.org/10.3390/econometrics2020092
- McNeil, A. J., Frey, R., & Embrechts, P. (2015). Quantitative risk management: Concepts, techniques and tools-revised edition. Princeton university press.
- Oberholzer, N., & Venter, P. J. (2019). Heston Nandi Option Pricing Model Applied to the CIVETS indices. In International Conference on Applied Economics (pp. 593-603). Springer.
- Piterbarg, V. (2010). Funding beyond discounting: Collateral agreements and derivatives pricing. Risk, 23(2), 97. https://www.risk.net/derivatives/1589992/funding-beyond-discounting-collateral-agreements-and-derivatives-pricing
