
 ?Mathematical formulae have been encoded as MathML and are displayed in this HTML version using MathJax in order to improve their display. Uncheck the box to turn MathJax off. This feature requires Javascript. Click on a formula to zoom.
Abstract
This study estimates a Panel Vector Autoregressive (PVAR) approach to analyse the impact of fiscal policy and public debt on economic growth in Southern African Developing Communities (SADC). The study further estimated the fixed effects (FE) and random effects (RE) to verify the robustness of empirical findings. The results provide rigorous empirical evidence of a positive response of GDP growth due to shocks in government expenditure, employment, and public debt while gross capital formation exerts a negative effect on economic growth. The study proposes that fiscal authorities ought to focus on the adoption of prudent fiscal policies as a credible stabilization tool at the disposal of policymakers to safeguard stable and yet productive public finances consistent with sustainable economic prosperity. These may include addressing infrastructural development, soaring fiscal deficit, creation of jobs, and creating a conducive environment for both labour and capital-intensive projects to flourish in the SADC economies.
PUBLIC INTEREST STATEMENT
Over the recent years, SADC members have recorded a soaring fiscal deficit with sluggish economic growth rate. Such trends remain a major economic concern for these developing economies. This economic condition has been worsening over the last decade due to structural economic issues which contribute to slow economic growth and accumulating sovereign debt. The primary purpose of this study is to empirically analyse the impact of fiscal policy and public debt on economic growth in Southern African Developing Communities. A Panel Vector Autoregressive (PVAR) approach was employed in the study allows us to investigate interrelationships between fiscal policy instruments and economic growth in SADC. The results of the study revealed a positive response to GDP growth due to innovative shocks in fiscal policy adjustments such as government expenditure, public debt, and employment. The findings of this research ought to be valuable to fiscal authorities among SADC members for economic policy analysis.
1. Introduction
Several classical economic theories advocate that the primary objective of any government is to maintain and safeguard a balanced national budget through sustainable fiscal framework. Fiscal authorities ordinarily use fiscal policy instruments in conjunction with monetary interventions to address specific macroeconomic objectives. This policy is a key macroeconomic stabilisation tool at the disposal of the government to monitor and influence economic activities through its control over public finances (Rena & Kefela, Citation2011). Fiscal policy is the most important component of the government’s socio-economic policy, and its significance unfolds in an attempt to address crucial macroeconomic objectives such as creating employment, improving the standard of living, equitable distribution of income, and promoting sustainable economic growth.
This paper intends to establish the impact of fiscal policy and public debt on economic growth in SADC economies. An empirical investigation of the relationship under examination remains crucial in order to inform SADC-specific policymaking decisions, and further assist SADC members in better understanding the macroeconomic effects of fiscal policy to address their specific socio-economic objectives. This study contributes to the scientific literature through the application of advanced panel data techniques to provide SADC-specific policy analysis in which previous studies on this relationship have been confined to advanced economies.
The study estimated a PVAR approach to establish the impact of fiscal policy on economic growth among 13 SADC members, namely, Angola, Botswana, Congo (DRC), Eswatini, Lesotho, Malawi, Mauritius, Mozambique, Namibia, South Africa, Seychelles, Zambia, and Zimbabwe, over the period 2000–2018. Notwithstanding numerous empirical inquiries carried out in advanced economies on the role of fiscal policy on economic growth, the impact of fiscal policy and debt indebtedness has received limited scholarly attention in the context of developing economies. The primary objective of this study is to provide rigorous SADC-specific empirical evidence on interrelationships between fiscal policy, public indebtedness, and growth of the SADC economy. The study proceeds as follows: Section 2 provides the review of empirical studies conducted on the subject matter, section 3 outlines the research methodology employed in the study, section 4 gives analysis and interpretation of the results, and section 5 provides conclusions and policy recommendations.
2. Review of empirical literature
Several studies on the nexus between fiscal policy and economic growth have predominantly been confined to advanced economies; however, such previous studies have reported mixed and to a certain extent contradictory findings from one study to another. A study by Ocran (Citation2011) scrutinised the role of fiscal policy instruments which include government expenditure, tax revenues, gross fixed capital formation, budget deficit, and economic growth in South Africa. The study estimated a VAR using quarterly data from 1990 to 2004. The study discovered that government spending and gross fixed capital formation had a significant positive influence on economic growth. Moreover, the positive shocks to tax receipts were found to have a positive effect on growth while the size of the budget deficit had an insignificant effect on growth outcomes. Ogbole et al. (Citation2011) studied the role of fiscal policy on economic growth in Nigeria from 1970 to 2006. The findings revealed that there is a difference in the effectiveness of fiscal policy in promoting growth during and after a regulation period. The study suggested that the government should prioritise establishing an appropriate policy mix, prudent public spending, and setting achievable fiscal policy targets.
A paper by Afonso and Sousa (Citation2011) investigated the macroeconomic effects of fiscal policy in Portugal using a Bayesian VAR. They found that government expenditure has a negative effect on real GDP and further leads to crowding-out effects on private investment. Moreover, there was a persistent positive impact of government spending on prices while there were mixed effects on the average financing cost of government debt. Another study carried out by Taylor et al. (Citation2011) estimated a VAR to assess fiscal deficits, government debt, and economic growth in the USA using quarterly data from 1961 to 2011. The results indicated that there is a strong positive impact of a higher primary deficit on growth, even when possible increases in interest rate are taken into account. The study suggested that in order to achieve a fiscal position with a low fiscal deficit and high economic growth, the federal government should focus on improving economic activity through a fiscal policy mechanism. This can be achieved by raising public spending, which would then accelerate economic growth, and subsequently increase the tax revenue base.
Fry’McKibbin and Zheng (Citation2012) estimated a Factor Augmented Vector Autoregression (FAVAR) model to examine the role of monetary and fiscal policy shocks on the US macroeconomic fluctuations. The identification issue was addressed through sign restriction methodology in line with Fry and Pagan (2007) and Dungey and Fry (Citation2009). The study found that the impact of the government expenditure on output is substantial and explains more variability in macroeconomic variables compared to monetary policy shocks. The results also showed that an increase in government spending crowd out private activities, and further lead to an overall decline in output.
A study by Ghosh et al. (Citation2013) examined fiscal fatigue, fiscal space, and debt sustainability in 23 advanced economies, over the period 1970–2007. The study found strong empirical support for fiscal fatigue and that the marginal response of the primary balance to lagged debt is nonlinear, remaining positive at moderate debt level but starting to decline when debt reaches around 90–100% of GDP and becomes negative as the debt approaches about 150% of GDP. A paper by Oyeleke and Adebisi (Citation2014) assessed fiscal policy sustainability in Ghana from 1980 to 2010 using error correction mechanism. The results showed a long-run relationship between variables that indicate fiscal sustainability, albeit weak, which suggests that the country may not qualify for membership in the West African Monetary Zone. Moreover, the findings indicated that only 29% of long-run disequilibrium is corrected annually between government revenue and expenditure following exogenous shocks to the economy. The study proposed that the government ought to improve strategies for tax revenue collection in order to ensure a sustainable national budget.
Another study conducted by Bi et al. (Citation2014) used a DSGE model to examine the role of fiscal policy in developing countries with external debt and sovereign risk default. Their findings showed that expected future revenues play an important role to lower the fiscal limits of developing countries relative to advanced economies. External debt was found to have additional risk since a large devaluation of the real exchange rate can suddenly raise default probabilities. Moreover, when the economy approaches fiscal limits, government expenditure becomes less expansionary than in a low-debt country. The study suggests that as more revenues are required to service high debt, higher taxes raise the economic cost of consumption and subsequently reduce the fiscal multiplier.
A study by Jawadi et al. (Citation2016) estimated a Panel Vector Autoregressive approach to examine macroeconomic impact of fiscal policy and monetary policy shocks among five emerging markets, viz. Brazil, Russia, India, China, and South Africa (BRICS) using quarterly data from 1990 to 2013. The results indicated that monetary contractions stifle real economic activities and tighten liquidity market conditions, while positive shocks in government expenditure have strong Keynesian effects among BRICKS members. The unexpected fiscal policy expansion has a persistent and positive influence on real GDP and price level and does not cause hikes in interest rates. The study supported the notion of an accommodative stance between fiscal and monetary policy. The results were robust even after controlling for economic instability during the period of the financial crisis. Empirical studies reviewed in this section provide evidence of complex findings across different economies; therefore, this disparity in the findings of previous studies requires robust empirical investigation in order to provide rigorous SADC-specific empirical evidence on interrelationships between fiscal policy, and public debt, and economic growth. The following section outlines the methodological procedure adopted to discriminate against contradicting findings reported by previous empirical studies.
3. Research methodology
This study adopted a panel vector autoregressive (PVAR), fixed effects (FE), and random effects (RE) model to fulfill the primary purpose of the study. All macroeconomic variables employed for empirical investigation were carefully selected on the basis of theoretical foundations and literature underpinning the relationship between economic variables under examination. In line with previous studies such as Ocran (Citation2011), Taylor et al. (Citation2011), and Ghosh et al. (Citation2013), macroeconomic variables under consideration are gross domestic product (GDP), government expenditure, public debt, gross fixed capital formation, and employment. The justification of variables employed in the study is reported in Table , with respective data sources.
Table 1. Justification of variables
The study employed panel data techniques for 13 SADC economies, namely, Angola, Botswana, Congo (DRC), Eswatini, Lesotho, Madagascar, Malawi, Mauritius, Mozambique, Namibia, South Africa, Zambia, and Zimbabwe, over the period 2000–2018. The data of variables were extracted from the World Development Indicators (WDI), Federal Reserve Economic Data (FRED), and Quantic Easy data through an online database. The study extends the theoretical model proposed in the Keynesian approach as a theoretical justification for empirical modelling. The Keynesian theory hypothesises that fiscal policy is the main driver of output growth. The Keynesian approach maintains that fiscal policy plays a pivotal role in promoting and stabilising the economy through expansionary and contractionary measures on aggregate demand to steer sustainable economic activities during different phases of the business cycle.
3.1. Panel Vector Autoregressive (PVAR) approach
This study adopted a PVAR methodology pioneered by Holtz-Eakin et al. (Citation1988) to analyse interrelationships between fiscal policy, public indebtedness, and economic growth in SADC. The PVAR technique is one of the most sophisticated and appealing panel data estimation techniques which incorporates the characteristics of panel data with VAR analysis. The PVAR has the ability to handle the problem of heterogeneity and endogeneity within a panel framework. This approach combines the characteristics of a VAR with panel data techniques, which treats all variables as endogenous while allowing for unobserved heterogeneity and endogeneity within a panel setup (Love & Zicchino, Citation2006). The PVAR can be expressed using the following matrix form:
In Equationequation (1)(1)
(1) ,
represents a (5 × 1) vector of system endogenous variables, namely, gross domestic product (GDP), government expenditure (GOE), public debt (PD), gross fixed capital formation (GFCF), and employment (EMP). As a theoretical justification of explanatory variables, GOE and PD are fiscal variables while GFCF (as a proxy for capital) and EMP (as a proxy for labour) are incorporated in the model as controlling variables dictated by the theoretical foundation in the Cobb-Douglas production function. This specification is also guided by data availability among SADC member countries which also limits the sample size of the study. This remains the major limitation of the study. The term “
” is a (5 × 1) vector of a constant,
is a (5 × 5) matrix of coefficient estimates,
is a (5 × 1) vector of innovations in the system. Whereas
is a cross-sectional identifier and
is the optimal lag length of each variable in the PVAR system. Moreover, the PVAR is superior in its ability to trace the response of endogenous (GDP) due to the innovative shocks of its regressors and its own shocks in the system through impulse response functions (IRF). A PVAR method remains ideal for empirical investigation of the study due to its rigourness and underlying robustness of diagnostic and stability instruments.
3.2. Fixed Effects (FE) and random effects (re) methods
The estimation of FE and RE is undertaken to ascertain the robustness of empirical results from a PVAR output. Fixed effects (FE) and random effects (RE) modelling have been frequently used in economic modelling to analyse empirical relationships between economic variables. The FE explores the relationship between the predictor and outcome variables within a panel setup. The individuals within a panel have individual characteristics that may or may not influence the predictor variables, for example, the political systems of different countries have different effects on the economic performance of different countries (Torres-Reyna, Citation2007). Therefore, FE assumes that there are some underlying factors within individuals that may affect or cause bias in the endogenous or explanatory variable, and hence these must be accounted for and corrected accordingly.
The FE seeks to remove the effect of time-invariant characteristics in order to solely examine the net effect of explanatory variables on the endogenous variable. The FE further assumes that time-invariant characteristics are different across countries and ought to be uncorrelated with other individual characteristics. This suggests that each country’s error term and intercept that captures individual characteristics should be uncorrelated with each other, if they are correlated, then the FE is not an appropriate technique due to biasness, hence one may probably estimate a RE, through verification with the Hausman test. The FE equation may be expressed as follows:
Where, is the endogenous variable,
country, and
time;
is the slope coefficient of the explanatory variable;
is the explanatory variable;
represent the unknown intercept for each country, and
represent idiosyncratic errors. Stock and Watson (Citation1993) suggested that the main assumption behind the FE l is that unobserved variables do not change over time, and thus any changes in the dependent variable must be due to other influences except those of the fixed characteristics. On the other hand, the RE assumes that the variation across countries is random and uncorrelated with the predictor variable and explanatory variables. The key distinction between the FE and RE lies in whether the unobserved individual effect embodies the element of correlation with regressors rather than stochastic relationships in the system. Moreover, if one believes that different countries may have various influences on the endogenous variable, then RE should be chosen as an appropriate technique. The major advantage of the RE is that it can account for time-invariant variables such as gender, race, age, etc. while the FE absorbs the effect of these variables through the constant factor (Torres-Reyna, Citation2007). However, as stated earlier, the Hausman test is carried out to choose the most appropriate model between the FE and RE.
4. Analysis of empirical results
The entire estimation of a PVAR technique was carried out using Stata instruments offered by Abrigo and Love (Citation2016). The primary aim of the study is to analyse interrelationships between fiscal policy, public debt, and GDP growth among SADC economies. The study took advantage of a PVAR’s ability to track the responsiveness of economic growth due to innovative shocks of each endogenous variable through the IRF. Moreover, the estimation of the FE and RE enables the researcher to verify empirical results offered by PVAR estimates.
4.1. Panel Vector Autoregression (PVAR) Results
The entire estimation procedure of the PVAR technique is reported in order to demonstrate the entire execution process of a PVAR methodology. The researcher estimated a five-variable PVAR model, viz, GDP, GOE, PD, GFCF, and EMP. The first step before estimating a PVAR is to identify the appropriate lag order through the lag selection criterion as demonstrated in Table . The issues of stationarity among variables were tested using Levin, Lin and Chu (Citation2002) and Im-Pesaran-Shin (IPS) tests. The unit root tests indicated that all variables were I(0) since this is panel data analysis. The results of unit roots are not reported due to brevity; however, they are available upon request. The PVAR lag order selection is reported in the following Table
Table 2. PVAR lag length order selection
The process of determining the lag length order is the most important practice that allows for the selection of the most appropriate lag order within a PVAR framework. Andrews and Lu (Citation2001); and Abrigo and Love (Citation2016) contend that the appropriate lag order that should be chosen within a PVAR is the one at which the MBIC, MAIC, and MQIC carry the smallest statistic values. Table shows that MBIC, MAIC, and MQIC are all smaller at lag order 1. Therefore, the study proceeds with the estimation of the first order PVAR since the three model selection criterion have the smallest statistical values at lag 1 as proposed by Abrigo and Love (Citation2016). The PVAR captures the dynamic interrelationships between economic growth (GDP), government expenditure (GOE), public debt (PD), gross fixed capital formation (GFCF), and employment (EMP). The PVAR estimates are reported in Equationequation (3)(3)
(3) , with slope coefficients and respective t-statistics shown in parenthesis:
The results indicate that a 1% rise in lagged GOE causes a 1.1% rise in GDP during this period, since the equation is a log-linear representation, one ought to multiply the coefficients by 100%. This result implies that GDP responds positively due to a positive shock in government expenditure. The result validates the Keynesian approach that government spending is the main driver of economic activity. On the other hand, GFCF holds a significant negative effect on GDP. This result implies that a 1% rise in GFCF would lead to the economy contracting by 0.3% since this is a log-linear representation. Although the coefficient magnitude is too small to exert a severe effect, this relationship is not plausible since it contradicts the conventional theory such as the Solow model and the Endogenous growth model which claims that investment ought to bring a positive influence on economic growth. However, this result could be triggered by the fact that most developing economies such as SADC may channel the majority of investment towards non-stimulating sectors in the economy, and to a certain extent that may not be labour absorptive to improve economic activities. Moreover, the results show that employment has a significant positive impact on economic growth albeit small coefficient magnitude. This suggests that if employment increases by 1%, the economy would grow by 0.3%, at 1% level of significance. Even though the magnitude of the coefficient is modest, this finding is plausible and in line with conventional literature.
The elasticity coefficient of public debt (PD) has a significant positive impact of 0.03% on growth, implying that if PD increases by 1%, GDP would rise by 0.03%, even though the effect is modest. However, this finding is theoretically plausible as supported by the Endogenous growth model proposed by Romer (Citation1986) and Barro (Citation1989) which states that the effect of public debt on the economy would be positive if the debt is channelled towards financing growth-stimulating sectors such as infrastructure, technology, education and innovation rather than unproductive sectors. The results validate the Keynesian hypothesis as suggested by PVAR estimates.
Furthermore, the study inspected the stability condition of the PVAR prior to estimating the IRF. The stability test () confirmed that a PVAR is stable as an appropriate model. The result of Autoregressive (AR) roots tests indicates that all eigenvalues lie inside the unit circle, and therefore the PVAR satisfies the stability condition. Hence, the reported AR roots test shows that the PVAR is an appropriate technique. Therefore, the study further performs the IRF to establish the degree of different innovative shocks between GDP, GOE, PD, GFCF, and EMP within a PVAR system ().
Table 3. PVAR stability test
Table 4. Summary of empirical results
4.2. Impulse Response Function (IRF)
The estimation of IRF is undertaken to trace the responsiveness of each endogenous variable due to the innovative shocks in the system. The IRF results are presented over a ten-year horizon. The primary purpose of estimating the IRF is to establish the degree of different innovative shocks on endogenous variables in the system ().
Figure 1. Impulse Response Function (IRF).
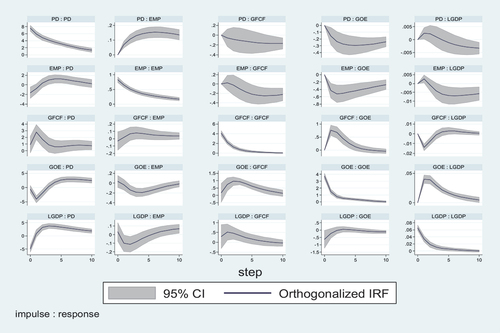
The study assumes that the innovative shocks in GDP have a direct impact on contemporaneous GOE, PD, GFCF, and EMP while these variables only affect GDP in the future. The IRF confidence intervals are computed using 200 Monte Carlo drawn from the estimated PVAR. The IRF result of interest remains the response of GDP to the positive shocks of fiscal policy as measured by government expenditure (GOE), public debt (PD), gross fixed capital formation (GFCF), and employment (EMP). The IRF plot on the fifth row shows that a positive unexpected shock from the GOE leads to a significant positive response of GDP, which implies a positive influence of fiscal policy stimulus on GDP growth in the SADC region. Interestingly, the GOE responds positively to the innovative shock of GDP. Notably, the current unexpected shock in GOE has a positive yet short-lived impact on both GOE and GDP since the unanticipated shocks fade away after approximately 2 years. As expected, the impact of unexpected current shocks on GDP has a positive effect on future GDP, but the shock disappears after a 5-year period lags.
The IRF results exhibit a slightly positive yet short-lived response of GDP to the shocks of GFCF, and a negative short-lived response of GFCF from GDP shocks. Consistent with PVAR coefficients, a negative response of GDP is observed from the unanticipated innovative shock of EMP; however, this shock fades away after 2 years. Lastly, there is a positive yet short-lived shock from PD to GDP. This unexpected shock in PD is immediately felt in the economy. The impact of the shocks of all variables is significantly felt in the economy. However, these innovative shocks fade away within a 10-year horizon. The IRF results are plausible and consistent with the PVAR estimates.
4.3. Verification methods—robustness
This section discusses the results of the FE and RE techniques for the purpose of comparison and robustness checks. The Hausman test revealed that FE is the most appropriate model; however, this section reports both FE and RE results for robustness. As mentioned earlier, Hausman’s test examines the null hypothesis that the RE is an appropriate model against the alternative of the FE. The results of the Hausman test reveal that the null hypothesis of the RE is rejected in favour of the FE as an appropriate model.
4.3.1. Fixed Effects (FE) model
The FE estimated equation and respective t-statistics in parenthesis are reported as follows:
EquationEquation (4)(4)
(4) shows that a 1% rise in GOE causes GDP to rise by 0.7% statistically significant at the conventional level, ceteris paribus. A significant positive coefficient of GFCF indicates that a 1% increase in GFCF would lead to a 0.6% growth in the economy, statistically significant at 1% level. The slope coefficient of EMP suggests that if employment increases by 1%, the economy would grow by 3.0%, ceteris paribus. On the other hand, the elasticity coefficient of PD indicates that if PD increases by 1%, GDP would contract by 0.3% significant at the conventional level. The FE rho statistic which is known as the intraclass correlation shows that 97.8% of the variance is due to differences across panels. Furthermore, the F-test of less than 0.05 indicates that the FE is well fitted, implying that all coefficients are significantly different from zero. The FE estimates are consistent with the PVAR except for the GFCF and PD coefficient which carry different signs. Moreover, these findings are supported by conventional literature on the subject matter.
4.3.2. Random Effects (RE) model
The estimated RE equation is presented in the following equation:
The RE estimates are not significantly different from the FE, and further complement the PVAR outputs. EquationEquation (5)(5)
(5) suggests that if GOE increases by 1%, GDP would rise by 0.7% statistically significant at 1% level, ceteris paribus. A positive coefficient of GFCF is plausible since it is consistent with the Solow growth model. This implies that a 1% increase in GFCF would cause GDP to increase by 0.5%, statistically significant at 1% significance level. The coefficient of EMP has a significant positive impact on GDP, implying that a 1% rise in EMP would lead to a 2.1% growth in GDP. Lastly, PD has a significant negative effect on GDP, this suggests that a 1% rise in PD would cause GDP to contract by 0.3%. The RE rho statistic shows that 86% of the variance is due to differences across panels. Furthermore, the Wald F-test of less than 0.05 indicates that the RE is a good model, implying that all coefficients are significantly different from zero.
The benchmark models remain the most appealing practical application in modern econometric modelling to ascertain the robustness of empirical findings. The PVAR, FE, and RE estimates provide rigorous empirical evidence of a significant positive impact of fiscal policy on economic growth in SADC economies. Thus, this result indicates a strong Keynesian effect among SADC economies. The results of the study are robust and highly significant even for verification models. These findings are consistent with previous studies such as Ocran (Citation2011); and Taylor et al. (Citation2011). The summary of the results shows that the PVAR estimates are supported by the FE and RE except for the contradiction in the coefficient signs for GFCF and PD. The PVAR generated a significant positive coefficient capturing the influence of government expenditure on economic growth. The results indicate that if government expenditure rises by 1%, the economy would grow by 1.0%. The FE and RE coefficient showed that GOE positively affects GDP, implying that a 1% rise in GOE would cause the economy to grow by 0.7%. These results are statistically significant at the conventional level and theoretically plausible as supported by the Keynesian school of thought.
The coefficient slope for GFCF under PVAR has a significant negative effect on GDP; however, this contradicts the FE and RE coefficients. The results show that a 1% increase in investment would cause the economy to contract by 0.3%. Contrary, both FE and RE indicate that if investment increases by 1%, the economy would grow by 0.5%. The results from the FE and RE are in line with conventional literature and supported by the Solow growth model. The significant negative effect from PVAR output could be triggered by the fact that most developing economies such as SADC may channel the majority of investment towards non-stimulating sectors in the economy not earmarked to improve economic conditions and activities that would yield long-term economic expansion. The slope coefficient for EMP is consistent and statistically significant at the conventional level across all models. The PVAR results suggest that a 1% increase in employment level would lead to a 0.3% growth in GDP. Interestingly, the FE and RE show that if employment improves by 1%, the economy would grow by 3.3% and 2.1%, respectively. This finding makes economic sense because as the number of people employed increases, the outputs level is also expected to rise, and this is theoretically plausible as supported by the Keynesian approach.
A significant positive elasticity coefficient for PD under the PVAR estimates contradicts the coefficient signs offered by the FE and RE. The PVAR results indicate that if public debt increases by 1%, the economy would be expected to grow by 0.03%. Conversely, the FE and RE results suggest that there is a significant negative effect of public debt on economic growth, implying that a further 1% rise in public debt would lead to a contraction in the economy by 0.3%. These disagreements in empirical findings explain the contradiction of several empirical pieces of literature that have been reported in previous studies across different economies. However, in the midst of controversy in the results, the researcher is inclined to rely on the PVAR estimates due to the rigor involved in its estimation process and accompanying IRF supporting this relationship, and robust post-diagnostic inspections. This study subscribes to the notion that public debt channeled towards productive sectors of the economy such as infrastructure, education, and technology would stimulate long-term economic growth.
The overall empirical findings are theoretically plausible since all estimated models offered estimates pointing to the same direction on the impact of fiscal policy on economic growth in SADC. The empirical findings suggest that fiscal policy and public debt play a very pivotal role in stimulating economic activity in SADC. These findings are consistent with the empirical literature conducted on the same subject matter such as the work of Ocran (Citation2011), Taylor et al. (Citation2011), and Ghosh et al. (Citation2013) among others.
5. Conclusion and policy prescriptions
The study provides rigorous empirical evidence on the impact of fiscal policy and public debt on economic growth in SADC economies. The empirical results were found robust and theoretically plausible even for benchmarking techniques. The study estimated the PVAR with accompanying IRF to analyse the response of GDP due to the innovative shocks of endogenous variables in the system. The results revealed a significant positive influence of fiscal policy on economic growth in SADC. This study proposes that policymakers ought to establish prudent policy intervention that would ensure that the majority of government expenditure is channeled towards productive and growth-stimulating sectors which may include infrastructure investment, technology, innovation, education, and employment-creating programs to enhance economic activities through expansionary fiscal policy. Furthermore, the results validate the Keynesian hypothesis in SADC region, hence fiscal policy ought to be at the center of prudent policy formulation that aims to promote stable public finances consistent with balanced and sustainable economic growth
Subsequently, this process would eventually lead to accelerated economic growth, increase government revenues, and effectively promote stable fiscal balance and sovereign creditability among SADC members. Moreover, the adoption of prudent fiscal mechanisms ought to focus on enhancing economic activities without hampering consumption patterns and the economic well-being of the society over the long term. This can be done through financing employment initiatives and creating an enabling and conducive environment that would induce both labor-intensive and capital-intensive projects to enable individuals to start their own enterprises independent from government subsidies. This process would subsequently generate job opportunities and extend the revenue base that government earns through taxes consistent with expenditure to stabilise public finances. Furthermore, the study suggests that fiscal authorities may consider formulating robust investment-friendly and employment-enhancing policies that would enable small micro medium enterprises (SMMEs) to thrive within the economy while safeguarding stable public finances consistent with long-term economic prosperity in SADC economies.
Disclosure statement
No potential conflict of interest was reported by the author(s).
Additional information
Funding
Notes on contributors

Bongumusa Prince Makhoba
Bongumusa Prince Makhoba is a lecturer at the University of Zululand, Department of Economics. Dr. Makhoba holds a Ph.D. in Economics from the University of Zululand. He has published several research articles in various accredited peer-reviewed economics journals in Development Economics, Macroeconomics, and Public Economics with the application of advanced econometric methods for economic policy analysis, as his area of research interest.
References
- Abrigo, M. R., & Love, I. (2015). Estimation of panel vector autoregression in stata: A package of programs. Manuscript. http://paneldataconference2015.ceu.hu/Program/Michael-Abrigo.pdf
- Afonso, A. and Sousa, R.M. (2011). The macroeconomic effects of fiscal policy in Portugal: a Bayesian SVAR analysis. Portuguese Economic Journal, 10(1): 61–82.
- Andrews, D. W. K., & Lu, B. (2001). Consistent model and moment selection procedures for GMM estimation with application to dynamic panel data models. Journal of Econometrics, 101(1), 123–12. https://doi.org/10.1016/S0304-4076(00)00077-4
- Antonakakis, N., & Collins, A. (2014). Sovereign debt and economic growth revisited: The role of (non) sustainable debt thresholds. Social Science & Medicine (1982), 112, 39–50. https://doi.org/10.1016/j.socscimed.2014.04.019
- Barro, R. (1989). The Ricardian approach to budget deficits. The Journal of Economic Perspectives, 3(2): 37-54.
- Bi, H., Shen, M. W., & Yang, M. S. C. S. (2014). Fiscal limits, external debt, and fiscal policy in developing countries. International Monetary Fund, 1(49): 1-37.https://doi.org/10.5089/9781475521665.001
- Dungey, M. and Fry, R. (2009). The identification of fiscal and monetary policy in a structural VAR. Economic Modelling, 26(6): 1147–1160.
- Fry’McKibbin, R.A. and Zheng, J. (2019). How Do Monetary and Fiscal Policy Shocks Explain US Macroeconomic Fluctuations? A FAVAR Approach. “https://www.business.uwa.edu.au/__data/assets/pdf_file%20” https://www.business.uwa.edu.au/__data/assets/pdf_file
- Ghosh, A. R., Kim, J. I., Mendoza, E. G., Ostry, J. D., & Qureshi, M. S. (2013). Fiscal fatigue, fiscal space and debt sustainability in advanced economies. The Economic Journal, 123(566), F4–F30. https://doi.org/10.1111/ecoj.12010
- Holtz-Eakin, D., Newey, W., & Rosen, H. (1988). Estimating vector autoregression with panel data. Econometrica, 56(6), 1371–1395. https://doi.org/10.2307/1913103
- Jawadi, F., Mallick, S. K., & Sousa, R. M. (2016). Fiscal and monetary policies in the BRICS: A panel VAR approach. Economic Modelling, 58(1): 535-542. https://doi.org/10.1016/j.econmod.2015.06.001
- Levin, A., Lin, C.F., and Chu, C.S. (2002). Unit Root Tests in Panel Data: Asymptotic and Finite-Sample Properties. Journal of Econometrics, 108(1): 1–24.
- Love, I., & Zicchino, L. (2006). Financial development and dynamic investment behavior: Evidence from panel vector autoregression. Quarterly Review of Economics and Finance, 46(2), 190–210. https://doi.org/10.1016/j.qref.2005.11.007
- Ocran, M. K. (2011). Fiscal policy and economic growth in South Africa. Journal of Economic Studies, 38(5), 604–618. https://doi.org/10.1108/01443581111161841
- Ogbole, F. O., Amadi, S. N., & Essi, I. D. (2011). Fiscal policy: Its impact on economic growth in Nigeria (1970-2006). Journal of Economics and International Finance, 3(6), 407–417.
- Oyeleke, O.J. and Ajilore, O.T. (2014). Analysis of fiscal deficit sustainability in Nigerian economy: An error correction approach. Asian Economic and Financial Review, 4(2): 199.
- Rena, R., & Kefela, G. T. (2011). Restructuring a fiscal policy encourages economic growth - A case of selected African countries. Journal of Economics and Business, 14(2), 23–39.
- Romer, P. (1986). Increasing returns and long-run growth. Journal of Political Economy, 94(5), 1002–1037. https://doi.org/10.1086/261420
- Stock, J. and Watson, M. (1993). A simple estimator of cointegrating vectors in higher order integrated systems. Econometrica, 61(4): 783–820.
- Taylor, L., Proano, C. R., Laura de, C., & Barbosa, N. (2011). Fiscal deficits, economic growth, and government debt in the USA. Schwartz Center for Economic Policy Analysis and the Department of Economics, The New School for Social Research. Working Paper Series.
- Torres-Reyna, O. (2007). Panel data analysis fixed and random effects using Stata (v. 4.2). Data and Statistical Services, Princeton University.
