
 ?Mathematical formulae have been encoded as MathML and are displayed in this HTML version using MathJax in order to improve their display. Uncheck the box to turn MathJax off. This feature requires Javascript. Click on a formula to zoom.
Abstract
This study investigates the impact of agricultural marketing program on smallholder investment behavior. The study is based on cross-sectional household data from a survey of 507 smallholder maize farmers from rural communities in Ghana. The study employed propensity score matching (PSM) to estimate the average treatment effect of the marketing program on farmers’ investment behavior. The results show that smallholder farmers’ participation in buffer stock marketing program is influenced positively by gender, transportation cost and access to extension service and negatively by marital status among others. Overall, the results show that the buffer stock marketing program has positive impacts on smallholder farmers’ investment behavior of increasing input usage, farm expansion and yield smallholder farmers. However, the highest impact is on farm expansion. The results of the study reveal that the marketing program stimulates investment in farm size expansion more than in inputs usage. To derive the most impact from the program, a possible review of the program could look at strategy of focusing on the implementation of the program in rural areas rather than in peri-urban areas where land access is more constrained. This study contributes to a better understanding of f farmers’ investment behavior of input usage and farm expansion. This knowledge could help policymakers and development organizations shape future interventions for increased uptake.
PUBLIC INTEREST STATEMENT
Smallholder farming is the bedrock of the Ghanaian agrifood system. However, smallholder, specifically maize farmers, in Ghana put more effort into farming, get relatively good yields, and yet get low incomes because they were unable to sell their produce at competitive prices. They lacked storage facilities and market outlets are far with poor road network. These farmers get low returns from farming enterprises and continue to be poor. As a result, they lack motivation to invest in their farming, if not for their household’s basic needs. The introduction of the buffer stock operations program which aim to assure farmers of stable and remunerative income through a dual fixed pricing mechanism is expected to influence their investment behaviour and stimulate increased investment in farming activities. There is the need, therefore, to find out whether this is happening following a decade of implementation of the buffer stock marketing program.
1. Introduction
The contributions of smallholder farmers in developing economies to ensure global food security and poverty reduction is well noted in literature (Abdul-Rahaman & Addulai, Citation2020). However, smallholder farmers who currently produce about 70–80% of the world’s food continue to face several challenges, including marketing of these produces, which impede their farm-level investment activities for agricultural growth (FAO, Citation2014; Ricciardi et al., Citation2018). Smallholder farmers in developing and low-income countries, especially in Africa, often lack the incentive to invest in their farm activities to improve productivity and increase production volumes. A reason for this lack of incentive by smallholder farmers is that improved yields do not often commensurate with improved incomes for such farmers due to failed markets (Okello et al., Citation2020). As a result, productivity and improvement in yields continue to be stagnant because investment among smallholder farmers is low. Food security, especially in Africa, could therefore be threatened.
The global population is expected to increase by 9.6 billion by 2050 (Akinsete et al., Citation2022) and this will require the world’s food production to also increase, on the average by 90% to meet the projected food demand (Gramzow et al., Citation2018). To attain food security for the fast-growing population in the African sub-region, food production volumes and productivity need to grow by at least the same rate at which the population is growing. Indeed, enhancing agricultural productivity and increasing production volumes by smallholder has the potential to improve food security, reduce extreme poverty and improve the livelihood of both rural and urban people in developing economies (Christiaensen et al., Citation2011). In addition, improving agricultural production by smallholder creates employment for many people in both the agricultural and in the non-agricultural sectors and drive economic growth.
Therefore, for smallholders who produce and supply about larger share (70%) of the food for the sub-region, there is urgent need for them to increase smallholder farmer investments for increased food production and food security (Benjamin, Citation2020). To increase food production, farmers are required to expand farm size (extensification) and/or adoption of good agricultural practices and (intensification) among others. Sustainable agricultural intensification and extensification practices which are fundamental to improving food production and food security require not only public investment but also investment from the smallholder farmer themselves (Ollenburger et al., Citation2016; Reddy et al., Citation2020). Agricultural intensification is “a process that results in increased output per unit of land as a consequence of intensive use of inputs and labor per unit of land” (Nin-Pratt, Citation2015). Though an old issue, intensification is still relevant in today’s agriculture. Generally, intensification usually manifests itself as land management practices that ensure that land is efficiently utilized to enhance yields. However, intensification can be used in different contexts. In the context of smallholders in a low-income country, intensification activities relate to inputs usage particularly fertilizer usage and improved crop varieties usage to increased productivity; output per unit (Erenstein, Citation2006). While intensification does not involve increase in land size, extensification on the other hand involves the expansion of production to cover lands that were previously uncultivated which require investment in expansion in farm size in the midst of limited land. Extensification increases inputs and labor to increase output just like intensification except that there is no increased output per unit of land. Thus, under both intensification and extensification, there is the likelihood to increase production of food and income with intensification increasing productivity but not extensification (Nin-Pratt, Citation2015).
A key barrier to the adoption of these approaches to agriculture, intensification and extensification, is the presence of failed market. Due to failed market, there is high price volatility in the agricultural output market. Because smallholders’ agriculture is rainfall-dependent, they harvest at the same time due to common cropping calendar. They do not have the capacity to stager their production. This often leads to glut during the harvest season when producer prices are at their lowest end of price volatility (Abokyi et al., Citation2020). As a result, smallholder farmers often have low income and any increase in investment does not yield the required income increase. Therefore, there is little or no incentive to invest by the smallholder farmer. To stimulate smallholder investment in intensification and extensification requires creating external policy environment that motivates smallholders.
A key policy approach often adopted by governments in developing economies to motivate smallholder farmer investment is creating access to efficient market (Lindsjö et al., Citation2020). In this regard, the Government of Ghana in 2010 introduced the buffer stock operations marketing program (BSOMP) as market intervention to purchase farm produce from smallholder farmers. The program is implemented by the National Food Buffer Stock Company (NAFCO). The BSOMP involves NAFCO using the services of License Buying Companies (LBCs) registered by NAFCO across the country to purchase produce, mainly maize and rice, from smallholder farmers at a fixed price (MoFA, Citation2017). The LBCs travel to the farmers at the farm gate. The BSOMP intervention provides farmers with efficient marketing system that assure them of remunerative return for their produce and therefore expects to motivate smallholder farmers to invest in their production activities. The BSOMP intervention also provides an off-taker opportunity for farmers and stimulating farmers especially smallholder farmers’ investment behavior invest to use more inputs and expanding for sizes.
However, understanding the investment behavior in Africa is under studied (Ihli et al., Citation2018; Lin et al., Citation2021). Specifically, studies evaluating the impact of buffer stock operations marketing program on the investment behavior of smallholder farmers are few. This paper intends to fill this research gap. Thus, the aim of this paper is to contribute to the understanding of smallholder farmers’ investment behavior relating to intensification and extensification and the facilitating role of output marketing program to create an incentive and motivate smallholders. To this end, I posed the question, having implemented BSOMP for over a decade, what has been the effect of the BSOMP on smallholder farmer’s investment behavior. A survey of 507 smallholder farmers, households is conducted to analyze the impact and to identify the effect of the program on the investment behavior of the farmers participating in the buffer stock operation marketing program. The contribution of the paper is to provide an empirical test of whether a marketing program motivates farmers to invest in input usage (intensification) and farm expansion (extensification) among smallholder. In addition, the paper contributes to providing impact assessment literature on buffer stock operation marketing program in developing country context.
The paper is structured as follows: a conceptual overview of the relationship between buffer stock operations marketing program and farmer investment behavior is provided in the next section. Section 3 presents the methodology and section 4 presents the results of the study. Chapter 5 concludes the study and provides policy option for consideration.
2. Literature review
2.1. The link between buffer stock operating marketing program (BSOMP) and farmer investment behavior
The analysis of the link between buffer stock operations marketing program and investment behavior is based on the theory of rational expectation. The application of the theory is in the developing country context. In this context, it is assumed that farmers are infinitesimal and cannot influence market prices individually, but rather the farmer is a price-taker in both the input and output markets (Chintapalli & Tang, Citation2022). Under the rational expectation theory, the smallholder is expected to maximize his income when making his/her decisions of where and the price to sell his/her produce. Furthermore, it is assumed that each farmer is risk-neutral and the farmers do not collude among themselves (Chintapalli & Tang, Citation2021). Therefore, governments pursue vigorous market policy in food grains market, deliberately to guide the farmers’ decisions. As farmers are rational, they make their farm investment decisions based on the anticipated future price of the crop (Chintapalli & Tang, Citation2022).
The buffer stock operation marketing program (BSOMP) generally is expected to stabilize prices and provide farmers with assured incomes. Based on production cost to farmers, government fixes a remunerative minimum price to purchase produce from farmers. The minimum price is fixed such that farmers will get an “optimal” profit (Abokyi et al., Citation2020). Usually, because the minimum price set by the government is higher than the open market price, an imbalance in the local economy is created due to the price differentials. The current BSOMP is an output price subsidy given to farmers as minimum price support (MSP). While the BSOMP is a subsidy, the setting of the minimum price also forces the open market price to increase, and ultimately farmers receive competitive prices for their products to enhance their incomes (Guda et al., Citation2021; Ramaswami et al., Citation2018). Also, through buffer stock marketing program, market supplies are controlled by government through purchasing and storing the excess maize. This creates temporal demand for produce aid price movement (Chen et al., Citation2014).
The underlying principle for the motivation of farmers is that as farmers are assured of competitive stable prices for a specific crop, they invest in the new lands for expansion of their farm size (intensification) and adopt good agricultural practices to increase production and income (Eriksen & Lensink, Citation2015). Also, as observed by Ramaswami et al. (Citation2018) price support is an incentive aimed at facilitating investment to improving production. With “better” and stable price for a specific crop, coupled with easy access to market for the crop (which BSOM does), farmers are more likely to put their land into producing such crop that have high value/income and ready market (Czyżewski & Matuszczak, Citation2016; Garrett et al., Citation2013; Ioris, Citation2016). Farmers increase production by increasing farm sizes or adopting good agricultural practices to increase yields. Farm sizes are increased by investing in acquiring new productive lands and putting new lesser productive lands into use: extensification. Similarly, increase yield could be achieved without increasing the cropland by adopting intensification practices including fertilizer application and use of improved seed varieties (Dias et al., Citation2016).
Therefore, with the current buffer stock operations marketing program where farmers are given stable, remunerative prices and efficient access to market for their produces, I hypothesize that, the buffers stock operations marketing program (BSOMP) is expected to have positive effect on the investment behavior of farmers, i.e., the BSOMP is expected to stimulate smallholder farmer increase their input usage and expand farm sizes. Therefore, the participation of farmers in the BSOMP is to impact on three key outcome variables which are identified and examined; the three key outcome variables are measured in this study: level of input usage, farm size and yields. While the participation of farmers is expected to influence farmer’s investment behavior, there are control factors that also influence the farmers’ decision to participate in the program. It should be noted that for smallholder farmers, the BSOM could serve as an alternative market outlet. Therefore, it is seen as a substitute for open market outlet that exists in the nearby community for farmers to sell their farm produce.
2.2. Factors that influence farmers’ decision to participate in the BSOMP and investment behavior
Smallholder farmer inputs and land-use (investment) decisions are the results of a product of a complex mix of socio-economic, cultural, natural environment and marketing factors (Brown et al., Citation2014). The variables that are likely to influence farmers’ decision to participate in the buffer stock operations marketing program (BSOMP) are household characteristic/factors (such as gender, age, household size, marital status and education), marketing factors and membership of farmer association among others. These household and farm-level characteristics/variables are also control variables as they affect the investment behavior of farmers (Ma et al., Citation2018; Ma & Zheng, Citation2022: Zhang et al., Citation2020a). These variables are discussed both as factors that influence the smallholder participation in the BSOMP and as control variable on the impact of BSOMP on farmer’s investment behavior.
2.2.1. Education of the household head
Education has been reported as a major factor that influences many of the decisions that farmers take including the decision to participate in markets and sell their produce (Zhang et al., Citation2020). It is argued that education improves the farmer’s ability to access and interpret the needed market information leading to the awareness about such market programs as the buffer stock operations marketing program (BSOMP). As the main decision maker, the more educated the head of the household is, the more analytical the farmer is in the decision-making process (Wolanin, Citation2013). Also, education is a vital determinant of awareness of marketing programs with more educated farmers being more likely to have higher ability to obtain and process information about the BSOMP program than the less educated farmers (Abokyi et al., Citation2020; Maspaitella et al., Citation2018). With higher ability to obtain and analyse information about the program and other marketing outlets, the effect of education on farmers’ decision to participate in the BSOMP could be negative or positive, i.e. the direction of the relationship is uncertain.
2.2.2. Gender of household head
Gender has been found to positively influence farmer’s decision to participate in a marketing program (Abokyi et al., Citation2020). Drafor et al. (Citation2005) suggested that based on the Ghanaian culture, women are more responsible for the marketing of produce and other household consumables compared to men. As a result, women have a better understanding of the marketing process of negotiation and identification of different marketing outlet and marketing information of price. Women are also more likely to go to the main market place to sell their farm produces and also buy other commodities for their households. While Hegena and Teshome (Citation2022) found out that women are more likely to participate in vegetable markets, Christiana (Citation2021) reported that, in Nigeria, men are more likely to participate in the sweet potato market compared to women. In the case of the current buffer stock operations marketing program (BSMOP), women may not participate in the BSOMP because the marketing activities take place at the farm gate.
2.2.3. Household size and marital status
Marketing of agricultural produce requires considerable amount of labor (Almalz et al., Citation2014; Shilpi & Umali‐Deininger, Citation2008). Large households are expected to have more labor at their disposal. This provides farmers with the ability to access and participate in different markets. Thus, farmers are likely to participate in markets that would offer them better returns even if these markets require more labor to participate in them. Hence, household size has a significant relationship with market participations. Similarly, large households have more farm labor that they can use when they decide to invest in farm expansion and fertilizer application which requires a lot more labor. Ma and Zhang (2022) reported a positive effect of household size on fertilizer usage among wheat farmers in China. The reason ascribed to this finding is that households with a larger size are less likely to encounter labour shortage during the entire farming season, even during the peak of the season, and therefore tend use fertilizer more which requires more labor. Almalz et al. (Citation2014) also found in Ethiopia that, with increased household size, labor is available for the household to spare on looking for an alternative market outlet.
Also, the decision to sell maize to the buffer stock project could be a joint decision of both wife and husband. However, both may differ in their views, and the different views may reduce the probability of households participating in the programme (Musah et al., Citation2014). Similarly, the effort of both husband and wife could provide several outlets to sell their products and hence reduce the probability of selling to the buffer stock operations. In the case of investment, a household with the head married is more likely to pool resources from both the husband and the wife and increase the investment ability.
2.2.4. Membership of farmer association
Belonging to a farmer-based association/organization has been found to influence the investment behavior and participation in marketing programs (Ma et al., Citation2018). It is believed that in a farmer association, the members get market information relating to price, activities of middlemen, which help in making decision about their participation in a specific market (Zhang et al., Citation2020b). Mmbando et al. (Citation2015) found that in Tanzania, smallholder farmer’s membership in farmer association influences their market participation decision. Therefore, depending on the specific information about the buffer stock operations marketing program (BSOMP), the direction of the influence of membership in the association is uncertain.
2.2.5. Access to market
Smallholder farmer’s participation in the buffer stock marketing program is hypothesized to be negatively associated with the farmers’ access to efficient market. If a farmer has access to an efficient market outlet, they are more likely to have more options to sell their produce. However, with the predominantly poor roads in Ghana, farmers face a lot of difficulty in accessing market centers and often prefer to sell their produce at the farm gate in spite of the poor price given them by buyers (Abokyi et al., Citation2020; Barrett, Citation2008). The BSOMP is an alternative market outlet to the farmers and could be described as a substitute for the existing open market outlets in the local or nearby community which the farmers access. Therefore, with low access to market, farmers are more likely to sell to the BSOMP as the BSOMP does its purchases at the farm gate.
2.2.6. Marketing cost of transportation and packaging
Smallholder farmers incur marketing cost when they transport their produce to the various market outlets for sale (Osebeyo & Aye, Citation2014). Typically, these costs often comprise packaging cost and transportation cost. However, when farmers sell to the BSOMP, these costs are eliminated as the selling to the buffer stock operations marketing program (BSOMP) is done at the farm gate (Fafchamps & Hill, Citation2005). In addition, smallholder farmers do not need to package their produce when they sell to the BSOMP as the BSOMP does the packaging of the produces by providing sacs and other packaging materials to farmers. Also, farmers do not pay market tolls when they sell at the farm gate reducing their marketing cost. Therefore, increase marketing cost; transportation and packaging cost, is likely to negatively influence the smallholder farmer’s decision to participate in the BSOMP.
2.2.7. Access to extension service
Smallholder farmers’ access to extension services has been reported to have effect on farmer’s choice of market outlet to participate in (Gulati et al., Citation2022; Nxumalo et al., Citation2019). The current buffer stock operations marketing program (BSOMP)’s information is disseminated through extension service by government. Therefore, when farmers get more access to extension services, it means that farmers are more likely become more aware about the program and be able to take decision about selling it (Barrett, Citation2008; Poku et al., Citation2018). Thus, it is the expectation that access to extension service has a positive association with participation in the BSOMP.
2.2.8. Storage facility
Farmer’s ability to store their produce could also influence their decision to sell their produce (Ampaire et al., Citation2013). If a farmer has storage structure, he/she is likely to store his produce in anticipation of better price. When farmers have access to storage facilities, either of their own or as a service that they could pay for, they are likely to have more options available to them to selling their produces as they have the capacity to bargain for better prices since they are not under any pressure to sell their produce because post-harvest loss is likely to be minimal (Gulati et al., Citation2022; Luo et al., Citation2022). Thus, farmers have the patience and time to access different market outlets which could provide them better price to improved income. As a result, the farmer may not be in a hurry to sell his/her produce and therefore has a negative association with participation in the BSOMP.
2.2.9. Participation in secondary occupation/non-farm work
Haile et al. (Citation2021) reported that engagement in other secondary jobs to earn non-farm income influences smallholder farmer’s participation in farm market in Ethiopia. It is argued that farmers who engage in a secondary occupation/non-farm work are likely to sell their produce to the BSOMP because such farmers have high income and may be resource endowed compared to relatively poor ones. As such, they may produce more. For such well resources endowed farmers, selling during the glut period may be necessary as they take advantage of these types of programs to sell their large volume of produce. Again because these farmers are more resource endowed, they are able to satisfy the required volumes the BSOMP may want and also likely to meet their quality standards. However, because these farmers have enough resource at their disposal, they may not be under pressure to sell during the glut periods where the BSOMP purchases farm produce Gulati et al., Citation2022). Therefore, the direction of effect of participation in secondary occupation/non-farm work on participation in BSOMP is uncertain.
2.2.10. The buffer stock operations marketing program (BSOMP)
As mentioned earlier, BSOMP is a program designed to provide smallholder farmers access to efficient market and assure them of stable return from their investment. Access to stable and efficient market that assures farmers of stable income stimulate farmer’s investment in converting available land into more productions (Adanacioglu, Citation2017; Monson et al., Citation2008). Monson et al. (Citation2008), for instance, found a positive relationship between farm size and access to a stable and efficient marketing among Virginia farmers. The underlying reason for this relationship is that as farmers produce greater volumes of output and are able to sell, they are motivated to convert available land for producing more of the crops. However, because land is limited, farmers also turn to invest by adopting improved agricultural practices such as fertilizer and other inputs usage to help increase their yield and earn more income. Therefore, it is hypothesized in this study that participation in the buffer stock operation marketing program positively affects farm size and inputs usage.
The variables and how they relate to participation in the BSOMP program and investment behavior of the farmers are presented in :
Figure 1. The conceptual framework.
Empirically studies relating to and analyzing the investment behavior of smallholder farmers several researchers abound (see, Ihli et al., Citation2018; Kotu et al., Citation2022; Pilarova et al., Citation2022; among others). Pilarova et al. (Citation2022), for instance, investigated the investment behavior of 234 farmers in Republic of Moldova by using a survey data and binary probit regression model. Also, Kotu et al. (Citation2022) studied the smallholder farmers’ intensification behavior towards maize production investment farmers in Ghana using cross-sectional survey data. Furthermore, the empirical studies investigating the buffer stock and marketing participation by Abokyi et al. (Citation2020) and Abdul-Rahaman, A., & Abdulai have analysed these variables using propensity score matching.
3. Materials and methods
3.1. The study area
This study is conducted in five districts in the transition zone of Ghana ( shows map of Ghana); Nkoranza South, Nkoranza North in the Bono East Region, Ejura Sekyere Dumase in Ashanti Region where the buffer stock operations marketing program (BSOMP) is present, Kajebi and Jasikan Districts in the Oti Region where the program is absent. The study area has climatic and soil conditions that are relatively optimal for maize production compared to other parts of the country. With a tropical climate, the study area has temperature averaging 24°C with a bi-modal rainfall pattern. The annual rainfall ranges 1200–1400 mm with semi-deciduous forest and Guinea savannah woodland. Farming is the dominant economic activity in the area. The major crops grown are maize, cassava, plantain, yam, cocoyam, cowpea and rice. The Volta Lake (about 4 km wide) separates the treated and the control regions in the eastern part of the Bono East region and reduces trading between the treated and the control. Therefore, the likelihood of contamination between the treated and control group is low and reduces information spillovers.
Figure 2. The study area.
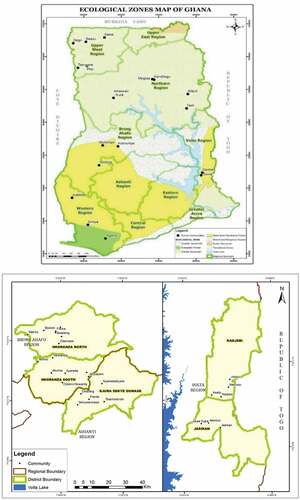
Farmers in the study area are mostly smallholders who cultivate on the average 2 Ha. Due to poor roads, the lack of access to efficient markets as transportation is very expensive hence farmers are unable to access distant urban markets. For this reason, higher food prices do not always filter down from the urban areas to the farm-gates in the study area. Furthermore, inadequate access to market information and inability to access market intelligence limits their ability to meet market demands (Baeman & Dillon, 2016; Poku et al., Citation2018). The activities of middleman regarding marketing of cereals are therefore predominant in the study area. These middlemen take advantage of the situation and purchase maize from farmers at very low uncompetitive prices resulting in very low incomes to farmers.
3.2. The definition of the variables
Drawing from the literature above, the following are the main variables that are studied. The buffer stock operations marketing program (BSOMP) is the dependent variable for which factors that influence participation in the BSOMP are examined. Following participation in the BSOMP, we expect improvement in the outcome variable/investment variables. The key outcome variables measured in this study are the farm size (Farmz), level of input usage (Input) and yields of maize (Yield). The variables, their definition and measurement are presented in .
Table 1. Variable description
3.3. Sampling and data
Data for the analysis are a cross-sectional household/farm level data collected from smallholder maize farmers in rural areas of Ghana through a survey in five maize growing districts. The survey was under the project “Welfare impacts of buffer stock operation in Agriculture in Ghana” under the Faculty of Spatial Science of the University of Groningen, The Netherlands. The survey was designed and led by the Author. The use of cross-sectional data helps to distil the impact of the intervention on household’s participation in the intervention as this provides us the opportunity to distill the impacts of the intervention (Khandker et al., Citation2009). The use of cross-sectional data is grounded in the works of Khandker et al. (Citation2009) that in the absence of experimental (panel) data, non-experimental cross-sectional data could be used to analyze the impact of an intervention on households.
The sampling approach involves a three-stage stratification. In the first stage, the major maize growing areas in Ghana, called the agro-ecological transition zone, is divided into the policy-on areas and the policy-off areas. A total of three districts were selected: Nkoranza North, Nkoranza South and Ejura Sekyere Dumase as the buffer stock operations marketing program (BSOMP) districts. In the policy-of zones, two districts were selected: Jasikan and Kejebi as the non-participating districts. The choice of these participating districts is because they are among the districts with the most relevant communities in terms of maize production and for implementing the policy for more than five years. The two non-participating districts were also chosen because they provide a similar environmental characteristics as compared to the policy-on districts. In the second stage, a total of 18 maize communities were selected from the BSOMP policy-on districts and 22 from the policy-off districts. In each of the districts, a total of 13 households were selected randomly making a total of 234 for the beneficiary farmers and 286 for the non-participant farmers in the final stage. Thus, the household data were collected from 520 households in the five maize growing districts in Ghana, but the analysis is focused on 507 households due to missing data on some households.
The survey, which was face-to-face and paper-to-pen, was conducted between November 2017 and January 2018. However, the selected households have participated in the BSOMP policy for at least five years between the years 2011 and 2016. A standardized questionnaire was designed to elicit household and farm level information from both the BSOMP farmers’ and non-BSOM farmers’ households. During the field mission for the survey, eight enumerators and two supervisors were put into two groups of four enumerators and a supervisor for the survey.
A pilot test was conducted prior to the main survey to validate the instrument. The main objective of the pilot test was to validate the questionnaire and provide respondents the opportunity to familiarize themselves with the questions in the questionnaire. It was also to help improve their interviewing techniques to ensure they understand all the questions so as to collect adequate and reliable information. It also helped us to identify the key weakness of the questionnaire for improvement. Information collected from the pilot testing (which was done outside the study area – Dodowa in the Greater Accra region) was used to improve the survey instrument and data from the pilot survey did not form part of the analysis. In the pilot survey, the approach used by Haile (Citation2010) was adopted. First, the researcher interviewed a few respondents, while the enumerators played the role of an observer. Later on, this role was changed and the former became an observer, while the latter became the interviewer. An evaluation of the content of the interviews and the process of interviewing was done by the team, and the questionnaire was reviewed following the weaknesses that were identified.
During the face-to-face interviews, consent of the respondents was obtained by reading out a consent statement to respondents. The consent statement also provided statement on the assurance of confidentiality of responses and the security of respondents.
3.4. Limitation
The limitation encountered during the survey recall bias. Recall bias results from having to ask respondents for information from a period in the past and providing less-than-truthful response. There are many reasons why farmers may provide a bias or less-than-truthful responses to questions. For instance, they may want to appear worse off than they are in the hopes that doing so may help to attract some donor support or they may want to appear better off than they are for fear of being judged by enumerators. In an attempt to reduce/mitigate this potential bias, farmers were provided with clear information about why they were being interviewed. They (farmers) were informed that their responses would have no bearing on their participation or lack of participation in any current or future projects. The enumerators also assured the farmers that information obtained from them would be highly treated as confidential. Although some recall bias is unavoidable, there is no reason to believe that recall bias should differ in its severity between the treatment and control groups as this is common across groups and mitigates the threat to the overall comparability of the groups. Additionally, in an attempt to reduce potential validity issues, the matching approach enhances the comparability of the treatment and the control groups.
3.5. Likert scale data and normalization
Some of the variables (level of input usage, access to market, access to extension service, storage facility, and farmer association) used in the studies are obtained through the use of Likert scale approach as indicated in . The use of the Likert scale to elicit information on these variables is based on the inability of the smallholder farmers to provide objective responses on the variables and that called for subjective responses through the use of the Likert scale. The Likert scale continues to be used in recent studies to collect information from farmers (Awiti et al., Citation2022; Fuhrimann et al., Citation2022; Ndlovu et al., Citation2022). The use of the Likert scale reflects the subjective evaluation of the farmers.
However, a common challenge with survey data collected by means of Likert scale is that they are mostly not normally distributed (Cummins, Citation2003; Ginzburg et al., Citation2019; De Jonge et al., Citation2014). Therefore, there is always the need to normalize these data to ensure validity of the results. The conventional method of Scale Homogenization by Linear Stretch (SHLS) is adopted to transform the raw data prior to the analysis. The SHLS is a “conventional method by which numerical response options are stretched to a common range, from 0 to 10, in such a way that the lowest number assigned to a response option is always projected onto 0 and the highest number onto the highest value (10) of the numerical scale and all intermediate options are given equally distanced numbers in between” (De Jonge et al., Citation2014). Even though the disadvantage of the SHLS is that the method assumes an equal distance, it nonetheless improves the normality of the data. In addition, the SHLS method can transform the data into a standard form ranging from 0 to 100 (Cummins, Citation2003).
3.6. Estimation technique
There are two lines of our analysis. First, I estimate the A common problem often encountered during impact evaluation studies is selection bias due to non-random assignment of subjects which could lead to bias (Eriksen & Lensink, Citation2015). To overcome this limitation, the popular propensity score matching (PSM) for the estimation of the causal inference. The tenets of the PSM analysis are to select both participant (treated) and non-participant (control) farmers of the buffer stock operations marketing program (BSOMP) and match them to identify farmers of the marketing program whose observable characteristics are similar to those farmers who did not participate in the program and measure the difference in their investment behavior of input usage, farm expansion and yields (Baiyegunhi et al., Citation2019).
The PSM technique for causal inference estimation involves three steps: propensity score estimation, matching to estimate the ATT and matching quality assessment (Abbay and Rutten Citation2016). First, the PSM techniques work by generating the propensity score of a subject being assigned to the treatment group (Ren et al., Citation2016). The propensity score is the probability of a farmer to participate in the BSOMP program, predicted by a bivariate probit model. The propensity score for farmer i is defined as (Rosenbaum & Rubin, Citation1983):
where Di = 1 refers BSOMP farmer, denotes response probability ranging between 0 and 1, X is a vector of observable covariates that influence participation in the BSOMP, and
is the parameter to be estimated. The probit model to estimate based on Equationequation (1a)
(1a)
(1a) is specified as:
where β1-12 are the unknown parameters to be estimated and i the error term and variables are as defined in .
The PSM model is underlined by two assumptions. First, the conditional independence assumption which posits that all the covariates, which must be independent of participation in the intervention, are selected (Caliendo & Kopeinig, Citation2008; Soullier & Moustier, Citation2018). The assumption means that selection into the project is based on observable covariates, , which influences participation in the program. This assumption ensures that there are sufficient observations (farmer) who have the same characteristics and propensity score in both the control and treatment groups (Caliendo & Kopeinig, Citation2008; Soullier & Moustier, Citation2018).
Subjects with similar propensity scores are then matched in the second step to estimate the impact. The impact is the difference in the outcome variable between the treated and the control farmers matched by their propensity scores appropriately (Rao et al., Citation2016). There are several algorithms, to do the PSM: radius, caliper and nearest neighbor kernel-based matching. However, none of the algorithms is superior to the other, hence it is a common practice to conduct sensitivity analysis by adopting the different matching methods to estimate the ATT and compare the results as well as the quality of the match (Li et al., Citation2013).
The kernel-based matching method is adopted for the matching. The kernel matching (KM) is a non-parametric estimator. It includes all the samples of the control group and weighs more distant observed characteristics among the control and treated; hence, it indicates lower variance (Caliendo & Kopeinig, Citation2008). Kernel-based matching estimates the impact by comparing each treated with a weighted average of control (Caliendo & Kopeinig, Citation2008). The kernel matching estimates that the impact as (Abokyi et al., Citation2020):
where
where IM is the impact on the investment variable (Farmz, Input and Yield), n is the number of observation, Y1i is investment variable (on Farmz, Input and Yield) of farmers who sold to the BSOMP intervention (treatment) and Yoi is the investment variable of farmers who did not sell maize to the BSOMP intervention but to the open market (control). P1i is the propensity score of farmers who sold their produce to BSOMPi, P0i the propensity score of farmers who did not sell their produce to BSOMP but rather sold to the open market l, G(.) is the Gaussian kernel function, and b is a predefined bandwidth. The advantage of this matching method is the lower variance as more of the controls are used.
The nearest neighbor matching selects the control group with the smallest distance in propensity score to the treated group. The matching is done with replacement, and it works once the distribution of the propensity score of both the control and treated groups are similar (Caliendo & Kopeinig, Citation2008; Dehejia & Wahba, Citation2002). However, this matching may lead to poor matches when the nearest neighbors are far away. The k-nearest neighbor method matches a farmer who sells maize to the BSOMP intervention to a farmer who sells maize in the open market (k ≥ 1) who is closest in terms of the estimated propensity score and estimates the impact of selling maize to BSOMP by comparing the incomes. The impact using nearest neighbor matching is estimated as (Ren et al., Citation2016)
Where IM is the impact investment on Farmz, Input and Yield, n is the number of observations, and the other variables are as defined earlier.
3.7. Matching quality assessment
The next step after the matching is to assess the quality of the matching. This is done by a balance test (Li et al., Citation2013). The balancing test is to verify that the treatment is independent of the covariates after the matching. The PSM method for estimating the ATT aims to balance the characteristics between the treatment and comparison groups (Li et al., Citation2013). We assess the quality based on the mean absolute standardized bias (Rosenbaum & Rubin, Citation1985). MASB is the weighted difference in means, divided by the standard deviation in the original full comparison group (Rubin, Citation2001). The MASB is an overall measure of covariate imbalance. An MASB of less than 20% is an indication of the success of the matching (Rosenbaum & Rubin, Citation1985).
4. Empirical results and discussion
Preceded by the descriptive statistics, the presentation and discussion of the empirical results involves three stages: the bivariate probit model to estimate the propensity score of farmers to determine the factors influencing farmer’s participation in the buffer stock operation marketing program, the matching algorithm to estimate the causal inference (ATT) and the assessment of the matching quality.
4.1. Descriptive statistics
presents the descriptive statistics of the data. shows that the farmers control farmers on the average cultivate an estimated farm size of 2.265 acres (approximately 1 Ha) with the treated farmers cultivating 6.626 acres (2.6 Ha) on the average. In addition, level of input usage by farmers on a 10-point scale is estimated at 5.330 and 6.528 for the control and the treated farmers, respectively. The variables that were measured on a five-point scale were converted to 10-point scale to ensure normalization of the data.
Table 2. Descriptive statistics
The total volume of production (yield) among the farmers is also estimated at 10.5 bags and 27 bags among the control and the treated farmers, respectively. The descriptive statistics in Table further revealed that the age, household size, marital status and the educational levels among the control and the treated farmers do not differ much. The transportation cost for farmer carting their produce to market centers average 49.20 for the control farmers and about 57.20 for the treated farmers. The control farmers and the treated farmers also show the most similar cost in packaging their produce for sales in the open market as well as their engagement in secondary activities to earn non-farm income.
4.2. Bivariate probit results: Participation in buffer stock operations
As a start up to the analysis to estimate the impact, we conducted a PSM analysis to determine the factors that influence the participation in the buffer stock operation program via bivariate probit regression model. The results of the bivariate probit regression model are presented in . The log likelihood (LR) Chi2 and pseudo-R2 for the model indicate an acceptable fit.
Table 3. Participation in buffer stock operations/logit model
The results in showing the results of the probit model of the propensity score matching analysis are presented by showing the coefficients and the marginal effects of the coefficients. The significant marginal effects indicate those variables that have significant effects on the farmer’s decision participation in the buffer stock operations marketing program (BSOMP). The results in indicate that gender has a positive and significant association, at 1% with participation in the buffer stock program with men more likely to participate compared to women. This could be due to the traditional gender role of women who are mostly responsible for marketing of the household’s farm produce and are more likely to have information about other options of market centers to sell the produce. In addition, education has a positive relationship with participation in the program. More educated people are more likely to have information about the program and its price mechanism to inform their decision to participate in the program.
Marital status shows a negative relationship with participation in the program. The negative relationship shows that married people are less likely to sell to their program compared to unmarried people. The reason could be that for unmarried people, labor to visit output market outlet is scarce and hence sell at the farm gate. For those who are married and have a large family size have more labor and the decision taking could involve more people who might have a different view on where to sell their produce and reducing the probability of selling to the program. In addition, for married people, the decision to participate in the buffer stock program could be a joint decision by the couple who might have different views on the sale process, thus reducing the likelihood of selling maize to the buffer stock operations initiative. Also, married people are likely to visit nearby market outlets to shop for their partners compared to an unmarried person and hence will not sell at the farm gate but rather the output market outlet where other non-farm produces are also sold.
further reveals that access to market and participation in the buffer stock operations are positively related implying the farmers who have access to output market outlets are likely not to sell to the buffer stock program because they have alternative outlets which could be better. This finding corroborates the findings of Abokyi et al. (Citation2020) that market access is negatively associated with participation in the program.
With a marginal effect of 0.302, the results indicate that access to extension service has positive and significant association with participation in the BSOMP intervention. The results mean that farmers who have access to extension service are more likely to have more market information on the BSOMP intervention and hence more likely to participate in it. The analysis further reveals that farmers in active farmer association are less likely to sell to the buffer stock program. This view is supported by the findings of Abdul-Rahaman and Abdulai (Citation2020) that active farmer organizations are able to engage in collective marketing decisions and make various options available to them. The collective action by farmers in active farmer association creates a strong bargaining power for the farmers to be able to negotiate for fair prices for their produce and is therefore less likely to participate in the market program like the one under study.
In addition, the results in show that engagement in secondary activities by farmers has inverse relationship with participation in the buffer stock program. A possible reason for this result could be that such farmers have relatively more sources of income (non-farm) to depend on and thus being forced to sell their farm produce and will not be under any force to sell their produce.
4.3. Impacts of buffer stock operations on farmers behavior
To assess the impacts of buffer stock operations on farmer’s investment behavior, we applied the PSM analysis to estimate the average treatment effect (ATT). The covariates in were used for the analysis. The results of the impacts (ATT) following the application of the PSM analysis results are presented in .
Table 4. Impact of BSOMP on farmers’ investment behavior
The results presented in show that four different matching algorithms, kernel, nearest neighbor, radius and caliper, are applied for the estimation of the impacts (ATT). This was to allow for comparison. However, the discussion of the results is restricted to the kernel and the nearest neighbor matchings. The results for the other two matchings; caliper and radius, are for robust checks only.
The results in reveal that, the average treatment effect (ATT), measuring the impact of the program, is 4.432 acre and 4.386 acre for the kernel and the nearest neighbor matching. The results for the nearest neighbor also confirm that the ATT measure and the kernel matching are almost the same. The results mean that for farmers who participate in the buffer stock marketing program, the program helps them increase their farm sizes by at least 4.386 acres. Compared to the control farmers, the results mean that the marketing program motivates farmers to double their farm sizes. While the results show a positive impact on farm expansion, Kotu et al. (Citation2017) reported that, it is becoming increasingly more difficult for farmers to put more land under cultivation due to limited access to land in some parts of Ghana.
However, the results mean that when farmers have the needed market conditions, they will be motivated to put more available land into cultivating the crop for which the farmer has access to efficient market and more profitable. Thus, the impact of the buffer stock operations marketing program (BSOMP) intervention is more likely to be higher for rural farmers who may have access to land more than urban farmers who often do not have access to land due to urbanization and the competing needs of housing for farm lands (Mason & Knowd, Citation2010). Hence, a focus on rural than peri-urban areas for the implementation of the program is a better strategy to derive more impacts of the BSOMP program.
In the case of input usage, the, results of the kernel and nearest neighbor matchings of the PSM analysis yielded an average treatment effect of 1.224 and 1.177, respectively. Compared to the control farmers, the results mean that the beneficiary farmers improve their inputs usage by at least about 22%. The results imply that participating in the program improves farmer’s usage of inputs in general by at least 22%. This has positive implications for yields of the farmer. However, comparing the impact of the program on farm size and input usage, the results revealed that the program has higher impact on farm size than on input usage. The results imply that the influence of the program on farmers’ behavior for input usage is relatively low compared to the impact on investment in expansion in farm sizes. A reason for this finding is the relative low income of smallholders to purchase various inputs. The low investment behavior relating to input usage could also be due to the low farmers’ knowledge about the various inputs to facilitate their adoption.
The farmer’s decision to adopt an input is inherently a dynamic process that is based on past experience as well as future expectations, which is influenced by marketing opportunities, among other things (Grabowski & Kerr, Citation2018; Griffin & Yeager, Citation2019). The key component of the marketing opportunities is the potential price dynamics for which the buffer stock program brings assurance and certainty to. Yang et al. (Citation2020) observed that farmer’s education, access to extension and other factors play vital roles in input usage. Therefore, the 22% influence on farmer’s investment by marketing program is expected.
With a positive impact on farm expansion and input usage, the expectation is improvement in farmers yield. The results in the analysis support this view. In , the results show that, yield of farmers increased. This is a of the expansion in farm size and increased input usage, a consequence of the BSOMP intervention. indicates that the PSM analysis based on the kernel matching yielded an ATT estimate of 17.094 indicating a positive impact of the program on yield. The results mean that the treated farmers had 17.094 bags more than the control farmers.
4.4. The matching quality
The summary results of the quality of the matching is presented in showing the quality indicators. The main indicators are the mean absolute standard bias (MABS) and the Pseudo R2.
Table 5. Summary of the quality of the match
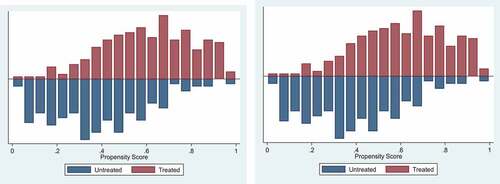
The MASB, which provides an indication of the global comparison of the balance across matching groups (treated and control), is lower for the post-match compared to the pre-match, i.e. 23.00 versus 8.00 and 23 versus 12.20, for the kernel and the nearest matchings, respectively. In addition, the Pseudo R2 after the matching are relatively low indicating the matchings by the PSM were successful. Also, the visual examination of the histograms () of the kernel and the nearest neighbor matchings reveals that there is a substantial overlap of the distribution of the propensity scores for both the treated and the farmers (groups), indicating that the common support condition is satisfied. This further implies that the overall matching procedure is successful.
Figure 3. Propensity score distribution for the kernel-based and nearest neighbor matchings.
5. Conclusion
This paper examined the impacts of the buffer stock operations marketing program (BSOMP) intervention on investment behavior of smallholder farmers. Smallholder investment behavior is measured by farm intensification variable of input usage and extensification variable of increase in the land under cultivation (farm size). The strength of our results in the application of a double robust analytical design to deal with potential selection bias, which may arise in non-randomized studies. First, we adopted the propensity score matching analysis to control for selection biased among the control and the treated farmers to ensure balance in data. Second, we estimated the impact by comparing the outcome of control and treatment groups based on a balanced data.
The results from the PSM-probit analysis show that smallholder farmers’ participation in buffer stock marketing program is influenced positively by transportation cost and access to extension service with men more likely to participate in the program than women. Marital status also shows a negative relationship with participation in the program. Market access, engagement in secondary occupation to earn non-farm income, increased ability of farmers to store own produce and being in active farmer-based organization also has an inverse relation with participation in the buffer stock marketing program. Overall, the results show that the BSOMP intervention has positive impacts on the farmers’ investment behavior of increased input usage, farm expansion and yield smallholder farmers. However, the highest impact is on farm size expansion.
The results of the study provide some policy implications. First, increasing farm size could mean putting more land under cultivation as the buffer stock operations marketing program (BSOMP) program stimulates investment in more land use than input usage. There is a potential risk of land degradation as a consequence. This possible unintended negative impact of the program needs more attention. Second, because the program has a higher impact on farm size than on input usage, a focus on rural areas than peri-urban areas for the implementation of the program is a better strategy to derive more impacts from the buffer stock operations marketing program. A possible review of the program could look at how farmers applying fertilizers could conduct a rapid soil test to assess their fertilizer needs. Future research could look at larger sample that covers a wider geographic spread.
Disclosure statement
No potential conflict of interest was reported by the author(s).
Additional information
Funding
Notes on contributors

Emmanuel Abokyi
Emmanuel Abokyi is an agricultural economist and impact evaluation specialist. He is currently a senior management consultant at the Ghana Institute of Management and Public Administration (GIMPA), Ghana. He holds a PhD from the University of Groningen, Netherlands and Master of Philosophy degree in agricultural economics from the University of Ghana. He also has a BSc degree in agriculture (economics option) from the Kwame Nkrumah University of Science and Technology, Kumasi. He has been involved in the design and implementation of food security projects and their assessments in sub-Saharan Africa. His primary research focus includes food security, impact assessment, monitoring and evaluation, wellbeing (happiness) of farmers, among others. He has evaluated several projects for international and local organizations including the Government of Ghana.
References
- Abbay, A. G., & Rutten, R. (2016). Does spatial proximity to small towns matter for rural livelihood? A propensity scores matching analysis in Ethiopia. Letters in Spatial and Resource Sciences, 9(3), 287–23. https://doi.org/10.1007/s12076-015-0158-y
- Abdul-Rahaman, A., & Abdulai, A. (2020). Farmer groups, collective marketing and smallholder farm performance in rural Ghana. Journal of Agribusiness in Developing and Emerging Economies, 10(5), 511–527. https://doi.org/10.1108/JADEE-07-2019-0095
- Abokyi, E., Strijker, D., Asiedu, K. F., & Daams, M. N. (2020). The impact of output price support on smallholder farmers’ income: Evidence from maize farmers in Ghana. Heliyon, 6(9), e05013. https://doi.org/10.1016/j.heliyon.2020.e05013
- Adanacioglu, H. (2017). Factors affecting farmers’ decisions to participate in direct marketing: A case study of cherry growers in the Kemalpasa District of Izmir, Turkey. Renewable Agriculture and Food Systems, 32(4), 291–305. https://doi.org/10.1017/S1742170516000193
- Akinsete, E., Koundouri, P., & Landis, C. (2022). Modelling the WEF Nexus to support Sustainable Development: An African case. Athens University of Economics and Business. No. 2204
- Almalz, G., Negatu, W., Wale, E., & Ayele, G. (2014). Constraints of vegetables value chain in Ethiopia: A gender perspective. International Journal of Advanced Research in Management and Social Sciences, 3(12), 44–71.
- Ampaire, E. L., Machethe, C. L., & Birachi, E. (2013). The role of rural producer organizations in enhancing market participation of smallholder farmers in Uganda: Enabling and disabling factors. African Journal of Agricultural Research, 8(11), 963–970. http://hdl.handle.net/2263/40558
- Awiti, H. A., Gido, E. O., & Obare, G. A. (2022). Crop mix portfolio response to climate risks: Evidence from smallholder farmers in Kisumu County, Kenya. Agrekon, 611, 192–206. https://doi.org/10.1080/03031853.2022.2028642
- Baiyegunhi, L. J. S., Majokweni, Z. P., & Ferrer, S. R. D. (2019). Impact of outsourced agricultural extension program on smallholder farmers’ net farm income in Msinga, KwaZulu-Natal, South Africa. Technology in Society, 57(2019), 1–7. https://doi.org/10.1016/j.techsoc.2018.11.003
- Barrett, C. B. (2008). Smallholder market participation: Concepts and evidence from eastern and Southern Africa. Food Policy, 33(2008), 299–317. https://doi.org/10.1016/j.foodpol.2007.10.005
- Benjamin, E. O. (2020). Smallholder agricultural investment and productivity under contract farming and customary tenure system: A Malawian perspective. Land, 9(8), 277. https://doi.org/10.3390/land9080277
- Brown, J. C., Hanley, E., Bergtold, J., Caldas, M., Barve, V., Peterson, D., Brunsell, N., Gray, B., Hendricks, N., Brunsell, N., Dobbs, K., Kastens, J., Earnhart, D., & Callihan, R. (2014). Ethanol plant location and intensification vs. extensification of corn cropping in Kansas. Applied Geography, 53, 141–148. https://doi.org/10.1016/j.apgeog.2014.05.021
- Caliendo, M., & Kopeinig, S. (2008). Some practical guidance for the implementation of propensity score matching. Journal of Economic Surveys, 22(1), 31–72. https://doi.org/10.1111/j.1467-6419.2007.00527.x
- Chen, L. J., Hu, S. W., Wang, V., Wen, J., & Ye, C. (2014). The effects of purchasing and price subsidy policies for agricultural products under target zones. Economic Modelling, 43(C), 439–447. https://doi.org/10.1016/j.econmod.2014.09.007
- Chintapalli, P., & Tang, C. S. (2021). The value and cost of crop minimum support price: Farmer and consumer welfare and implementation cost. Management Science, 67(11), 6839–6861. https://doi.org/10.1287/mnsc.2020.3831
- Chintapalli, P., & Tang, C. S. (2022). Crop minimum support price versus cost subsidy: Farmer and consumer welfare. Production and Operations Management, 31(4), 1753–1769. Production and Operations Management. https://doi.org/10.1111/poms.13642
- Christiaensen, L., Demery, L., & Kuhl, J. (2011). The (evolving) role of agriculture in poverty reduction—An empirical perspective. Journal of Development Economics, 96(2), 239–254. https://doi.org/10.1016/j.jdeveco.2010.10.006
- Christiana, O. A. (2021). Gender differences in market participation among small holder sweet potato farmers in South East, Nigeria. International Journal of Agricultural Management and Development, 11(3), 345–355.
- Cummins, R. A. (2003). Normative life satisfaction: Measurement issues and homeostatic model. Social Indicators Research, 64(2), 225–240. https://doi.org/10.1023/A:1024712527648
- Czyżewski, B., & Matuszczak, A. (2016). A new land rent theory for sustainable agriculture. Land Use Policy, 55, 222–229. https://doi.org/10.1016/j.landusepol.2016.04.002
- De Jonge, T., Veenhoven, R., & Arends, L. (2014). Homogenizing responses to different survey questions on the same topic: Proposal of a scale homogenization method using a reference distribution. Social Indicators Research, 117(1), 275–300. https://doi.org/10.1007/s11205-013-0335-6
- Dehejia, R. H., & Wahba, S. (2002). Propensity score-matching methods for nonexperimental causal studies. Review of Economics and Statistics, 84(1), 151–161. https://doi.org/10.1162/003465302317331982
- Dias, L. C., Pimenta, F. M., Santos, A. B., Costa, M. H., & Ladle, R. J. (2016). Patterns of land use, extensification, and intensification of Brazilian agriculture. Global Change Biology, 22(8), 2887–2903. https://doi.org/10.1111/gcb.13314
- Drafor, I., Kunze, D., & Al Hassan, R. 2005. Gender Roles in Farming Systems: An Overview Using Cases from Ghana. Annals of Arid Zone, 44(3&4), 421–439. https://epubs.icar.org.in/index.php/AAZ/article/view/66150
- Erenstein, O. (2006). Intensification or extensification? Factors affecting technology use in peri-urban lowlands along an agro-ecological gradient in West Africa. Agricultural Systems, 90(1–3), 132–158. https://doi.org/10.1016/j.agsy.2005.12.005
- Eriksen, S., & Lensink, R. (2015). Measuring the impact of an ongoing microcredit project: Evidence from a study in Ghana. Journal of Development Effectiveness, 7(4), 519–529.
- Fafchamps, M., & Hill, R. V. (2005). Selling at the farmgate or traveling to market. American Journal of Agricultural Economics, 87(3), 717–734. https://doi.org/10.1111/j.1467-8276.2005.00758.x
- FAO. (2014) . The state of food and agriculture 2014: Innovation in family farming. Food and Agriculture Organization of the United Nations.
- Fuhrimann, S., Van den Brenk, I., Atuhaire, A., Mubeezi, R., Staudacher, P., Huss, A., & Kromhout, H. (2022). Recent pesticide exposure affects sleep: A cross-sectional study among smallholder farmers in Uganda. Environment International, 158, 106878. https://doi.org/10.1016/j.envint.2021.106878
- Garrett, R. D., Lambin, E. F., & Naylor, R. L. (2013). The new economic geography of land use change: Supply chain configurations and land use in the Brazilian Amazon. Land Use Policy, 34, 265–275. https://doi.org/10.1016/j.landusepol.2013.03.011
- Ginzburg, S. B., Schwartz, J., Gerber, R., Deutsch, S., Elkowitz, D. E., Ventura-Dipersia, C., & Lucito, R. (2018). Assessment of medical students’ leadership traits in a problem/case-based learning program. Medical Education Online, 23(1), 1542923. https://doi.org/10.1080/10872981.2018.1542923
- Grabowski, P. P., & Kerr, J. M. (2014). Resource constraints and partial adoption of conservation agriculture by hand-hoe farmers in Mozambique. International Journal of Agricultural Sustainability, 12(1), 37–53. https://doi.org/10.1080/14735903.2013.782703
- Gramzow, A., Sseguya, H., Afari-Sefa, V., Bekunda, M., & Lukumay, P. J. (2018). Taking agricultural technologies to scale: Experiences from a vegetable technology dissemination initiative in Tanzania. International Journal of Agricultural Sustainability, 16(3), 297–309. https://doi.org/10.1080/14735903.2018.1473103
- Griffin, T., & Yeager, E. A. (May 9, 2019). How quickly do farmers adopt technology? A non-parametric duration analysis of Kansas farmers’ adoption. A non-parametric duration analysis of Kansas farmers. Adoption http://dx.doi.org/10.2139/ssrn.3387434
- Guda, H., Dawande, M., Janakiraman, G., & Rajapakshe, T. (2021). An economic analysis of agricultural support prices in developing economies. Production and Operations Management, 30(9), 3036–3053. https://doi.org/10.1111/poms.13416
- Gulati, A., Wardhan, H., & Sharma, P. (2022). Tomato, Onion and Potato (TOP) value chains. In A. Gulati, K. Ganguly, & H. Wardhan (Eds.), Agricultural value chains in India (pp. 33–97). Springer.
- Haile, H. B. (2010). Targeting married women in microfinance programmes: Transforming or reinforcing gender inequalities? Evidence from Ethiopia. Wageningen University and Research.
- Haile, D., Seyoum, A., & Azmeraw, A. (2021). Does building the resilience of rural households reduce multidimensional poverty? Analysis of panel data in Ethiopia. Scientific African, 12, e00788. https://doi.org/10.1016/j.sciaf.2021.e00788
- Hegena, B., & Teshome, A. (2022). Vegetable market supply by small holder farmers in Ethiopia. Cogent Social Sciences, 8(1), 2057058. https://doi.org/10.1080/23311886.2022.2057058
- Ihli, H. J., Gassner, A., & Musshoff, O. (2018). Experimental insights on the investment behavior of small-scale coffee farmers in central Uganda under risk and uncertainty. Journal of Behavioral and Experimental Economics, 75(C), 31–44. https://doi.org/10.1016/j.socec.2018.04.011
- Ioris, A. A. (2016). Rent of agribusiness in the Amazon: A case study from Mato Grosso. Land Use Policy, 100(59), 456–466. https://doi.org/10.1016/j.landusepol.2016.09.019
- Khandker, S. R., Koolwal, G. B., & Samad, H. A. (2009). Handbook on impact evaluation: Quantitative methods and practices. World Bank Publications.
- Kotu, B. H., Alene, A., Manyong, V., Hoeschle-Zeledon, I., & Larbi, A. (2017). Adoption and impacts of sustainable intensification practices in Ghana. International Journal of Agricultural Sustainability, 15(5), 539–554. https://doi.org/10.1080/14735903.2017.1369619
- Kotu, B. H., Oyinbo, O., Hoeschle-Zeledon, I., Nurudeen, A. R., Kizito, F., & Boyubie, B. (2022). Smallholder farmers’ preferences for sustainable intensification attributes in maize production: Evidence from Ghana. World Development, 152, 105789. https://doi.org/10.1016/j.worlddev.2021.105789
- Li, H., Graham, D. J., & Majumdar, A. (2013). The impacts of speed cameras on road accidents: An application of propensity scores matching methods. Accident Analysis and Prevention, 60, 148–157. https://doi.org/10.1016/j.aap.2013.08.003
- Lin, Y. H., Lin, H. I., Wen, F. I., & Sheu, S. J. (2021). The impact of enhancements to weather-forecasting services on agricultural investment behavior: A field experiment in Taiwan. Weather, Climate, and Society, 13(2), 211–226. https://doi.org/10.1175/WCAS-D-20-0101.1
- Lindsjö, K., Mulwafu, W., Andersson Djurfeldt, A., & Joshua, M. K. (2020). Generational dynamics of agricultural intensification in Malawi: Challenges for the youth and elderly smallholder farmers. International Journal of Agricultural Sustainability, 19(5–6), 1–14. https://doi.org/10.1080/14735903.2020.1721237
- Luo, Y., Huang, D., Miao, H., Wu, L., & Zhu, J. (2022). Impact of advanced storage facilities on households’ maize storage losses and food security in China. Environment, Development and Sustainability, 24(1), 221–237. https://doi.org/10.1007/s10668-021-01406-z
- Ma, W., Abdulai, A., & Goetz, R. (2018). Agricultural cooperatives and investment in organic soil amendments and chemical fertilizer in China. American Journal of Agricultural Economics, 100(2), 502–520. https://doi.org/10.1093/ajae/aax079
- Ma, W., & Zheng, H. (2022). Heterogeneous impacts of information technology adoption on pesticide and fertiliser expenditures: Evidence from wheat farmers in China. Australian Journal of Agricultural and Resource Economics, 66(1), 72–92. https://doi.org/10.1111/1467-8489.12446
- Mason, D., & Knowd, I. (2010). The emergence of urban agriculture: Sydney, Australia. International Journal of Agricultural Sustainability, 8(1–2), 62–71. https://doi.org/10.3763/ijas.2009.0474
- Maspaitella, M., Garnevska, E., Siddique, M. I., & Shadbolt, N. (2018). Towards high-value markets: A case study of smallholder vegetable farmers in Indonesia. International Food and Agribusiness Management Review, 21(1), 73–88. https://doi.org/10.22434/IFAMR2017.0011
- Mmbando, F. E., Wale, E. Z., & Baiyegunhi, L. J. (2015). Determinants of smallholder farmers' participation in maize and pigeonpea markets in Tanzania. Agrekon, 54(1), 96–119. https://doi.org/10.1080/03031853.2014.974630
- MoFA. (2017). Agricultural sector progress report for 2017. Ministry of food and agriculture, Government of Ghana.
- Monson, J., Mainville, D. Y., & Kuminoff, N. V. (2008). The decision to direct market: An analysis of small fruit and specialty-product markets in Virginia. Journal of Food Distribution Research, 39(2), 1–11. https://doi.org/10.22004/ag.econ.55971
- Musah, A. B., Bonsu, O. A. Y., & Seini, W. (2014). Market participation of smallholder maize farmers in the upper west region of Ghana. African journal of agricultural research, 9(31), 2427–2435.
- Ndlovu, P. N., Thamaga-Chitja, J. M., & Ojo, T. O. (2022). Impact of value chain participation on household food insecurity among smallholder vegetable farmers in Swayimane KwaZulu-Natal. Scientific African, 16, e01168. https://doi.org/10.1016/j.sciaf.2022.e01168
- Nin-Pratt, A. (2015). Agricultural Intensification in Africa: A regional analysis. IFPRI Discussion Paper 1433. https://doi.org/10.2139/ssrn.2591567
- Nxumalo, K. K. S., Oduniyi, O. S., Antwi, M. A., & Tekana, S. S. (2019). Determinants of market channel choice utilised by maize and sunflower farmers in the North West province, South Africa. Cogent Social Sciences, 5(1), 1678451. https://doi.org/10.1080/23311886.2019.1678451
- Okello, J. J., Kirui, O. K., & Gitonga, Z. M. (2020). Participation in ICT-based market information projects, smallholder farmers’ commercialisation, and agricultural income effects: Findings from Kenya. Development in Practice, 30(8), 1043–1057. https://doi.org/10.1080/09614524.2020.1754340
- Ollenburger, M. H., Descheemaeker, K., Crane, T. A., Sanogo, O. M., & Giller, K. E. (2016). Waking the Sleeping Giant: Agricultural intensification, extensification or stagnation in Mali’s Guinea Savannah. Agricultural Systems, 148(C), 58–70. https://doi.org/10.1016/j.agsy.2016.07.003
- Osebeyo, S. O., & Aye, G. C. (2014). Transaction costs and marketing decision: A case study of smallholder tomato farmers in Makurdi, Nigeria. Urban, Planning, and Transport Research, 2(1), 333–340. https://doi.org/10.1080/21650020.2014.939296
- Pilarova, T., Kandakov, A., & Bavorova, M. (2022). Adaptation of smallholder farmers to climate risks: Remittances and irrigation investment in the Republic of Moldova. Water Resources and Economics, 38, 100200. https://doi.org/10.1016/j.wre.2022.100200
- Poku, A. G., Birner, R., & Gupta, S. (2018). Why do maize farmers in Ghana have a limited choice of improved seed varieties? An assessment of the governance challenges in seed supply. Food Security, 10(1), 27–46. https://doi.org/10.1007/s12571-017-0749-0
- Ramaswami, B., Seshadri, S., & Subramanian, K. V. (2018). The welfare economics of storage-based price supports. Working Paper, Indian Statistical Institute, Delhi, India.
- Rao, E. J., Omondi, I., Karimov, A. A., & Baltenweck, I. (2016). Dairy farm households, processor linkages and household income: The case of dairy hub linkages in East Africa. International Food and Agribusiness Management Review, 19(4), 95–108. https://doi.org/10.22434/IFAMR2014.0177
- Reddy, V. R., Chiranjeevi, T., & Syme, G. (2020). Inclusive sustainable intensification of agriculture in West Bengal, India: Policy and institutional approaches. International Journal of Agricultural Sustainability, 18(1), 70–83. https://doi.org/10.1080/14735903.2019.1698489
- Ren, H., Folmer, H., & van der Vlist, A. J. (2016). The impact of home ownership on life satisfaction in urban China: A propensity score matching analysis. Journal of Happiness Studies, 19(2), 397–422. https://doi.org/10.1007/s10902-016-9826-x
- Ricciardi, V., Ramankutty, N., Mehrabi, Z., Jarvis, L., & Chookolingo, B. (2018). How much of the world’s food do smallholders produce? Global Food Security, 17, 64–72. https://doi.org/10.1016/j.gfs.2018.05.002
- Rosenbaum, P. R., & Rubin, D. B. (1983). The central role of the propensity score in observational studies for causal effects. Biometrika, 70(1), 41–55. https://doi.org/10.1093/biomet/70.1.41
- Rosenbaum, P. R., & Rubin, D. B. (1985). Constructing a control group using multivariate matched sampling methods that incorporate the propensity score. The American Statistician, 39(1), 33–38.
- Rubin, D. B. (2001). Using propensity scores to help design observational studies: Application to the tobacco litigation. Health Services & Outcomes Research Methodology, 2(3–4), 169–188. https://doi.org/10.1023/A:1020363010465
- Shilpi, F., & Umali‐Deininger, D. (2008). Market facilities and agricultural marketing: Evidence from Tamil Nadu, India. Agricultural Economics, 39(3), 281–294. https://doi.org/10.1111/j.1574-0862.2008.00333.x
- Soullier, G., & Moustier, P. (2018). Impacts of contract farming in domestic grain chains on farmer income and food insecurity. Contrasted evidence from Senegal. Food Policy, 79, 179–198. https://doi.org/10.1016/j.foodpol.2018.07.004
- Wolanin, C. A. (2013). Intensity of adoption of direct marketing strategies among fruit and vegetable farmers in Tennessee [Master’s thesis]. University of Tennessee. http://trace.tennessee.edu/utk_gradthes/1698/
- Yang, Q., Zhu, Y., & Wang, J. (2020). Adoption of drip fertigation system and technical efficiency of cherry tomato farmers in Southern China. Journal of Cleaner Production, 275(C), 123980. https://doi.org/10.1016/j.jclepro.2020.123980
- Zhang, Y., Long, H., Li, Y., Ge, D., & Tu, S. (2020b). How does off-farm work affect chemical fertilizer application? Evidence from China’s mountainous and plain areas. Land Use Policy, 99(C), 104848. https://doi.org/10.1016/j.landusepol.2020.104848
- Zhang, S., Sun, Z., Ma, W., & Valentinov, V. (62 2020a). The effect of cooperative membership on agricultural technology adoption in Sichuan, China. China Economic Review, China Econ. Rev 62(C), 101334. https://doi.org/10.1016/j.chieco.2019.101334
