
 ?Mathematical formulae have been encoded as MathML and are displayed in this HTML version using MathJax in order to improve their display. Uncheck the box to turn MathJax off. This feature requires Javascript. Click on a formula to zoom.
Abstract
Our paper investigates the nexus between the CBOE Volatility Index (VIX) and the market leverage of firms listed on the US stock market. Analyzing the yearly database of non-financial US firms from 2000 to 2019, we find that an increase in the VIX index has a positive impact on the leverage of the corporate market. We also find robust evidence that the US-listed firms tend to use more market leverage in the future year when the VIX index ascends. Furthermore, we find a more prominent positive effect of the change in the VIX index on the long-term market leverage than the short-term market leverage. Different approaches for the panel models firmly support our findings. In addition, our research suggests that the implied volatility index is a good proxy to measure investors’ fear of securities investment and provides a good foundation for making the capital structure decisions for the firms listed on the US stock market.
1. Introduction
The CBOE Volatility Index (hereafter, VIX index) built upon the Standard & Poor’s 500 (S&P500) index option and representing the 30-day forecast volatility of the S&P500 index is an indicator introduced by the Chicago Board Options Exchange to measure the volatility risk of the futures market. The VIX index captures investors’ fear of security investment. When the VIX index increases, the stock market tends to adjust downward because of the high turbulence in the US stock market (Whaley, Citation2000). In other words, an increase in the VIX index shows a decreased trend in the returns of the US stock market.
Prior studies demonstrate the negative relationship between the change in the VIX index and the returns in the US stock market. Giot (Citation2005) documents that the implied volatility has a significant connection with the returns of both the S&P100 and NASDAQ100 indexes, especially when the VIX indicator’s response to the returns of the adverse stock market is more pronounced in the low-volatility stages. Fernandes et al. (Citation2014) employ a heterogeneous autoregressive (HAR) process and discover a negative relationship between the VIX index and the S&P 500 index return. Using the cross-section model, Qadan et al. (Citation2019) detect that the VIX index is not only adversely related to the S&P 500 index return, but also has a significantly increasing (decreasing) impact from the VIX impact on the nexus between idiosyncratic volatility and the S&P500 index returns.
In the BRIC markets, Sarwar (Citation2012) finds the immediate adverse nexus between the returns of the Brazilian, Chinese, Indian stock markets and the change in the VIX is much stronger when VIX is enhanced and is more volatile by using the multivariate regression. The VIX has the ability to anticipate the returns in the European stock markets during the 2008 global financial crisis (Sarwar, Citation2014). On the other hand, in the Latin American markets, Sarwar and Khan (Citation2017) use the GARCH model and observe that an increase in the VIX immediately will reduce the returns in the emerging market before, during, and after the 2008 global financial crisis. Moreover, Chandra and Thenmozhi (Citation2015) also find the inverse linkage between the Indian VIX index and Indian stock returns. Most documents assert that the implied volatility index can be used as a proxy for investors’ fear of the security investment. Nevertheless, as far as we know, so far, no research has studied whether implied volatility at different levels could still have a negative link with the returns of the stock markets or whether there is any negative effect from the implied volatility on the returns of the US stock market is more pronounced when implied volatility is more substantial.
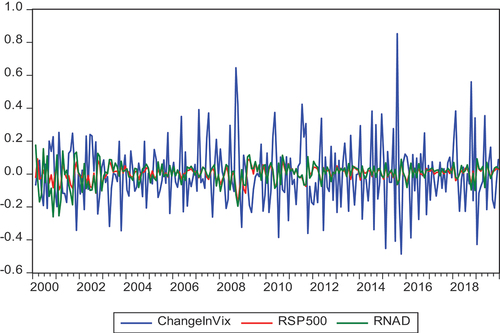
reveals time-series behavior for the changes of both the monthly VIX index and the monthly returns of the US stock market from January 2000 to December 2019. The blue line represents a change in the VIX index, the red and green lines illustrate the S&P500ʹs returns and Nasdaq Composite’s returns, respectively. The figure shows that the movement of the time series is volatile across time. A juicy point from is that the change of the monthly VIX index is inversely and appreciably related to the monthly returns of the US stock market from January 2000 to December 2019. In particular, during the 2008 global financial crisis, it is obvious that there is an opposite movement trend between the VIX index and both the S&P 500 and NASDAQ indexes.
Figure 1. Change in the monthly VIX Index and Monthly US stock index returns (January 2000-December 2019).
Since the stock price is a critical driver in determining capital structure (Whaley, Citation2000), increased stock returns encourage listed enterprises to issue more shares to maximize their market cap. As such, firms with no or low debt ratios have a very small risk to be default or having a very low potential bankruptcy cost; hence, enterprises prefer to reduce their leverage (Huang & Song, Citation2006). When stock prices increase, listed firms prefer to issue stocks than use debts and vice versa (Baker & Wurgler, Citation2002). When the volatility of stock returns enhances, listed firms will face high external capital costs (Domowitz et al., Citation2001). Firms with higher volatility could encounter high external financial distress costs because of their ability to pay off their debts. To avoid possible consequences of default, the companies prefer to reduce financial leverage (Dudley & James, Citation2015). In the nature aspect, VIX is not only a sensitive index of investors on the US stock market, but also an implied volatility index of the US equity market. On the other hand, growth volatility, acting through cost, reduces the expected return of the investment portfolio (Domowitz et al., Citation2001). In addition, when asset prices do not reflect appropriately underlying values, the capital allocation could become inefficient. The issue affects the portfolio allocation decisions of investors for firms whereby it impacts the cost of capital, and it is also more likely to influence the decision-making process of both central banks and government agencies (Smales, Citation2017). Thus, investors could consider using a key driver for determining capital structure in listed firms to solve the problem.
On the other hand, Iqbal et al. (Citation2020) use the VIX index as a macro-uncertainty factor and find out that both the EPU and VIX indexes have negative effects on the performance of the firms listed in the S&P500 index. Their empirical results imply that a rise of the VIX index will reduce the performance of the US-listed firms; resulting in using higher leverage ratios to finance their operations. Liu and Zhang (Citation2015) document that in the US market, enhanced EPU pushes to increase in the volatility of the stock market, inferring that the volatility of the US stock market and the uncertainty of the US economic policy are positively related. Moreover, Schwarz and Dalmácio (Citation2020) point out that the growing uncertainty of economic policy increases Brazilian firms’ leverage. They explain that increased EPU worsens the equity financing environment; hence, the listed firms have higher leverages due to using more debts in their capital structures. The studies suggest that aside from measuring investors’ fear of security investment, the VIX index can also represent an uncertainty index of the macro environment. Its variation is more likely to influence corporates’ finance decisions significantly. To the best of our knowledge, the relationship between the change in the VIX index and the leverage of firms listed on the US stock market has not been investigated to date. The vast majority of current research primarily focused on the nexus between the VIX index and the returns of both the stock index and individual stocks.
To fill in the gap of the current research, our paper contributes to the literature in the following areas: First, we have found clear evidence on the inverse linkage between a variation in the monthly VIX index and US monthly stock returns across different quantiles. Our Ordinary Least Square (OLS) estimation identifies the opposite trend of the two indices in the US equity market. Second, this paper documents that an increase in the VIX index has a significant impact on the market leverages of the US-listed firms by setting a panel sample of the non-financial listed firms of the S&P500 index covering 20 years from 2000 to 2019. We find a positive relationship between the change in the VIX index and market leverages of the listed firms in the S&P500 index. Applying a wide range of panel model techniques, including the pooled OLS with fixed effect, a two-clustering approach, and the regression by instrumental variable (IV) with fixed effect, we document that the relationship is more apparent in the future year. Also, our primary findings confirm the same results on listed firms of the Nasdaq Composite index. To sum up, our study demonstrates that the VIX index not only measures investors’ fear of the US security investment, but also shows a notable influence on US corporate manager decisions through adjusting market leverage of the US-listed firms. Upon unique characteristics in corporate capital structure in advanced countries, a final exciting finding in our research is that the dominant role of the long-term market leverage in adjusting the US-listed firms’ total market leverage when the VIX tends to move up.
This research’s remainders are organized as follows: Section 2 reviews related literature and set research hypotheses. Section 3 discusses our primary data sources, methodology, and describes empirical models. Section 4 presents and analyzes our tested results. Section 5 summarizes our preliminary findings and concludes.
2. Literature review and research hypotheses
CBOE Volatility (VIX) index predicts the US market fears. Hence, higher VIX index degrees are attached with higher levels of US market turbulence (Whaley, Citation2000). The VIX index is also defined as an uncertain index of the US stock market (Sarwar, Citation2012; Sarwar & Khan, Citation2017). Whaley (Citation2009) argues that option buyers control the S&P500 stock options market when they are nervous about a possible stock market decline. VIX options and futures provide securities investors with viable tools to prevent market volatility. In this sense, the negative correlation between change in the VIX index and the US stock market returns is quite common in well-known studies at the market level.
The first study surveys a negative correlation between VIX changes and the S&P100 index’s returns, implying inverse nexus between VIX and US stock market price (Fleming et al., Citation1995). The VIX index’s role as a measure of investor fear in the international stock market has received more attention in subsequent experimental studies. For example, Sarwar (Citation2012) proves that the VIX index is the fear measure for US and BRIC stock markets. Sarwar (Citation2014) indicates the converse relationship between the VIX index’s variation and the European stock market returns. In some emerging markets, the VIX index increase tends to enhance the volatilities and decline stock market returns (Sarwar & Khan, Citation2017, Citation2019). Being distinctive of previous studies implemented on the US market, we investigate a change in the VIX index and the returns of US stock indexes by using conditional quantile regression. We aim to clarify whether the US stock market returns tend to be lower as the VIX index increases. According to that, we propose the first hypothesis, as follows:
H1: The nexus between the variation of the VIX index and US stock indexes’ returns is significantly negative and is heightened at the higher quantile degrees.
There are some studies on capital structure. However, most of the studies in this area approach this topic by using the Pecking-order and Trade-off theories. Their aim is to examine the influence of capital structure determinants on corporate leverage. Accordingly, the negative relationship between debt ratio and profitability is commonly found, implying that when the retained earnings in firms decrease, the companies will increase the usage of external finance (Balios et al., Citation2016; Dang et al., Citation2019; Feng et al., Citation2020; M’ng et al., Citation2017). Later on, the relationship between capital structure and stock returns is a theme that has received more attention in the financial section. For example, Baker and Wurgler (Citation2002) and Welch (Citation2004) demonstrate that the current capital structure is tightly related to historical market values. Stock returns can explain the equity issuance of listed firms. Equity market timing refers to issuing shares at high stock prices and repurchasing at low prices. In addition, Baker and Wurgler (Citation2002) show empirical evidence in which low-leverage firms tend to raise funds when their valuations were high, and conversely, high-leverage firms tend to raise funds when their valuations were low. A large number of studies indicate that stock returns have a negative and significant effect on corporate leverage (Antoniou et al., Citation2008; Deesomsak et al., Citation2004; Penman et al., Citation2007; Yang et al., Citation2010). Moreover, firms tend to issue equity when the cost of equity is relatively low (Jegadeesh, Citation2000) and higher volatility leads to a higher cost of equity (Domowitz et al., Citation2001). Therefore, listed firms will limit the issuance of equity when the implied volatility reaches higher levels.
In comparison, the current leverage is persistently and strongly related to past market values. Firms are more likely to issue equity since their market prices are higher than their historical carry-on or market prices, (Baker & Wurgler, Citation2002), and contrary, the increased uncertainty at the market level substantially negatively affects the firm’s stock returns (Sarwar & Khan, Citation2017, Citation2019). Thereby, it directly increases listed firms’ leverage, this consequence is consistent with the equity-market supply issues hypothesis (Schwarz & Dalmácio, Citation2020). The uncertainty of the US stock market is most likely to impact the corporate decisions of US-listed firms due to their positive relations to the US economic policy uncertainty (Liu & Zhang, Citation2015). On the other hand, Iqbal et al. (Citation2020) show that the US-listed firm’s efficiency has an adverse nexus with the increased VIX index, implying that external financing sources tend to use at the higher level with a higher VIX index. In another typical instance, Li and Qiu (Citation2021) demonstrate that the effect of EPU on debt ratio is not uniform owing to firms having different characteristics. This relationship can be positive for some businesses but negative for others. Araised from the existing literature, we conjecture that an increase in the VIX index will have a significant influence on the capital structure of firms listed on the US stock market; however, its effect direction is still a puzzle.
Supposing that the variation in the VIX index has a significant relationship with the debt ratios of US-listed firms. As previously mentioned, the VIX index can forecast the future US stock returns (Qadan et al., Citation2019; Sarwar & Khan, Citation2019). In a further investigation, we expect that the effect of VIX variation on US corporate leverage is more pronounced for the future. It is obvious that our research is more biased for the issue occurring in the equity market. As a result, we choose market leverage as a proxy of capital structure to capture the effect of the VIX index variation on the capital structure of US-listed firms. The second hypothesis is built as follows:
H2: The change in the VIX index has a positive (negative) impact on the US-listed firms’ current and future market leverages.
Firms operating in markets applying the common law, such as the US market, universally have a higher long-term debt ratio than short-term debt ratio than firms activating in markets using civil law (Cotei et al., Citation2011). Higher information asymmetry leads to more usage of mature debts in firms operating in civil law countries. Long-term debts didn’t tend to decline in large US firms despite the global financial crisis in 2008 (Custódio et al., Citation2013). Hence, it’s impossible to deny the pivotal role of long-term debt in the debt structure of US firms. It also has a higher likelihood that US-listed firms’ long-term debt will be more sensitive to the VIX index change than short-term debt. We examine this expectation in Hypothesis 3 by splitting US-listed firms’ total market leverage into long-term and short-term market leverage.
H3: The VIX index has a higher impact on the long-term market leverage than the short-term market leverage of the US-listed firms.
3. Data, models, and research methodology
3.1. Data
Our data come from different sources. First, we collect the monthly data of the VIX index, S&P500 index, and Nasdaq Composite index from the DataStream source/Thomson Reuter Eikon database for the period from January 2000 to December 2019. We only use the listed companies in the S&P 500 index from 2000 to 2019. Secondly, we get the data of the listed firms in the Nasdaq Composite index and obtain yearly financial information of US non-financial listed firms from the World Scope source/Thomson Reuter Eikon database that can be used to compute firm-characteristic factors.
3.2. Models and research methodology
We follow Li (Citation2010) to use the conditional quantile regression (QR) introduced by Koenker and Bassett (Citation1978) to survey the nexus between a variation in the monthly VIX index and the monthly returns of US stock market indexes across different quantum levels from January 2000 to December 2019 by using the following equation:
in which the Change in the monthly VIX index () is the dependent variable, the monthly US stock market returns (
) is the independent variable that is obtained by using both the returns of the S&P500 Index (RSP500) and the Nasdaq Composite Index (RNAD),
varies from 0 to 1, showing the entire conditional distribution of
on
, and
indicates the sign of nexus between the change in the monthly returns of both the VIX and US stock market indexes at the θ quantile level.
Then, the panel model is designed by using the following equation to examine the relationship between the change in the yearly VIX index and market leverage of US-listed firms:
in which Total Market Leverage ) is specifically divided into the Short-term Market Leverage
and the Long-term Market Leverage
which can be used to examine Hypothesis 3; the Firm-characteristic (
variables consist of five control variables, including
,
,
,
, and
for the US-listed firm (i) at year t; ROA is included because corporate profitability may hinder firms to use more debts as firms have higher retained earnings, prefer to employ lower leverage (Flannery & Rangan, Citation2006); SIZE is used as large firms are able to access external financing with cheaper costs or they have the ability to diversify their financing channels (Kurshev & Strebulaev, Citation2015); TANG is introduced as Firms owning greater tangible assets have the capacity to embrace more debts (Flannery & Rangan, Citation2006). According to Fama and French (Citation2000), firms with higher future growth opportunities, commonly limit using corporate leverage; GROW and MTB are added to control for the firm’s assets growth and the firm’s market value growth; and
and
are the two uncertain proxies for two macro-control variables at year t to, respectively, capture the impact of inflation and economic policy uncertainty on corporate market leverage (Schwarz & Dalmácio, Citation2020). The detailed definitions of the variables used in EquationEquation (2)
(2)
(2) are illustrated in Table .
Table 1. Definition of variables
A key control variable is at year t. so far, no previous literature has proposed the yearly VIX index for this purpose. It is essential to transfer the VIX index’s monthly frequency to the VIX index’s yearly oscillation to be consistent with corporate annual accounting data. Ground for the yearly EPU calculation of Demir and Ersan (Citation2017), we obtain the average of the
index by using the past twelve months VIX; that is,
for year t as shown in the following equation to determine the value of
variable at year t:
We calculate the change, of the yearly VIX index by using the following equation:
The values of the VIF are used to check whether there is any serious multi-collinearity for the panel model. Moreover, we apply the pooled OLS regression for the panel model as shown in Equationequation (2)(2)
(2) with a fixed effect. The validity of the methodology used in our paper is supported by using the Chow test (Pooled versus Fixed effect), Breusch-Pagan LM test (Pooled OLS versus Random effect), and Robust Hausman test (Fixed effect versus Random effect).
Cameron et al. (Citation2006) introduce the pooled OLS estimation by clustering both the firms-fixed and time-fixed effects. The merit of the methodology permits us to observe the panel model from two perspectives. First, if the results from EquationEquation (1)(1)
(1) are compatible with our expectations, the US stock returns govern the change in the VIX index, and thus, the
variable is not a pure exogenous variable. According to Baltagi (Citation2013), we continue to use the two-stage least square (2SLS) regression with the fixed effect to clarify the impact from the
variable on the market leverage of the US-listed firms after using an
instrumental variable to determine an S&P 500 index’s annual returns at year t. Finally, to demonstrate the generality of the experimental results, we carry out EquationEquation (2)
(2)
(2) with another sample of the US-listed firms, namely, Nasdaq Composite’s listed firms in the same period for robust testing.
4. Empirical analyses
4.1. Summary statistics
presents summary statistics and pair correlations of all variables in the main model (EquationEq. 2)(2)
(2) . In Panel A, the mean of market leverage (MLEV) is 0.2053, whereas the average of long-term market leverage (LMLEV) has an overwhelming value is 0.1873. That suggests LMLEV has a dominant role in the capital structure of US-listed firms. The mean values of the firm-control variables, ROA, SIZE, TANG, GROW, MTB, in turn, are, respectively, 0.0646, 16.0691, 0.2860, 0.1350, 2.3178. ∆VIX variable reaches at −0.0231 average value while RSP500 variable has a mean of 0.0443. These figures imply that the stock market value of the S&P500 index tends to increase. Inversely, the fear of US investors tends to decrease covering the period 2000–2019.
Table 2. Summary statistics
Pair correlations are reported in Panel B. While ∆VIX correlates positively with three market leverages (MLEV, LMLEV, and SMLEV), RSP500 has a negative association with all market leverages. Two firm-control variables positively correlate with market leverage (MLEV), namely, SIZE and TANG. The rest corporate variables are adversely correlated with the MLEV variable. Two macro variables (CPI, LNEPU) are positively related to the market leverage (MLEV) variable.
4.2. The change in VIX index and stock market returns
reports the estimated results of EquationEquation (1)(1)
(1) by employing both OLS regression and Quantile regression (QR) at nine various quantile levels (0.1, 0.2, 0.3, 0.4, 0.5, 0.6, 0.6, 0.8, 0.9). In , we draw the estimated coefficients of US stock index returns at the different quantiles and show the 95% confidence interval.
Figure 2. Estimated coefficients and 95% confidence interval.
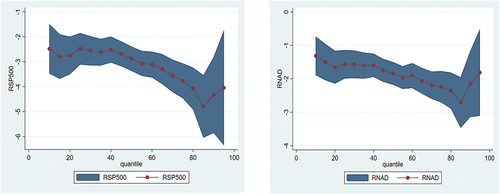
Table 3. Change in the monthly VIX Index and Monthly stock market returns (January 2000 – December 2019)
It’s easy to see that variation in the monthly VIX index (∆VIX) is negatively related to the monthly US stock market returns in both Panel A (S&P500 index) and Panel B (Nasdaq Composite index). The ß coefficients in both Panels A and B become more prominent at higher quantiles. This finding implies when the returns of the S&P500 index (RSP500) reach higher levels, the change in the VIX index moves down at lower degrees. As a sum, applying the quantile regression, we prove that the VIX index is deeply the best fear proxy of US securities investors. Estimated results refer when returns of the stock market increase, the VIX index has a downtrend, showing investor fear lightens. In other words, an increase in the VIX is an indicator of the deterioration of the US equity market. Consequently, the effect of VIX variation on the capital structure is predicted to be converse to the impact of US stock market returns on corporate leverage that is robust to the predictions of Market-Timing Theory.
4.3. The change in VIX index and corporate market leverage
reports the empirical results of EquationEquation (2)(2)
(2) using the pooled OLS with the fixed effect for the panel model.
Table 4. Change in the VIX Index and Market leverages (2000–2019)
Results in Columns 1, 3, and 5 suggest that an increase in the yearly VIX index leads to US-listed firms using three market leverages at higher degrees. The positive coefficients are significantly associated with
,
and
variables at a 1% level, respectively. These results imply that the VIX index does not only represent the uncertainty of the equity market, it is also a crucial macroeconomic factor, which impacts US-listed firms’ capital structure decisions (Korajczyk & Levy, Citation2003). Chau et al. (Citation2016) document that higher implied volatility (VIX) index leads to greater fear and higher uncertainty of the stock market. An increase in VIX index leads to growing risks in securities investors and corporate managers’ rising sensitivity; hence, corporate performance is reduced (Iqbal et al., Citation2020). Additionally, equity cost reflects market investors’ expectations of equity’s cost over an investment project cycle (Câmara et al., Citation2009). When the VIX index tends to rise, the cost of issuing equity is expected to accreted (Domowitz et al., Citation2001). Also, a rise in the VIX index signals a deteriorated prospect for the stock market. Securities investors become cautious in their own investment decisions, causing the stock prices to grow down. Thereby, corporate market leverage positively correlates with a change in the VIX index following the Market-Timing Theory prediction (Antoniou et al., Citation2008; Penman et al., Citation2007). Our findings are broadly compatible with Iqbal et al. (Citation2020)’s inference on the linkage between the VIX index and corporate performance in the US market.
The Market-Timing Theory based on historical prices predicts better the corporate leverage in the future (Baker & Wurgler, Citation2002). It is natural to inquire whether a variation in the yearly VIX index explains US-listed firms’ corporate leverage in the future. In Columns 2, 4, and 6, we regress three market leverage in the next year (,
, and
on the change in the VIX index
. All positive
coefficients with three future market leverage variables in Columns 2, 4, and 6 are significant at a 1% level, and larger relative to the positive
coefficients in Columns 1, 3, and 5. This evidence proves that change in the VIX index has a higher ability to explain US-listed firms’ capital structure in the future. Further, it is observed that the impact of ∆VIX on LMLEV as shown in both Columns 5 and 6 is greater than that of ∆ VIX on SMLEV as shown in both Columns 3 and 4. These results imply the dominant role of long-term market leverage in adjusting the total market leverage of US-listed firms when the VIX index increased context.
For independent variables, variable is positively associated to both
and
variables but negatively associated with
variable. These results suggest that larger US-listed firms prefer to use long-term debts in their debt structure while short-term debts are prioritized in small-scale firms. Conforming with the Pecking-Order Theory,
variable is negatively related to three market leverage variables.
variable has a positive and significant nexus with both
and
variables. By contrast, an inverse linkage between
and
variables accords with the expectation of the Trade-Off Theory. The two opposite relationships between growth opportunities with short-term market leverage and long-term market leverage suggest that US-listed firms with higher growth opportunities usually use more long-term debts than short-term debts to avoid information asymmetric problems. The adverse linkages between
and market leverage variables are significant at a 1% level in all columns, providing strong evidence that is coincided with the Market-Timing Theory (Baker & Wurgler, Citation2002).
and
variables also positively influence corporate market leverage, implying that the higher uncertainty of economic conditions increases US-listed firms’ market leverage.
and
coefficients bolster Schwarz and Dalmácio’s (Citation2020) argument that higher macroeconomic uncertainty makes the equity market deteriorate; thus listed firms tend to use more debts to finance their operations. However, we can see that their effects are not as striking and significant as the impact of the
variable. The positive effect of EPU on the variation of the VIX index is shown more pronounced, providing strong evidence for Schwarz and Dalmácio’s (Citation2020) findings in the Brazilian market.
4.4. Two-clustering approach for panel model
Following Petersen (Citation2009), we adjust the error term ( of EquationEquation (2)
(2)
(2) by employing a two-way clustering approach which is introduced by Cameron et al. (Citation2006). shows empirical results with clustered standard errors at both the firm’s level and time level for the panel model. Empirical results support the positive effect of the yearly VIX index’s variation on market leverage
,
) of US-listed firms. Especially, found results energetically advocate for the positive influence of change in the yearly VIX index on long-term market leverage
when we cluster standard errors at the combination firms-time level. Nonetheless, both
and
variables are insignificantly associated with the
variable as using a two-clustering approach for the panel model. In short, obtained results from applying another technique for the panel model are largely accorded with the results of , but they show explicitly the growing VIX index results in a significant increase in long-term leverage rather than short-term leverage of US-listed firms.
Table 5. Two-clustering approach for panel model (2000–2019)
4.5. IV regression for panel model
A linkage between the variation in the yearly VIX index and market leverage of US-listed firms may potentially endogenous issues. Because stock market returns affect investor sensitivities in the equity market. Hence, we employ a two-stage least square (2SLS) with the fixed effect for the panel model developed by Baltagi (Citation2013) to minimize this issue. reports the found results from IV regression without the lag of control variables (Panel A) and using a lag of control variables (Panel B).
Table 6. IV regression for panel data with a fixed effect (2000–2019)
Columns 1, 3, and 5 present results of the first stage in (both Panels A and B) refer to the inverse nexus between the change in yearly VIX index () and yearly S&P500 index’s returns (
)at a 1% significant level, which are robust to the estimated results by using monthly frequency in . The P-value of the Stock-Wright and Anderson-Rubin tests is strong to dismiss the weak instrument issues.
Columns 2, 4, and 6 of point out the coefficients of instrumented variable in the second stage is positive at a 1% significant level, implying that our major findings are consistent with the endogenous test. The influence of
variable on
variable is more than twice times the effect of
variable on
variable in both Panel A and Panel B. Overall, empirical results in imply that firstly,
variable is an efficient instrument in adjusting the relationship between change in the VIX index and market leverage of US-listed firms; secondly, the VIX index’s positive effect is more evident on long-term market leverage than short-term market leverage of US-listed firms even when we apply the IV regression for the panel model. In other words, the empirical results of firmly assert that when the VIX index ascends, leading to the increased fear of securities investors so that listed firms have difficulty raising equity. Besides, retained earnings of listed firms descend significantly as the VIX index grows up. To meet capital requirements for their operations, listed companies are forced to increase financial leverage through employing more debts.
4.6. Expanded sample
In a larger sample, we examine the impact of change in the VIX index on Nasdaq Composite’s listed firms’ market leverage from 2000 to 2019. present the empirical results of EquationEquation (2)(2)
(2) using the pool OLS with a fixed effect for Nasdaq Composite’s listed firms.
Table 7. Testing on a sample of Nasdaq Composite’s listed firms (2000–2019)
In Columns 4, 5, and 6 of , the reported results show clearly that change in the yearly VIX index impacts positively and significantly on all future market leverages of listed firms of Nasdaq Composite index at a 1% level. The positive coefficient in Column (6) is twice as large as that in Column (5), implicating that a positive effect of the change in VIX index is considerably greater on long-term market leverage than short-term market leverage of Nasdaq Composite’s listed firms in the future year. Unfortunately, the positive influences of
variable on
variables are insignificant in Columns 1, 2, 3 of . These results suggest that the current leverage of Nasdaq Composite’s listed firms is not affected by a variation in the VIX index. Overall, the estimated results of confirm with certainty that a variation in the VIX index will have more positive and pronounced effects on future market leverage. In simple terms, our main results are robust to the different samples of US-listed firms.
5. Concluding remarks and discussions
Finding the determinants of the capital structure is an important decision that corporate managers encounter. A variation in debt ratio could have big impacts on the firm’s financing structure, financial distress cost, investment decisions, and shareholder values. Market-timing theory suggests that changes in stock price influence issuing equity, thereby significantly affecting a firm’s leverage decisions. Baker and Wurgler (Citation2002) provide evidence supporting the equity market timing hypothesis that debt ratio is inversely associated with historical market-to-book ratio. At the financial market, the CBOE Volatility Index (VIX) is a well-known indicator of future volatility for investors in the US stock market (Zhu et al., Citation2019). It is most likely that the growing VIX index changes corporate manager decisions on capital structure.
Our findings could draw inferences on two matters in the related finance field. First, we confirm the relationship between the VIX index and the US stock index returns at various volatility degrees to ensure that the VIX is genuinely the best measure for the fear of US investors. To fill a current gap in the corporate finance aspect, we explore whether an increase in the VIX index effect on leverage of listed firms on the US stock market. Upon the inherent characteristics of the US companies, we discover that the pronounced impact of the VIX is more on the long-term leverage than short-term leverage. On the other hand, consistent with the findings in Li (Citation2010), at the market level, our results demonstrate that the higher implied volatility (VIX) significantly relates to the lower returns of the US stock market indexes for the period from January 2000 to December 2019 through conditional quantile regression. This paper investigates the link between the VIX index and the market leverage of firms listed on the US stock market from the listed firm-level perspective. We demonstrate that the change in the VIX index has a significant and positive effect on the US-listed firms’ futures market leverages. Besides, we detect that the long-term debts of the US-listed firms are more sensitive to the variation in the VIX index than the short-term debts. Furthermore, the findings are robust to various techniques for the panel models and different samples of the US-listed firms covering the period from 2000 to 2019.
Our paper has some contributions to the literature and provides some practical implications. Our first contribution to the literature is that, as far as we know, our paper is the first empirical study to find the increased impact of the VIX index on the corporate market leverage of the US-listed firms by using the VIX index’s inherent characters and employing the predictions of the Market-Timing Theory. Second, our empirical results provide some implications on the choices of capital structure when US corporate managers face increasing implied volatility in the US equity market. Finally, our findings recommend US policymakers adopt different policies to control the variation in the VIX indicator in the financial market because the change of the indicator could considerably influence both decisions of US securities investors and US corporate managers.
A possible limitation of our study is that we cannot get the quarterly data of the US-listed companies, and thus, we cannot employ any robust test to examine the relationship between the VIX index and the market leverage of the US-listed firms at different frequencies. Thus, an extension of our paper is to obtain the quarterly data of the US-listed companies so that one could employ robust tests to examine the relationship between the VIX index and the market leverage of the US-listed firms at different frequencies.
Acknowledgement
The authors thank anonymous referees and the handling editor for their helpful comments, which help to improve our manuscript significantly. The third author would like to thank Robert B. Miller and Howard E. Thompson for their continuous guidance and encouragement. This research has been supported by the Banking University of Ho Chi Minh City, Nha Trang University, Asia University, China Medical University Hospital, The Hang Seng University of Hong Kong, Research Grants Council (RGC) of Hong Kong (project numbers 12502814 and 12500915), and Ministry of Science and Technology (MOST, Project Numbers 106-2410-H-468-002 and 107-2410-H-468-002-MY3), Taiwan. However, any remaining errors are solely ours.
Disclosure statement
No potential conflict of interest was reported by the author(s).
Additional information
Funding
References
- Antoniou, A., Guney, Y., & Paudyal, K. (2008). The determinants of capital structure: Capital market-oriented versus bank-oriented institutions. Journal of Financial and Quantitative Analysis, 43(1), 59–22. https://doi.org/10.1017/S0022109000002751
- Baker, M., & Wurgler, J. (2002). Market timing and capital structure. The Journal of Finance, 57(1), 1–32. https://doi.org/10.1111/1540-6261.00414
- Balios, D., Daskalakis, N., Eriotis, N., & Vasiliou, D. (2016). SMEs capital structure determinants during severe economic crisis: The case of Greece. Cogent Economics & Finance, 4(1), 1145535. https://doi.org/10.1080/23322039.2016.1145535
- Baltagi, B. H. (2013). Econometric analysis of panel data (5th ed.). Wiley.
- Câmara, A., Chung, S. L., & Wang, Y. H. (2009). Option implied cost of equity and its properties. Journal of Futures Markets: Futures, Options, and Other Derivative Products, 29(7), 599–629. https://doi.org/10.1002/fut.20372
- Cameron, A. C., Gelbach, J. B., & Miller, D. L. (2006). Robust inference with multi-way clustering technical working Paper No. 327: National Bureau of Economic Research, Cambridge.
- Chandra, A., & Thenmozhi, M. (2015). On the asymmetric relationship of India volatility index (India VIX) with stock market return and risk management. Decision, 42(1), 33–55. https://doi.org/10.1007/s40622-014-0070-0
- Chau, F., Deesomsak, R., & Koutmos, D. (2016). Does investor sentiment really matter? International Review of Financial Analysis, 48(1), 221–232. https://doi.org/10.1016/j.irfa.2016.10.003
- Cotei, C., Farhat, J., & Abugri, B. A. (2011). Testing trade‐off and pecking order models of capital structure: Does legal system matter? Managerial Finance.
- Custódio, C., Ferreira, M. A., & Laureano, L. (2013). Why are US firms using more short-term debt? Journal of Financial Economics, 108(1), 182–212. https://doi.org/10.1016/j.jfineco.2012.10.009
- Dang, T. L., Ly Ho, H., Dzung Lam, C., Thao Tran, T., & Vo, X. V. (2019). Stock liquidity and capital structure: International evidence. Cogent Economics & Finance, 7(1), 1587804. https://doi.org/10.1080/23322039.2019.1587804
- Deesomsak, R., Paudyal, K., & Pescetto, G. (2004). The determinants of capital structure: Evidence from the Asia Pacific region. Journal of Multinational Financial Management, 14(4–5), 387–405. https://doi.org/10.1016/j.mulfin.2004.03.001
- Demir, E., & Ersan, O. (2017). Economic policy uncertainty and cash holdings: Evidence from BRIC countries. Emerging Markets Review, 33(2017), 189–200. https://doi.org/10.1016/j.ememar.2017.08.001
- Domowitz, I., Glen, J., & Madhavan, A. (2001). Liquidity, volatility and equity trading costs across countries and over time. International Finance, 4(2), 221–255. https://doi.org/10.1111/1468-2362.00072
- Dudley, E., & James, C. M. (2015). Cash flow volatility and capital structure choice. SSRN Electronic Journal. 1–60. https://ssrn.com/abstract=2492152
- Fama, E. F., & French, K. R. (2000). Forecasting profitability and earnings. The Journal of Business, 73(2), 161–175. https://doi.org/10.1086/209638
- Feng, Y., Hassan, A., & Elamer, A. A. (2020). Corporate governance, ownership structure and capital structure: Evidence from Chinese real estate listed companies. International Journal of Accounting & Information Management, 28(4), 759–783. https://doi.org/10.1108/IJAIM-04-2020-0042
- Fernandes, M., Medeiros, M. C., & Scharth, M. (2014). Modeling and predicting the CBOE market volatility index. Journal of Banking & Finance, 40(2014), 1–10. https://doi.org/10.1016/j.jbankfin.2013.11.004
- Flannery, M. J., & Rangan, K. P. (2006). Partial adjustment toward target capital structures. Journal of Financial Economics, 79(3), 469–506. https://doi.org/10.1016/j.jfineco.2005.03.004
- Fleming, J., Ostdiek, B., & Whaley, R. E. (1995). Predicting stock market volatility: A new measure. Journal of Futures Markets, 15(3), 265–302. https://doi.org/10.1002/fut.3990150303
- Giot, P. (2005). Relationships between implied volatility indexes and stock index returns. The Journal of Portfolio Management, 31(3), 92–100. https://doi.org/10.3905/jpm.2005.500363
- Huang, S. G., & song, F. M. (2006). The determinants of capital structure: Evidence from China. China Economic Review, 17(1), 14–36. https://doi.org/10.1016/j.chieco.2005.02.007.
- Iqbal, U., Gan, C., & Nadeem, M. (2020). Economic policy uncertainty and firm performance. Applied Economics Letters, 27(10), 765–770. https://doi.org/10.1080/13504851.2019.1645272
- Jegadeesh, N. (2000). Long-term performance of seasoned equity offerings: Benchmark errors and biases in expectations. Financial Management, 29(3), 5–30. https://doi.org/10.2307/3666227
- Koenker, R., & Bassett, G.,sJr. (1978). Regression quantiles. Econometrica: Journal of the Econometric Society, 46(1), 33–50. https://doi.org/10.2307/1913643
- Korajczyk, R. A., & Levy, A. (2003). Capital structure choice: Macroeconomic conditions and financial constraints. Journal of Financial Economics, 68(1), 75–109. https://doi.org/10.1016/S0304-405X(02)00249-0
- Kurshev, A., & Strebulaev, I. A. (2015). Firm size and capital structure. Quarterly Journal of Finance, 5(3), 1550008. https://doi.org/10.1142/S2010139215500081
- Li, M. Y. L. (2010). Re-examining the risk-return relationship in banks using quantile regression. The Service Industries Journal, 30(11), 1871–1881. https://doi.org/10.1080/02642060802626865
- Li, X. M., & Qiu, M. (2021). The joint effects of economic policy uncertainty and firm characteristics on capital structure: Evidence from US firms. Journal of International Money and Finance, 110(2021), 102279. https://doi.org/10.1016/j.jimonfin.2020.102279
- Liu, L., & Zhang, T. (2015). Economic policy uncertainty and stock market volatility. Finance Research Letters, 15(2015), 99–105. https://doi.org/10.1016/j.frl.2015.08.009
- M’ng, J. C. P., Rahman, M., & Sannacy, S. (2017). The determinants of capital structure: Evidence from public listed companies in Malaysia, Singapore and Thailand. Cogent Economics & Finance, 5(1), 1418609. https://doi.org/10.1080/23322039.2017.1418609
- Penman, S. H., Richardson, S. A., & Tuna, I. (2007). The book‐to‐price effect in stock returns: Accounting for leverage. Journal of Accounting Research, 45(2), 427–467. https://doi.org/10.1111/j.1475-679X.2007.00240.x
- Petersen, M. A. (2009). Estimating standard errors in finance panel data sets: Comparing approaches. The Review of Financial Studies, 22(1), 435–480. https://doi.org/10.1093/rfs/hhn053
- Qadan, M., Kliger, D., & Chen, N. (2019). Idiosyncratic volatility, the VIX and stock returns. The North American Journal of Economics and Finance, 47(2019), 431–441. https://doi.org/10.1016/j.najef.2018.06.003
- Sarwar, G. (2012). Is VIX an investor fear gauge in BRIC equity markets? Journal of Multinational Financial Management, 22(3), 55–65. https://doi.org/10.1016/j.mulfin.2012.01.003
- Sarwar, G. (2014). US stock market uncertainty and cross-market European stock returns. Journal of Multinational Financial Management, 28(2014), 1–14. https://doi.org/10.1016/j.mulfin.2014.07.001
- Sarwar, G., & Khan, W. (2017). The effect of US stock market uncertainty on emerging market returns. Emerging Markets Finance and Trade, 53(8), 1796–1811. https://doi.org/10.1080/1540496X.2016.1180592
- Sarwar, G., & Khan, W. (2019). Interrelations of US market fears and emerging markets returns: Global evidence. International Journal of Finance & Economics, 24(1), 527–539. https://doi.org/10.1002/ijfe.1677
- Schwarz, L. A. D., & Dalmácio, F. Z. (2020). The relationship between economic policy uncertainty and corporate leverage: Evidence from Brazil. Finance Research Letters, 40(2021). https://doi.org/10.1016/j.frl.2020.101676
- Smales, L. A. (2017). The importance of fear: Investor sentiment and stock market returns. Applied Economics, 49(34), 3395–3421. https://doi.org/10.1080/00036846.2016.1259754
- Welch, I. (2004). Capital structure and stock returns. The Journal of Political Economy, 112(1), 106–131. https://doi.org/10.1086/379933
- Whaley, R. E. (2000). The Investor Fear Gauge. The Journal of Portfolio Management, 26(3), 12–17. https://doi.org/10.3905/jpm.2000.319728
- Whaley, R. E. (2009). Understanding the VIX. The Journal of Portfolio Management, 35(3), 98–105. https://doi.org/10.3905/JPM.2009.35.3.098
- Yang, C. C., Lee, C. F., Gu, Y. X., & Lee, Y. W. (2010). Co-determination of capital structure and stock returns—A LISREL approach: An empirical test of Taiwan stock markets. The Quarterly Review of Economics and Finance, 50(2), 222–233. https://doi.org/10.1016/j.qref.2009.12.001
- Zhu, S., Liu, Q., Wang, Y., Wei, Y., & Wei, G. (2019). Which fear index matters for predicting US stock market volatilities: Text-counts or option based measurement? Physica A: Statistical Mechanics and Its Applications, 536(2019), 122567. https://doi.org/10.1016/j.physa.2019.122567