
 ?Mathematical formulae have been encoded as MathML and are displayed in this HTML version using MathJax in order to improve their display. Uncheck the box to turn MathJax off. This feature requires Javascript. Click on a formula to zoom.
Abstract
We examine the time-frequency lead–lag relationships and the degree of integration between the US financial stress index and global commodity prices (i.e., oil, gold, silver, and cocoa) with data covering over 47 decades (January 1975 to December 2021). For this purpose, we resort to the bi- and multiple wavelet econometric approaches. Findings from the bivariate wavelet analysis evidence the significant influence of the US financial stress in driving the price-generating process in commodities markets. Our findings support the hedging abilities of commodities across the time-frequency space. Findings from the multiple correlations explicate that the interrelation between the commodities and financial stress is attributable to their interdependence in the long term during financial market meltdowns. The dynamic and nonhomogeneous lead/lag relations underscored by our findings highlight the importance of cross-commodity investments. As such, by acknowledging the response of different commodities to financial stress, asset allocation should factor in commodities that offer opposing responses to a financial stress to hedge downside risks associated with portfolios. Our findings are of interest to regulators, risk managers, investors, and commodities producers.
PUBLIC INTEREST STATEMENT
Amid the episodic financial market meltdowns in recent decades, there has been a continuous effort to address the consequences of financial imbalance on financial and economic activities. Among economic and financial agents, the responses offered to the effect of financial stress on commodities prices are largely dependent on their degree of risk aversion and trading horizons. Therefore, gaining insights into the transmission effect of market stress on commodities prices is very pivotal for policymakers, risk managers, and investors against the backdrop of the debatable financialisation hypothesis and the economic implication of financial uncertainty in systemic crisis periods. We provide a quota of evidence to the embryonic debate on the financialisation hypothesis. We employ a set of wavelet techniques to assess the comovements between financial stress and commodities prices utilising datasets covering over 47 decades. Findings from the study support dynamic comovement patterns between the US financial stress and global commodities prices, stressing the need for cross-commodity investments to mitigate downside risks in periods of financial turbulence.
1. Introduction
The subprime crisis attributable to the US subprime mortgage market between the period 2007–2009 and the subsequent European debt crisis in 2010–2012 has reignited the debate for which the financial stress index has gained prominence in recent literature. Premised on its predictability on the macroeconomy, the pivotal role of financial stress (FS) as a predictor of uncertainty and unforeseen shocks in financial markets has been emphasised (H. H. Zhang & Wang, Citation2021). Compared to the VIX, the global financial stress index more accurately measures global stress (Bouri et al., Citation2018). The 2007–2009 subprime crisis, the 2010–2012 European debt crisis, pandemics, geopolitical crises, and high and low inflation periods, among others, create momentous uncertainty that propagates contagion risk in global financial markets and intense economic downturn (Yarovaya et al., Citation2016). These crisis periods intensify financial stress across global financial markets (Shehzad et al., Citation2021), emphasising the need for investors to safeguard the value of their investments.
The need to protect portfolios against downside risks, which are predominantly intense during stressed periods, motivates empirical assessments of the hedging abilities of different asset classes, mainly commodities (Zaremba et al., Citation2019). Global commodities are not only considered for their fundamental usage but also as a potential for hedge during stressed periods (Asafo-Adjei et al., Citation2022; Umar, Gubareva, et al., Citation2021). Yet, the empirical literature on the financial stress-financial asset nexus is still embryonic (see, e.g., Bouri et al., Citation2018; Chen et al., Citation2014; Das et al., Citation2018; District, Citation2015; Gkillas et al., Citation2020; He et al., Citation2021; Liu et al., Citation2020); and the references therein).
The above contributions from the extant literature on the relationship between financial stress and financial assets are limited by the extensive use of time-domain approaches,Footnote1 which are unable to simultaneously examine the dynamics of comovements between variables that are connected in both time and frequency spectrums (Asafo-Adjei et al., Citation2020). Time-domain-biased techniques fail to account for heterogeneity among market participants and the intricate complexities shared by financial markets (Agyei, Owusu Junior et al., Citation2022; Agyei, Bossman, Asafo-Adjei, et al., Citation2022; Bossman, Agyei et al., Citation2022; Bossman, Umar et al., Citation2022) and, hence, make it difficult to assess the convoluted comovements between financial stress and financial assets across investment horizons. As the fractal market hypothesis (FMH; Peters, Citation1994) explicates, market participants’ reactions are nonhomogeneous across trading horizons because the transmission of information across markets varies with trading horizons (Kristoufek, Citation2013).
Motivated by the recent episodes of financial market meltdowns over the past few decades and the debateFootnote2 surrounding the commodity financialisation literature (Zaremba, Umar et al., Citation2021), we extend the financial stress-commodities literature by employing datasets covering over 47 decades to ascertain the evolution and dynamics of comovements and lead–lag relationships between financial stress and commodities prices in a time-frequency paradigm. Information spillovers, which cause heterogeneity in market participants’ responses across investment horizons, intensify during turbulent trading periods (Agyei, Owusu Junior et al., Citation2022; Bossman, Citation2021). To account for these complexities, we employ econometric approaches, the bi- and multiple wavelet techniques, which are robust and make no assumptions about the distributional properties of the time series under study (Agyei, Bossman, et al., Citation2022; Bossman, Adam et al., Citation2022; Umar, Gubareva, Sokolova et al., Citation2021; Umar, Gubareva et al., Citation2022).
The study’s contributions are threefold. First, we employ time-frequency analysis to reveal the behaviour of commodity prices during market stress periods not only across different time spectrums but also across different trading horizons, which are portrayed by frequency bands. This offers valuable information for time- and horizon-based investors who are very particular about the hedging properties of assets across the long, medium, and short term. Second, we employ multiple wavelets to examine the interdependence between FS and global commodity prices. This allows us to assess the lead and/or lag variable to influence policy and investment decisions. Finally, novel to the financial stress-commodities markets literature, we ascertain the overall interdependence between essential commodities and financial stress in a scale-dependent paradigm. For this purpose, the wavelet multiple correlations and cross-correlations (i.e., WMC and WMCC) techniques are utilised along with the bi-wavelet analysis.
From the bi-wavelet analysis, our findings indicate that the price- and return-generating dynamics in commodities markets are significantly driven by financial stress with much intensity in key market event periods. We reveal findings that support the hedging abilities of commodities across the time-frequency space. From the WMC, we note that the interdependence between commodities and financial stress increases with reducing frequencies, which are representative of the long-term trading horizon. Our WMCC results provide evidence that the US FSI is predominantly influential in the post-GFC era, as it takes on the potential lead series across most wavelet scales.
To organise our paper, Section 2 reviews the existing literature, Section 3 details the methodology, Section 4 introduces the datasets, Section 5 discusses the empirical findings, and Section 6 concludes with policy implications.
2. Literature
There has been a proliferation of empirical work on the financial stress index (FSI) following the turmoil that occurred in the US between the period 2007–2009. The turmoil unbridles a full-blown systemic crisis accompanied by increases in global risk aversion, leading to a financial imbalance in the global economy. This amplified the volume of studies on financial stress. Notable strands of literature have been documented after the measurement of the financial stress of individual countries (Aboura & Roye, Citation2017; Illing & Liu, Citation2006) and multiple countries (Apostolakis & Papadopoulos, Citation2014; Cardarelli et al., Citation2011; Cevik et al., Citation2016; Elsayed & Yarovaya, Citation2019). Based on the quantified financial stress index, a set of evidence of how financial stress impacts real economic activity has been examined (see, e.g., Ferrer et al., Citation2018; Das et al., Citation2019; Hubrich & Tetlow, Citation2015; Davig & Hakkio, Citation2010; and the references therein). The common conclusion from these studies largely underscores the significant impacts of financial stress on economic activity.
In situating our review in the context of financial markets, we note that the present study falls in line with several documented strands of literature. We provide a review of the relevant works from these documented strands in two major subsections as follows.
2.1. Financial stress (FS) and global commodity prices
The extreme impact of the 2007–2009 financial crises did not only provide a unique challenge but also inspired a new stream of literature focused on the impact of financial market stress on global commodity markets. Chen et al. (Citation2014) analysed the financial stress index, global real economic activity, real oil prices, and global oil production using the Kansas City Financial Stress Index (KCFSI). The study concludes that FS shocks trigger a significant negative response in real oil prices. Liu et al. (Citation2020) used the Markov regime-switching model to empirically examine the non-linear effect of oil prices on China’s financial stress index. The authors find that oil price shocks have a significant effect on China’s financial stress index across different regimes.
Nazlioglu et al. (Citation2015) employed the volatility spillover of causality test proposed by Hafner and Herwartz (Citation2006) to examine whether there is volatility transmission between oil prices and FS. The authors reported significant shock transmission from oil prices to FS before the crisis period and after the crisis. The impulse response function utilised in the study indicated that volatility transmission followed a similar dynamic pattern before and after the crisis and emphasised that the transmission is characterised by higher and longer-lived effects during crises. Gkillas et al. (Citation2020) employed a heterogeneous autoregressive model of realised volatility to empirically investigate the power of FS in forecasting the realised volatility of the oil market based on 5-minute intraday data covering the period from 4 January 2000 to 26 May 2017. The results indicated that FS indexes do have a predictive value for realising oil price volatility.
Based on its ability to reveal asymmetric relationships (Alsubaie et al., Citation2022; Assifuah-Nunoo et al., Citation2022; Bossman, Umar et al., Citation2022; Umar, Bossman et al., Citation2022), the use of quantile regression has become another popular approach to investigating the relationship between global commodities and FS. Das et al. (Citation2018) examined the dependence structure of global commodities (gold and oil) on FS under the causality-in-quantiles approach with data covering the period 1993–2017. The study found a bi-causal effect in means and variances between oil and gold and FS. Bouri et al. (Citation2018) employed different techniques to uncover the quantile conditional dependence between FS and bitcoin returns from July 2010 to December 2017. The findings of the copula-based dependence approach showed evidence of the right-tail dependence between global FS and bitcoin. The study also found that global FS strongly Granger-causes bitcoin returns at both the left and right tails of the distribution of bitcoin.
Furthermore, Kocaarslan et al. (Citation2019) argued that the GFC leads to changes in the dependence structure between FS and oil and gold prices in the BRIC economy. In the same vein, Reboredo and Uddin (Citation2015) also used quantile regression technique to investigate the impact of FS on metals and energy commodities. The authors concluded that FS had a Granger causality effect on commodity returns but no evidence was found concerning the comovements between FS and commodity prices. He et al. (Citation2021) applied the quantile autoregressive distribution lag approach to investigate the relationship between clean stock returns and oil price volatility, gold prices, and FS in the US and European economies. Long-term results reveal that FS has a significant negative effect on the clean energy of the United States and Europe in the lower quantile. The authors also found that the negative effect of FS on clean energy is predominant across the higher quantiles for European markets and lower quantiles for their United States counterparts.
In general, although the existing literature documents that FS affects the global commodity prices, most of these studies focused on the time-domain aspect of the data and fail to capture the time and frequency domains simultaneously. The importance of the effect of FS on global commodities may also be triggered by multiple agents with heterogeneous time horizons (Ferrer et al., Citation2018). We note that the complexities in financial markets result in heterogeneous responses from investors based on the horizon on which they operate (Bossman, Owusu Junior et al., Citation2022; Bossman, Umar et al., Citation2022).
2.2. Commodity hedging and financialisation in systemic crisis periods
The intensity of the shocks experienced by financial markets in the past decade motivates a set of widely documented literature on commodity financialisation and the hedging potential of commodities. These works can be classified into (i) those that contend with the financialisation hypothesis; (ii) those that examine the link between oil price shocks and other commodity groups; and (iii) those that test the hedging abilities of commodities against inflationary shocks and pandemic-induced systemic shocks.
Zaremba, Szczygielski, et al. (Citation2021) ascertained the cross-commodity connectedness using datasets on 48 commodities spanning two centuries (1850–2019). The overriding objective of the study was to put to test the financialisation hypothesis, which argues that with the introduction of commodities into financial markets amid traditional assets, commodities share similar traits in terms of the pricing and returns generating dynamics, thus exhibiting high correlations in recent periods (Tang & Xiong, Citation2012). From their analysis, which covers two centuries, Zaremba et al. (Citation2021) reveal that the cross-commodity connectedness has existed in earlier periods and, thus, is not a new phenomenon as the proponents of the financialisation hypothesis contend (Cheng et al., Citation2013; Demirer et al., Citation2015; Tang & Xiong, Citation2012). The findings of Zaremba et al. (Citation2021) are supported by the observations made by Umar, Riaz et al. (Citation2021) when they quantified the dynamics of spillovers between nine commodity classes with a two-century-long dataset. In their study of the cross-connectedness between commodities under a wavelet framework, with datasets covering seven centuries, Umar, Zaremba et al. (Citation2022) underscore the leading role of energy commodities with increasing intensity across time.
The set of documented studies on the link between oil price shocks and other commodity groups is motivated by the leading role of energy commodities in recent periods. Umar et al. (Citation2019) explored the dynamics of connectedness between prices of crude oil and metal in a time- and frequency-varying GARCH-based framework, with monthly datasets spanning the period 1980–2017. The authors emphasise that the connectedness between oil and metal commodities varies with time and frequency. In a similar study, Umar, Jareño et al. (Citation2021) probe into the spillover patterns between oil price shocks and industrial and precious groups of metals. With datasets covering the period from 2 January 2009 to 17 July 2020, the authors reveal increased time-varying spillovers at the apogee of the COVID-19 health crisis, signalling that movements in global financial stress could significantly drive commodities prices. By extension, Umar, Gubareva, Naeem et al. (Citation2021) explore how oil price shocks connect with agricultural commodities in a spillover connectedness model. Their findings of increasing connectedness in periods of the financial crisis were in support of Umar, Jareño et al.’s (Citation2021) observation when metals were modelled together with oil price shocks.
In the third set of documented works, the hedging abilities of commodities have been tested across several financial crisis periods. The works of Spierdijk and Umar (Citation2013), Zaremba et al. (Citation2019), and Zaremba, Szczygielski et al. (Citation2021) focus on inflationary periods in the UK and the US, while those of Umar, Gubareva et al. (Citation2021) and Esparcia et al. (Citation2022) focus on pandemic periods. Common to these works, diversification potentials for commodities were confirmed at varying times and frequencies. With little evidence of how commodities comove with financial stress index in a time-frequency paradigm, we extend this strand of literature by investigating the comovement and lead/lag dynamics between financial stress index, which is a better measure of worldwide stress than VIX or other sub-proxies. We accomplish this using the robust bi- and multiple wavelet techniques for datasets on gold, oil, silver, and cocoa spanning across 47 decades.
3. Methodology
A natural concept of financial time series is the notion of multiscale features, which may contain several structures occurring on different timescales. The wavelet method possesses an inherent ability to decompose financial time series into different components which may be associated with a particular timescale. By decomposing the time series into time-frequency space, one can determine the overriding modes of variability and how these modes vary in time (Torrence & Compo, Citation1998). This kind of technology provides a valuable alternative to the time series and frequency domain method, which is useful in processing nonstationary signals such as global commodity prices and a financial market that exhibits changing frequency over time.
The wavelet function is used to refer to nonorthogonal or orthogonal transforms. The nonorthogonal implies either the use of discrete or continuous wavelet, while orthogonal implies the use of discrete wavelet transform (Farge, Citation1992). The nonorthogonal transform applies to time series where a smooth continuous wavelet amplitude is expected, while orthogonal applies to time series that produce a different wavelet spectrum (Torrence & Compo, Citation1998).
This study makes use of the continuous wavelet transform as it is regarded as the most appropriate function of wavelet that is used for the analysis of phase interactions (Ftiti et al., Citation2014) and is useful for economic implications (Aguiar-Conraria & Soares, Citation2011). The rationale behind continuous wavelet transforms is to apply the wavelet as a bandpass filter to the time series (Grinsted et al., Citation2004). The methodological steps under the wavelet approaches employed in this study are outlined as follows.
3.1. Bivariate wavelet analysis
The fundamental wavelet transform contains two filters, namely father wavelets , which operate with low frequency and the mother wavelets
, which also operate with high-frequency components.
Father wavelet and mother
The wavelet transform decomposes the time series into a function called small waves which uses a local base function that can be translated and stretched into both time and frequency. These small waves result from the mother, a family of daughter wavelets is represented as follows:
where is the translation parameter
is the dilation parameter and the function
are defined as mother wavelet
Gencay et al. (Citation2002) argue that to be the mother wavelets
it must satisfy the following conditions:
Zero mean
Square the integrated to unity
Admissibility condition where
is the Fourier transform of
namely
.
The square of admissible wavelets is mainly focused on the frequency interval known as the passband, which can be interpreted as the impulse response of the bandpass filter.
Torrence and Compo (Citation1998) argue that the appropriate approach to wavelet transformation is the Fourier space. This is achieved by sliding a segment of length t from the time series of the time step and the total length
returning frequencies
to
at each time step.
The Morlet wavelet is the most commonly used mother wavelet in the decomposition of time series. This is because it allows one to parameterize the wavelet directly in terms of the desired temporal and spectral smoothing (Cohen, Citation2019).
This is represented as follows:
where is a non-dimensional frequency taken to 6 to satisfy the admissibility condition (Farge, Citation1992). The wavelet is stretched over time by varying its scale(s) so that
and normalizing to have a unit energy. The CWT of the time series (
with uniform time step
, the wavelet will be as follows:
By varying the wavelet scale (s) and translating along with the localized time index n. it can infer both the amplitude of any features versus the scales and how amplitude varies with time. The subscript 0 to demonstrates that
has been normalized.
The continuous wavelet transformation (CWT) of the time series is obtained by projecting the mother wavelet as follows:
where * represents the complex conjugate. To recuperate the original time series from the original wavelet transformation, the inverse wavelet transformation is presented as follows:
Both the wavelet function and transform (
are very complex to deal with. Therefore, to deal with such a complexity of the transformation, the wavelet is divided into real parts, imaginary parts, and phases (Torrence & Compo, Citation1998). To compare different wavelet spectrums, it is necessary to find a common normalization of the wavelet spectrum of the time series. Normalization provides a measure of power relative to white noise. For a time series of white noise, the expectation value is
where
is the variance, the expectation value for the wavelets transform is
for all
. The total variance of the time series
can be derived by integrating between
as follows:
To study the interaction between financial stress and global commodity price, we applied a bivariate framework known as wavelet transform coherence (WTC), which consists of cross-wavelet transform (CWT) and wavelet coherence. We follow the framework of Torrence and Compo (Citation1998) to define CWT as follows:
where represent cross-wavelet of the time series
and
respectively, where * is a sign of a compound conjugate,
represent location and scale, respectively. Bossman et al. (Citation2022) asserted that the cross-wavelet transform displays the area in the time-space holding common power to a higher degree.
Following the approach by Torrence and Compo (Citation1998), we define the square wavelet coherence (SWC) which captures the comovement of the time series and
as follows:
where S is the smooth factor that ensures a balance in resolution and the resultant value of the square of the wavelet coefficients, is such that 0
. By interpretation, weak relationships are indicated by values approaching 0, whereas strong relationships are indicated by values approaching 1. Torrence and Compo (Citation1998) posited that the distribution of the cross-wavelet coefficient is theoretically not well known; therefore, the statistical significance of the correlation is examined using Monte Carlo techniques. Through wavelet coherence normalisation, the biases in wavelet cross-spectrum and wavelet power are overcome (Agyei, Bossman, et al., Citation2022; Asafo-Adjei et al., Citation2021; Bossman, Adam et al., Citation2022). Thus, the appropriate application of the coherence facilitates our assessment of the dynamics of comovement between financial stress and global commodity prices in a time-frequency paradigm.
To get a deeper insight into correlation analyses and the lead–lag relation between financial stress and global commodity prices, the study applies wavelet coherence phase difference (WCPD) techniques following (Torrence & Compo, Citation1998).
The WCPD is expressed as follows:
where I and R are, respectively, the imaginary and real parts of the smoothed CWT. The wavelet coherence is defined by the dimensional phase pattern, and varying phase patterns are distinguished using the dimensional arrows. Thus, arrow pointing to the right or left signifies that or
is in phase, whereas the arrows pointing upward or downward indicate that
or
is leading.
The calculation of wavelet correlation encompasses the construction of variance and covariance of the time series of and
at different scales. We compute the wavelet variance of the stochastic process using MODWT (Maximal Overlap Discrete Wavelet Transform) for scale
through;
where is the MODWT wavelet coefficient of variables x at the scale
represents the number of coefficients unaffected by the boundary.
is the length of the scale
wavelet filter.
The wavelet covariance between the paired series scale-by-scale is written as follows:
Based on the variance and covariance of the equation, the wavelet correlation is expressed as follows:
The wavelet cross-correlation decomposes between the two-time series on a scale-by-scale basis to determine the association between the paired series changes over time
Gencay et al. (Citation2002) define wavelet cross-correlation as follows;
where represent, the wavelet variance for
and
associated with the scale
and
and the wavelet covariance between
are associated with scale
The cross-correlation is used to determine a lead–lag relationship between the paired series and gives a lead–lag relationship on a scale-by-scale basis.
3.2. Multiple wavelet correlations
To overcome the weakness associated with the use of pairwise wavelet correlation analysis within a multivariate set of variables, we further explore the wavelet multiple correlation methods proposed by Fernández-Macho (Citation2012).
Let be the multivariate stochastic process and
representing for scale
We apply MODWT in each process to obtain the wavelet coefficients. The wavelet multiple correlations
as a set of multiscale correlations are derived from
as follows: At each wavelet scale
, we calculate the square roots of the regression coefficients of determination in that linear combination of variables
i = 1 …… n for which such coefficient of determination is a maximum. The coefficient of determination corresponds to the regression variables
on the set of regressors (
) which is represented as
where
represent the i-th diagonal element of the inverse of the correlation matrix P.
The wavelet multiple correlations (WMC) multiscale correlation is computed as follows:
) =
(14)
where is the nxn correlation matrix of
The max dia provides selection for the largest element on the diagonal of the argument. In the regression variables
on the set of variables in the system, the
The coefficient can be equal to the square of the correlation between the values and the fitted value of
as
obtained from the regression. The WMC is expressed as follows:
(15)
The variance and covariance of the wavelet are given by;
where refers to the number of the coefficient unaffected by the boundary condition,
is the set of regression (
leading to the maximisation of
,
represents the fitted values, and
is the length of the scale
.
Wavelet multiple cross-correlations (WMCC) are generated by allowing a lag between the observed and the fitted values of the variables selected as criterion variables at each scale
, as follows:
(18)
For n =2, the WMC and WMCC agree with the standard wavelet correlation and cross-correlation. This is because
)
and
) where
is the estimated coefficient in the regression
at scale
.
) =
and likewise,
.
The WMC is seen to be a non-linear function of Equationequation (12)(12)
(12) where the n(n-1)/2 wavelet correlation of that
= (
at scale
A consistent estimator correlation from MODWT is represented as follows:
) =
(19)
In deriving the confidence interval (CI) of WMC proposed by Fernández-Macho (Citation2012), by following Fisher’s (Citation1915) transformation, arctan h(r) where h(.) is the inverse hyperbolic tangent function.
When constructing a confidence interval (CI), it is assumed that x = ( is the realisation of a multivariate Gaussian stochastic process (
for t = 1,2 … . t. By applying MODWT of order j to each of the univariate time series (
for i = 1, 2 … . n, we obtain the length vector j t of the coefficients of MODWT
for which j = 0, 1, 2, …. j.
Let
) be the sample of wavelet correlation obtained from Equationequation 12
(12)
(12)
where =arctanh (
) =
=arctanh (
) and
is the probability of the distribution of abs(
such that (
is normally distributed with the given mean and variance.
The CI for the sample wavelet correlation coefficient is given by:
(21)
where is the 100% point of standard normal distribution.
4. Data description and sources
The data considered in this study were weekly data of the financial stress index (FSI) of Federal Reserve of Bank of St. Louis Fed Financial Stress Index (STLF13) and Chicago Fed National Condition Index (NFCI). Weekly data were employed to alleviate the potential effect of noise characterised in daily data. Considering the leading role of the US financial system in the world economies, we employed the STLF13 and NFCIFootnote3 as indicators of global financial stress. It is worth noting that the financial market condition in the US reflects a significant degree of the overall condition of the global financial market (Chen et al., Citation2014). The objective of using the stress indexes is that FSI provides detailed insight into the financial condition of the US financial system. In line with Kocaarslan et al. (2018), we believe that the financial stress index offers more insight into the changes in investor expectations and captures the dynamic in the capital market, hence, employing FSI will be a good proxy for worldwide stress levels. In addition to the FSI, we use the spot prices of gold, silver, oil, and cocoa.
We employ these global commodities due to their high importance to the world economy and international investors. Gold and silver are the most actively traded and leaders for precious metals. Cocoa, oil, and gold are major export products in world economies (Boako & Alagidede, Citation2016) and actively traded commodities in world economies (Yaya et al., Citation2016). Oil has been argued by Kocaarslan et al. (2018) as a leading global commodity and as an important energy source whose prices may reflect global economic conditions. Gold prices, cocoa prices, silver prices, and oil prices were all gleaned from the DataStream and expressed in US dollars per troy ounce for gold and silver, per barrel for oil, and per metric ton for cocoa. Based on available data at the time of this study, the sample period covered 3 January 1975 to 12 December Citation2021, giving us a total of 1796 common observations. To account for the effect of the financial crisis on the dynamic linkage between financial stress and global commodity prices, we disaggregate the data into the full sample and sub-samples (pre-crisis, crisis period, post-crisis), as in the works of Lean and Nguyen (Citation2014) and Tweneboah and Alagidede (Citation2018).
The descriptive statistics presented in indicate that both pre- and post-financial crisis series exhibit leptokurtic features indicating high peakedness with significantly fatter tails. The Jarque–Bera statistics for pre-financial and post-financial crises for all the series reject the null hypothesis that their distribution is normal.
Table 1. Descriptive statistics
displays the time series plots of the observed weekly prices of global commodities and the US financial stress index. We observed that time series plots for oil and silver prices show few spikes with an upward and downward during global economic uncertainty including the 9/11 attacks, political polarisation, SARS outbreak, Europe’s broader control, crisis Euro debt crisis, the failure of the Lehman Brothers, and the current COVID pandemic. The oil price slides in 2014/2015 had some similarities with those of 1973–1974 and 1985–1986 because they followed a period of strong oil supply from non-OPEC economies and Saudi Arabia’s increased production (see, Fantazzini, Citation2016). A scrutiny of the time series plots for cocoa and gold prices exhibits a relatively smooth and steadily increasing pattern in its time evolution with a few spikes during uncertainty in the financial market. Looking at the time-series plots for US FSI, we observed that the stress period captures the major episodes of financial distresses such as the oil embargo recession period 1973–1975, the Iran and Volcker recession in 1980, the Gulf War recession in 1990, the 9/11 attacks, political polarisation, SARS, GFC 2007–2009, and COVID-19 pandemic with the higher number indicating the stressful period. The GFC is strongly reflected in the plot as shown in the spike in mid-2008. This coincides with the period when global commodity prices plummeted (Mayer, Citation2012).
Figure 1. Time series plot of commodity prices of cocoa, gold, oil and silver and St. Louis Fed Financial Stress (STLF13) and Chicago Fed National Condition Index (NFCI).
5. Empirical results
5.1. Bivariate interdependence between financial stress and global commodity prices
The interpretation and availability of the codes for this analysis were found in the package provided by (Roesch & Schmidbauer, Citation2014). We examine the bivariate comovements, in frequency and time domains, between the NCFI, STFL13, and global commodity prices (gold, oil, cocoa, and silver). The bi-wavelet coherence framework is employed as a measure of local correlation and phase difference to describe any lag/lead relationship among the variables.
show the wavelet coherence. Following the standard practice of literature, the horizontal axis indicates the time and the vertical axis indicates the frequency band ranging from low frequency (2) to high frequency (512) in weeks. The cone of influence (COI) is shown; the bell-shaped shape which specifies the area of edge effect beyond which the coherence lacks statistical significance. The colour bar shows the degree of coherence as it moves from blue to red on the bar. The phase difference between the two series is indicated by arrows. The arrows to the left (←) and right (→) indicate the pairs of series are out-phase and in-phase, respectively. The right and up (↗) arrows imply that the first (second) series is leading (lagging), while the right and down (↘) suggest the first (second) is lagging (leading). The second (first) series is leading (lagging) if the arrows turn left and up (↖), while it lags (leads) if it turns left and down (↙). The arrows pointing up (down) signal that the first (second) series is leading the second (first) series by . The area of significance at 5% confidence is where the arrows are plotted within the white contour with the Bartlett default smoothing window type. The wavelet coherence plots for each commodity’s comovement with NFCI and STLF13 are shown in , respectively.
Figure 2. Wavelet coherence of NFCI and global commodities prices.
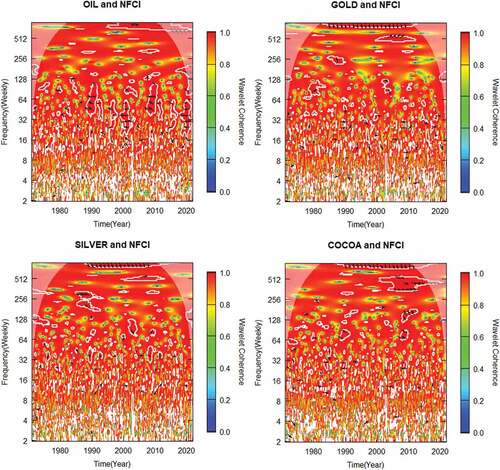
Figure 3. Wavelet coherence of STLF13 and global commodities prices. Panel A) Full sample, Panel B) Pre-GFC, Panel C) GFC, Panel D) Post-GFC.
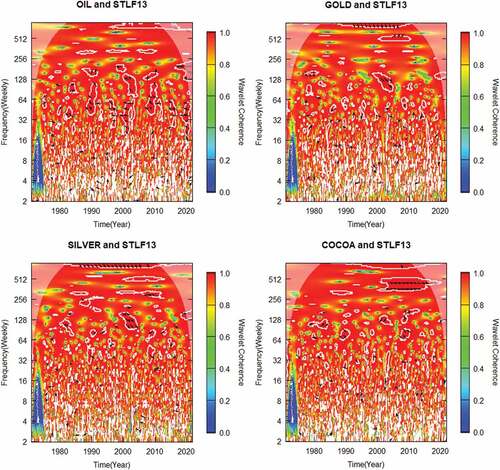
From , we notice a high coherence at the highest scale concerted at the 256–512 weekly frequency band between gold and NFCI with gold leading, especially from 2012 to 2015 when the market stress period was high. This strong linkage between gold and NFCI in the long run after the crisis period may be explained by the fact that the investors managing comovement behaviour, in the long run, are affected during the noncrisis period at the time when market stress was low. At a weekly frequency band of 8–64, several comovements between NFCI and gold occur throughout the entire period (with a nonhomogeneous phase difference) when the market stress is normal. Similarly, in , we find significant comovements between STLF13 and gold at a frequency band of 256–512 weeks in the GFC period. During this period, we observed that gold is leading. A strong covariation is mainly localized during the global financial crisis at the high-frequency band. The GFC seems to be the reason for the high frequency between gold and financial stress when the market stress was high.
Turning to cocoa and STLF13 in , we observe a highly and statistically significant comovement in the 256–512 weekly frequency band from 2001 to 2018. This is the stronger and finest coherence stretching over a long period and is found at the highest weekly frequency band; however, this appears to be periodic and does not spread through the entire distribution. The higher coherence that occurs during economic crises and political turmoil such as terrorist attacks in the US, the Iraq invasion, the 2007–2009 GFC, and the Euro crisis could be a conceivable attribution for this strong comovement. During this period, we notice the prices of cocoa were unstable. Despite the right arrow in the high weekly frequency band, some arrows are pointing upward and downward in the medium-term horizon, which signifies changing lead–lag relationships between financial stress and cocoa prices. We also find a common behaviour in between cocoa and NFCI which shows a stronger comovement at a higher weekly frequency band with longer periodicities with some islands of coherency in the middle belt of frequency at shorter periods. The higher degree of comovement at a short-run period consisting of 1- to 2-year timescale bands implies that financial traders and market participants who intervened at this short and medium interval were affected by the transitory shock during high financial market stress. This changing pattern between cocoa prices and financial market stress with higher comovement during the crisis period and lower comovement during the non-tranquil period substantiates the contagion features.
In the case of oil and FS (NFCI in & STL13 in ), we see clouds of arrows at the lower and medium parts of the 32 and 128-weekly frequency bands from 1990 to 1995, 2000–2005, 2007–2009, and 2020. This period coincides with economic events such as the Gulf War recession when Iraq invaded Kuwait, the energy crisis period, GFC, and COVID-19-induced oil price shock, respectively. However, we notice that most of the arrows pointing to the left indicate that the time series are out of phase, which implies that oil prices are negatively correlated with FS. During this period, market stress was very high, which may be attributable to the key economic event. The findings substantiate the fact that rising levels of financial stress reduce crude oil prices. This observation corroborates what was witnessed during the early weeks of the pandemic. By this finding, we emphasise that the wavelet methodology is efficient in revealing the real relationship between commodities prices and financial stress. Our observations are in line with the conclusions of Liu et al. (Citation2020), Nazlioglu et al. (Citation2015), and Kilian (Citation2009) that oil prices significantly comove with financial stress. Oil prices negatively correlated with the US FS, and we notice a few upward arrows, indicating that oil prices lead the STL13 at the frequency band of 128 to 256 weeks. The observed clouds of arrows occur mainly around the GFC and COVID-19 period, when the market stress period was high, with the oil price leading but negatively correlated with FS.
Conspicuously, NFCI and STL13 negatively drive silver and cocoa prices at low frequencies beyond 512 weekly cyclicities. STFL13 negatively drives silver prices, while cocoa prices positively drive STFL13 across the medium frequencies in notable crisis periods. The lead–lag relations between each paired series (cocoa and either NFCI or STFL13 and silver and either NFCI or STFL13) vary across time and frequency bands, indicating a non-tranquil comovement whereby silver and cocoa prices sometimes lead (or lag) either NFCI or STFL13 when the financial market stress is low. The inconsistent comovement and lead/lag dynamics across the medium frequency bands imply that transitory shocks were prevalent during the medium-term horizons of high financial market stress.
To sum up, the discussion on the bivariate wavelet analysis, all the plots shown in depicts medium-to-high comovements across the pairs as the red colour dominates all significant regions. The implication is that the pricing and returns generating process existing in commodities markets are highly driven by financial stress. However, we must acknowledge that despite the high coherence pattern, the lead/lag dynamics are nonhomogeneous across the time-frequency space. This gives the chance for commodity hedging in stressed financial periods. Hence, our findings corroborate those from recent works that find support for commodity hedging in inflationary periods (Spierdijk & Umar, Citation2013; Zaremba, Szczygielski et al., Citation2021; Zaremba et al., Citation2019) as well as in pandemic-induced financial crises (Umar, Gubareva, Naeem et al., Citation2021; Umar, Jareño et al., Citation2021; Umar et al., Citation2019). Notwithstanding, it is important to point out that the positioning arrows that fall outside the region of the COI indicate their lack of statistical significance and, hence, no inference was made for such coherence.
5.2. Bivariate wavelet correlation between financial stress and global commodity prices
In this section, we begin our analysis by decomposing the series into several scales using the Maximal Overlap Discrete Wavelet Transform with Daubechies least asymmetric wavelet filters of seven for the full sample, pre-crisis, and post-crisis period, and two for the crisis period. The purpose of the contemporary bivariate correlation matrix is to examine the correlation between financial stress and the return of global commodity prices on the wavelet scale. These are reported in four plots (Panel A—full sample, Panel B—pre-GFC, Panel C—GFC, and Panel D—post-GFC) in . The horizontal axis displays a possible combination, whereas the vertical axis presents a wavelet scale in weeks. The degree of correlation ranges from deep blue, which signals weak synchronisations, and deep red, signalling strong synchronisations. The contemporary bivariate matrix is frequency- or scale-dependent, contrary to the characteristics possessed by the time-frequency domain, as illustrated in . The essence of the bivariate correlation matrix is to find the set of combinations of the series on the wavelet scale without any time dimension. presents the correlation matrix between FS and global commodities, which did not appear to differ significantly from the analysis in .
Figure 4. Wavelet bivariate correlation matrix. Panel A: Full sample, Panel B: Pre-GFC, Panel C: GFC, Panel D: Post-GFC.
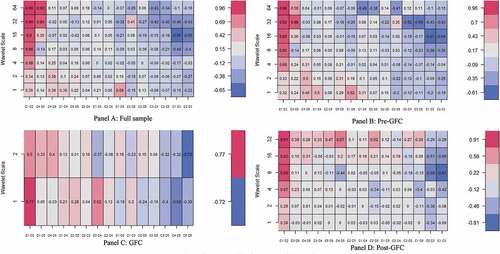
From , we find a mix of positive and negative relationships between FS and global commodity prices at different wavelet scales. The maximum coefficient of FS-global commodity nexus occurs in a pre-financial crisis where FS comoves with cocoa at a weekly scale, indicating the transmission rate at which FS and cocoa prices interact. However, comparing the interrelationship between the pair of series during the crisis period, we find that the correlation between FS and cocoa prices has dropped to 0.19 on a scale of 2 weeks and increased to 0.39 at a higher time horizon of 32 weeks in the post-GFC sample. This implies that although the market has become more integrated after the GFC period, the transmission rate between the pairs of series is reducing. This is common with all other commodities.
The linkage between FS and gold prices is much weaker during the turmoil and post-financial crisis. The dynamic pattern of the FS and silver prices is less correlated on a lower wavelet scale during the GFC and is negatively correlated after the GFC on a lower wavelet scale up to weekly. This suggests that the interdependencies between FS and silver prices are low in the GFC and after the GFC but were high before the financial crisis on a lower wavelet scale up to weekly when the prices of silver started rising during the period when the financial market stress was low. The high correlation occurs in the GFC when the market stress period is high. In effect, the interdependence of the silver prices declining during the GFC is in line with the postulation made by D. D. Zhang and Broadstock (Citation2020) that commodity prices went high during the GFC when the financial market stress was high. Furthermore, the correlation between FS and oil prices in the pre-GFC exhibited a negative correlation on a lower scale up to weekly, but positively correlated on a lower wavelet scale of 2 weeks. This indication proposes that the weak short-term linkage between the US FSI and oil price is ascribed to information asymmetry. These findings are in line with Reboredo and Uddin’s (2016) conclusion that the commodity market flows for hedging and safe haven. However, this is converse to the work of Liu et al. (Citation2020) who argued that oil price shocks significantly affect China’s financial stress during high financial market stress.
To sum up the discussion on the bivariate wavelet contemporary correlations, we divulge that the weak association between FS and global commodity prices on a shorter wavelet scale may be attributed to the fact that financial friction to the global economy usually takes some time before the transmission effect, as noted by Dovern and van Roye (Citation2014). Hence, there is a need for further investigations on this phenomenon.
5.3. The multivariate link between financial stress and global commodity prices
Having assessed the bivariate correlation matrix, there is a need to examine further the extent to which market stress is connected and how likely they may interact during economic events. This makes the use of wavelet multiple correlations and wavelet multiple cross-correlations important in this study to enable investors and policymakers to undertake timely rebalancing of portfolios during market stress. In (for numerical evidence, see, in the Appendix), we report that multiple correlations increase from higher frequencies to lower frequencies in both pre-crisis, crisis, and post-crisis periods. The correlation in the highest frequency record was 0.57 intraweek scale before GFC and 0.47 intraweek scale for post-GFC. The highest correlation of 0.98 on the biannual scale occurred in the pre-GFC sample and 0.977 on the biannual scale occurred in the post-GFC sample, recorded at the lowest frequency. We observed that the degree of integration between the pair of series from the short- to long-term trading horizons indicates that the WMCs are weaker at the short-run timescale but grow stronger at lower frequencies.
Figure 5. Multiple wavelet correlations between FSI and global commodities prices. Panel A: Full sample, Panel B: Pre-GFCPanel C: GFC, Panel D: Post-GFC.
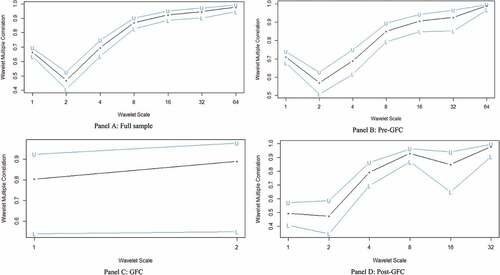
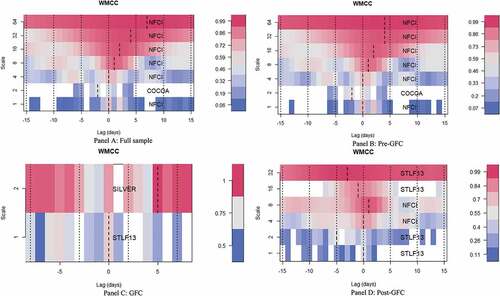
While these findings do not show the leading/lagging variable, they depict the broad interrelations between the sampled variables across trading scales. Hence, the application of the wavelet multiple cross-correlations (WMCC) becomes relevant. From , (for numerical evidence, see, in the Appendix), we find that in the pre-GFC sample, cocoa led at 2 days (0.4763) at a weekly scale, representing the short-run. Silver is lagged at 5 days (0.9964) on the weekly scale of the GFC sample. Both cocoa and silver prices feature in the dynamics of the short-run, making cocoa (silver) a leader (lagger) in responding to the shock of US financial stress. It is worth noting that generally, across all samples, the results emphasise the strength of financial stress in commodity markets, as they (either NFCI or STLF13) potentially lead or lag at most wavelet scales. We reiterate that financial stress is predominant in crisis periods, with the US FSI being the most influential.
Figure 6. Multiple cross-correlations of wavelets.
6. Conclusion and policy implication
Using multiple techniques from a time-frequency paradigm, we investigated the comovements and lead/lag dynamics between financial stress and commodities prices utilising datasets covering 47 decades (1975–2021). We contribute to the existing knowledge focused on assessing the time-frequency comovements between the US FSI and global commodity prices using bivariate and wavelet multiple wavelet approaches.
Generally, the dynamics of lead/lag interrelations revealed between financial stress and the sampled commodities suggest that financial stress significantly influences the price and returns generating dynamics in commodities markets with much intensity in key market event periods such as the GFC, the European debt crisis, and the COVID-19-induced financial market meltdown. We reveal findings that support the hedging abilities of commodities across the time-frequency space. In particular, for crude oil, the findings from the bivariate analysis study reveal that there are inverse comovements between financial stress and oil prices, emphasising the hedging properties of crude oil in financial stress periods. This is also suggestive of the role of energy commodities in the present period. Findings from the WMC divulge that the interdependence between commodities and financial stress increases with diminishing frequencies, as represented by the long-term trading horizon. The WMCC results provide evidence that the US FSI predominantly influences market dynamics among commodities in the post-GFC era, as it takes on the potential lead series across most wavelet scales.
The study offers an important contribution to the prior literature on the FS-global commodities nexus, which has practical consequences for policymakers, commodity producers, investors, and regulators in understanding and monitoring the severity of financial stress transmission on global commodities prices. First, the FS provides useful information on financial conditions, which will serve as monitoring tools for producers and policymakers to plan production schedules, forecast future prices of commodities, and predict market dynamics. Given the nonhomogeneous relationships between US financial market stress and commodities prices, commodities producers can base their production schedules on the state of the market or the economy. Second, investors and portfolio managers need to pay particular attention to the state of market stress to optimise their investment by undertaking timely rebalancing of portfolios and other risk management strategies during intense uncertainty periods in the financial market. Third, the findings from this study concerning the dynamic and nonhomogeneous lead/lag relations highlight the importance of cross-commodity investments. As such, by acknowledging the response of different commodities to financial stress, asset allocation could factor in commodities that offer opposing responses to a financial stress to hedge downside risks associated with portfolios.
In terms of future works, we acknowledge that this study was limited to the FSI of the US. Hence, against the backdrop of globalisation and given the fast pace at which top-emerging economies are growing (or globalising), there is a need to ascertain the degree of connectedness between the FSI of other regimes and commodities markets. Our findings underscored that albeit with heterogeneity in terms of direction and magnitude, the comovements between financial stress and commodities prices are mainly envisaged at medium frequencies across with much consistency, supporting the recent works that contend with the financialisation hypothesis. This gives room for future research to explore additional techniques for scrutinising the financialisation hypothesis further.
Disclosure statement
No potential conflict of interest was reported by the author(s).
Additional information
Funding
Notes on contributors
Mohammed Armah
Mohammed Armah is a doctoral research student at the Ghana Institute of Management and Public Administration (GIMPA). He holds an MPhil and MBA in Finance from Kwame Nkrumah University of Science and Technology and Coventry University College. He is a Chartered Accountant and Chartered Tax Practitioner with over 15 years in financial management, financial reporting, taxation, and fiscal policy.
Godfred Amewu
Godfred Amewu is a Senior Lecturer in Finance at the University of Ghana Business School. He holds a Ph.D. in Finance from the University of Witwatersrand South Africa and an MSc in Finance from the University of St. Andrews (UK). He has contributed to several published papers in top refereed academic journals.
Ahmed Bossman
Ahmed is a Research Fellow at the Department of Finance, School of Business, University of Cape Coast. He holds a Master of Commerce (Finance) degree from the University of Cape Coast Ghana. He shares research interests in empirical finance, financial markets, Islamic finance, financial economics, commodity markets, and financial econometrics. He has contributed to several published papers in leading refereed academic journals.
Notes
1. An exception to this is H. H. Zhang and Wang’s (Citation2021) comparative analysis of gold and bitcoin against financial stress in a time-frequency spillover model. However, among commodities, their sample was limited to gold whilst the approach employed falls short in determining the lead-lag dynamics between the sampled assets.
2. Conclusions on commodity financialisation do not commensurate with each other (Cheng et al., Citation2013; Demirer et al., Citation2015; Tang & Xiong, Citation2012; Zaremba, Umar, Citation2021). See Bossman and Agyei (Citation2022) for a review.
References
- Aboura, S., & Roye, B. V. (2017). Financial stress and economic dynamics: The case of France. International Economics, 149, 57–25. https://doi.org/10.1016/j.inteco.2016.11.001
- Aguiar-Conraria, L., & Soares, M. J. (2011). Oil and the macroeconomy: Using wavelets to analyze old issues. Empirical Economics, 40(3), 645–655. https://doi.org/10.1007/s00181-010-0371-x
- Agyei, S. K., Bossman, A., Asafo-Adjei, E., Asiamah, O., Adela, V., & Adorm-Takyi, C. (2022). Exchange rate, COVID-19, and stock returns in Africa: Insights from time-frequency domain. Discrete Dynamics in Nature and Society, 2022, 1–20. https://doi.org/10.1155/2022/4372808
- Agyei, S. K., Owusu Junior, P., Bossman, A., & Arhin, E. Y. (2022). Situated information flow between food commodity and regional equity markets: An EEMD-based transfer entropy analysis. Discrete Dynamics in Nature and Society, 2022. https://doi.org/10.1155/2022/3938331
- Agyei, S. K., Owusu Junior, P., Bossman, A., Asafo-Adjei, E., Asiamah, O., Adam, A. M., & Ghoshray, A. (2022). Spillovers and contagion between BRIC and G7 markets: New evidence from time-frequency analysis. PLoS ONE, 17(7), e0271088. https://doi.org/10.1371/journal.pone.0271088
- Alsubaie, S. M., Mahmoud, K. H., Bossman, A., Asafo-adjei, E., & Gherghina, S. C. (2022). Vulnerability of sustainable Islamic stock returns to implied market volatilities: An asymmetric approach. Discrete Dynamics in Nature and Society, 2022, 1–22. https://doi.org/10.1155/2022/3804871
- Apostolakis, G., & Papadopoulos, A. P. (2014). Financial stress spillovers in advanced economies. Journal of International Financial Markets, Institutions and Money, 32(1), 128–149. https://doi.org/10.1016/j.intfin.2014.06.001
- Asafo-Adjei, E., Adam, A. M., & Darkwa, P. (2021). Can crude oil price returns drive stock returns of oil producing countries in Africa ? Evidence from bivariate and multiple wavelet. Macroeconomics and Finance in Emerging Market Economies, 1–19. https://www.tandfonline.com/doi/abs/10.1080/17520843.2021.1953864
- Asafo-Adjei, E., Agyapong, D., Agyei, S. K., Frimpong, S., Djimatey, R., Adam, A. M., & Ma, J. (2020). Economic policy uncertainty and stock returns of Africa: A wavelet coherence analysis. Discrete Dynamics in Nature and Society, 2020, 1–8. https://doi.org/10.1155/2020/8846507
- Asafo-Adjei, E., Frimpong, S., Owusu Junior, P., Adam, A. M., Boateng, E., & Abosompim, R. O. (2022). Multi-frequency information flows between global commodities and uncertainties: Evidence from COVID-19 pandemic. Complexity, 2022. https://doi.org/10.1155/2022/6499876
- Assifuah-Nunoo, E., Owusu Junior, P., Adam, A. M., & Bossman, A. (2022). Assessing the safe haven properties of oil in African stock markets amid the COVID-19 pandemic: A quantile regression analysis. Quantitative Finance and Economics, 6(2), 244–269. https://doi.org/10.3934/QFE.2022011
- Boako, G., & Alagidede, P. (2016). Global commodities and African stocks: A “market of one? International Review of Financial Analysis, 44, 226–237. https://doi.org/10.1016/j.irfa.2016.02.009
- Bossman, A. . (2021). Information flow from COVID-19 pandemic to Islamic and conventional equities: An ICEEMDAN-induced transfer entropy analysis. Complexity, 2021, 1–20. https://doi.org/10.1155/2021/4917051
- Bossman, A., Adam, A. M., Owusu Junior, P., & Agyei, S. K. (2022). Assessing interdependence and contagion effects on the bond yield and stock returns nexus in Sub-Saharan Africa: Evidence from wavelet analysis. Scientific African, 16, e01232. https://doi.org/10.1016/j.sciaf.2022.e01232
- Bossman, A., & Agyei, S. K. (2022). ICEEMDAN-based transfer entropy between global commodity classes and African equities. Mathematical Problems in Engineering, 2022, 1–28. https://doi.org/10.1155/2022/8964989
- Bossman, A., Agyei, S. K., Owusu Junior, P., Agyei, E. A., Akorsu, P. K., Marfo-Yiadom, E., Amfo-Antiri, G., & Gubareva, M. (2022). Flights-to-and-from-quality with Islamic and conventional bonds in the COVID-19 pandemic era: ICEEMDAN-based transfer entropy. Complexity, 2022, 1–25. https://doi.org/10.1155/2022/1027495
- Bossman, A., Owusu Junior, P., & Tiwari, A. K. (2022). Dynamic connectedness and spillovers between Islamic and conventional stock markets: Time- and frequency-domain approach in COVID-19 era. Heliyon, 8(4), e09215. https://doi.org/10.1016/J.HELIYON.2022.E09215
- Bossman, A., Umar, Z., Agyei, S. K., & Owusu Junior, P. (2022). A new ICEEMDAN-based transfer entropy quantifying information flow between real estate and policy uncertainty. Research in Economics. https://doi.org/10.1016/j.rie.2022.07.002
- Bossman, A., Umar, Z., & Teplova, T. (2022). Modelling the asymmetric effect of COVID-19 on REIT returns: A quantile-on-quantile regression analysis. The Journal of Economic Asymmetries, 26, e00257. https://doi.org/10.1016/J.JECA.2022.E00257
- Bouri, E., Gupta, R., Lau, C. K. M., Roubaud, D., & Wang, S. (2018). Bitcoin and global financial stress: A copula-based approach to dependence and causality in the quantiles. Quarterly Review of Economics and Finance, 69, 297–307. https://doi.org/10.1016/j.qref.2018.04.003
- Cardarelli, R., Elekdag, S., & Lall, S. (2011). Financial stress and economic contractions. Journal of Financial Stability, 7(2), 78–97. https://doi.org/10.1016/j.jfs.2010.01.005
- Cevik, E. I., Dibooglu, S., & Kenc, T. (2016). Financial stress and economic activity in some emerging Asian economies. Research in International Business and Finance, 36, 127–139. https://doi.org/10.1016/j.ribaf.2015.09.017
- Chen, W., Hamori, S., & Kinkyo, T. (2014). Macroeconomic impacts of oil prices and underlying financial shocks. Journal of International Financial Markets, Institutions and Money, 29(1), 1–12. https://doi.org/10.1016/j.intfin.2013.11.006
- Cheng, I.-H., Xiong, W., & Hall, T. (2013). The financialization of commodity markets (No. 19642; NBER Working Paper Series). NBER. http://www.nber.org/papers/w19642
- Cohen, M. X. (2019). A better way to define and describe Morlet wavelets for time-frequency analysis. NeuroImage, 199(April), 81–86. https://doi.org/10.1016/j.neuroimage.2019.05.048
- Das, D., Kannadhasan, M., & Bhattacharyya, M. (2019). Do the emerging stock markets react to international economic policy uncertainty, geopolitical risk and financial stress alike? The North American Journal of Economics and Finance, 48, 1–19. https://doi.org/10.1016/J.NAJEF.2019.01.008
- Das, D., Kumar, S. B., Tiwari, A. K., Shahbaz, M., & Hasim, H. M. (2018). On the relationship of gold, crude oil, stocks with financial stress: A causality-in-quantiles approach. Finance Research Letters, 27, 169–174. https://doi.org/10.1016/j.frl.2018.02.030
- Davig, T., & Hakkio, C. (2010). What is the effect of financial stress on economic activity. Economic Review, Federal Reserve Bank of Kansas City, Q II, 35–62. https://core.ac.uk/download/pdf/6380772.pdf
- Demirer, R., Lee, H. T., & Lien, D. (2015). Does the stock market drive herd behavior in commodity futures markets? International Review of Financial Analysis, 39, 32–44. https://www.sciencedirect.com/science/article/pii/S1057521915000368
- District, N. (2015). Capital flight and bitcoin. International Review of Finance, 19(2), 1–11. https://doi.org/10.1111/ir
- Dovern, J., & van Roye, B. (2014). International transmission and business-cycle effects of financial stress. Journal of Financial Stability, 13, 1–17. https://doi.org/10.1016/j.jfs.2014.02.006
- Elsayed, A. H., & Yarovaya, L. (2019). Financial stress dynamics in the MENA region: Evidence from the Arab Spring. Journal of International Financial Markets, Institutions and Money, 62, 20–34. https://doi.org/10.1016/j.intfin.2019.05.004
- Esparcia, C., Jareño, F., & Umar, Z. (2022). Revisiting the safe haven role of gold across time and frequencies during the COVID-19 pandemic. The North American Journal of Economics and Finance, 61, 101677. https://doi.org/10.1016/J.NAJEF.2022.101677
- Fantazzini, D. (2016). The oil price crash in 2014/15: Was there a (negative) financial bubble? Energy Policy, 96(November 2014), 383–396. https://doi.org/10.1016/j.enpol.2016.06.020
- Farge, M. (1992). Wavelet transforms and their applications to turbulence. Annual Review of Fluid Mechanics, 24(5), 395–457. http://wavelets.ens.fr/ENSEIGNEMENT/COURS/UCSB/farge_ann_rev_1992.pdf
- Fernández-Macho, J. (2012). Wavelet multiple correlation and cross-correlation: A multiscale analysis of Eurozone stock markets. Physica A: Statistical Mechanics and Its Applications, 391(4), 1097–1104. https://doi.org/10.1016/J.PHYSA.2011.11.002
- Ferrer, R., Jammazi, R., Bolós, V. J., & Benítez, R. (2018). Interactions between financial stress and economic activity for the U.S.: A time- and frequency-varying analysis using wavelets. Physica A: Statistical Mechanics and Its Applications, 492, 446–462. https://doi.org/10.1016/j.physa.2017.10.044
- Fisher, R. (1915). Frequency distribution of the values of the correlation coefficient in samples from indefinitely large population. Biometrika, 10(4), 507–521. https://www.jstor.org/stable/2331838
- Ftiti, Z., Tiwari, A., Belanès, A., & Guesmi, K. (2014). Tests of financial market contagion: Evolutionary cospectral analysis versus wavelet analysis. Computational Economics, 46(4), 575–611. https://doi.org/10.1007/s10614-014-9461-8
- Gencay, R., Selcuk, F., & Whitcher, B. (2002). An introduction to wavelets and other filtering methods in finance and economics. San Diego: Academic Press. https://doi.org/10.1088/0959-7174/12/3/701
- Gkillas, K., Gupta, R., & Pierdzioch, C. (2020). Forecasting realized oil-price volatility: The role of financial stress and asymmetric loss. Journal of International Money and Finance, 104, 102137. https://doi.org/10.1016/j.jimonfin.2020.102137
- Grinsted, A., Moore, J. C., & Jevrejeva, S. (2004). Application of the cross wavelet transform and wavelet coherence to geophysical time series. Nonlinear Processes in Geophysics, 11(5/6), 561–566. https://doi.org/10.5194/npg-11-561-2004
- Hafner, C. M., & Herwartz, H. (2006). A LaGrange multiplier test for causality in variance. Economics Letters, 93(1), 137–141. https://doi.org/10.1016/j.econlet.2006.04.008
- He, X., Mishra, S., Aman, A., Shahbaz, M., Razzaq, A., & Sharif, A. (2021). The linkage between clean energy stocks and the fluctuations in oil price and financial stress in the US and Europe? Evidence from QARDL approach. Resources Policy, 72(September 2020), 102021. https://doi.org/10.1016/j.resourpol.2021.102021
- Hubrich, K., & Tetlow, R. J. (2015). Financial stress and economic dynamics: The transmission of crises. Journal of Monetary Economics, 70, 100–115. https://doi.org/10.1016/j.jmoneco.2014.09.005
- Illing, M., & Liu, Y. (2006). Measuring financial stress in a developed country: An application to Canada. Journal of Financial Stability, 2(3), 243–265. https://doi.org/10.1016/j.jfs.2006.06.002
- Kilian, L. (2009). Not all oil price shocks are alike: Disentangling demand and supply shocks in the crude oil market. American Economic Review, 99(3), 1053–1069. https://doi.org/10.1257/aer.99.3.1053
- Kocaarslan, B., Soytas, U., Sari, R., & Ugurlu, E. (2019). The changing role of financial stress, oil price, and gold price in financial contagion among US and BRIC markets. International Review of Finance, 19(3), 541–574. https://onlinelibrary.wiley.com/doi/abs/10.1111/irfi.12189
- Kristoufek, L. (2013). Fractal markets hypothesis and the global financial crisis: Wavelet power evidence. Scientific Reports 2013 3:1, 3(1), 1–7. https://doi.org/10.1038/srep02857
- Lean, H. H., & Nguyen, D. K. (2014). Policy uncertainty and performance characteristics of sustainable investments across regions around the global financial crisis. Applied Financial Economics, 24(21), 1367–1373. https://doi.org/10.1080/09603107.2014.925063
- Liu, R., Chen, J., & Wen, F. (2020). The nonlinear effect of oil price shocks on financial stress: Evidence from China. North American Journal of Economics and Finance, 55, 101317. https://www.sciencedirect.com/science/article/pii/S1062940820302047
- Mayer, J. (2012). The growing financialisation of commodity markets: Divergences between index investors and money managers. Journal of Development Studies, 48(6), 751–767. https://doi.org/10.1080/00220388.2011.649261
- Nazlioglu, S., Soytas, U., & Gupta, R. (2015). Oil prices and financial stress: A volatility spillover analysis. Energy Policy, 82(1), 278–288. https://doi.org/10.1016/j.enpol.2015.01.003
- Peters, E. E. (1994). Fractal market analysis: Applying chaos theory to investment and economics (Vol. 24). John Wiley & Sons. https://books.google.com.gh/books?hl=en&lr=&id=_bkoySKyc_cC&oi=fnd&pg=PA27&dq=+E.E.+Peters&ots=sPxlouW6JK&sig=nI6OvrXXJ0alDf3z2pspMQujHJU&redir_esc=y#v=onepage&q&f=false
- Reboredo, J. C., & Uddin, G. S. (2015). Do financial stress and policy uncertainty have an impact on the energy and metals markets? A quantile regression approach. International Review of Economics and Finance, 43, 284–298. https://doi.org/10.1016/j.iref.2015.10.043
- Roesch, A., & Schmidbauer, H. (2014). Package ‘WaveletComp. https://pbil.univlyon1.fr/CRAN/web/packages/WaveletComp/WaveletComp.Pdf
- Shehzad, K., Xiaoxing, L., Bilgili, F., & Koçak, E. (2021). COVID-19 and spillover effect of global economic crisis on the United States’ financial stability. Frontiers in Psychology, 12(February), 1–13. https://doi.org/10.3389/fpsyg.2021.632175
- Spierdijk, L., & Umar, Z. (2013). Are commodity futures a good hedge against inflation? SSRN Electronic Journal, 078, 1730243. https://ssrn.com/abstract=1730243
- Tang, K., & Xiong, W. (2012). Index investment and the financialization of commodities. Financial Analysts Journal, 68(6), 54–74. https://doi.org/10.2469/faj.v68.n6.5
- Torrence, C., & Compo, G. P. (1998). A practical guide to wavelet analysis. Bulletin of the American Meteorological Society, 79(1), 61–78. https://doi.org/10.1175/1520-0477<0061:APGTWA>2.0.CO;2
- Tweneboah, G., & Alagidede, P. (2018). Interdependence structure of precious metal prices: A multi-scale perspective. Resources Policy, June, 1–8. https://doi.org/10.1016/j.resourpol.2018.08.013
- Umar, Z., Bossman, A., Choi, S., & Teplova, T. (2022). Does geopolitical risk matter for global asset returns? Evidence from quantile-on-quantile regression. Finance Research Letters, 48(May), 102991. https://doi.org/10.1016/j.frl.2022.102991
- Umar, Z., Gubareva, M., Naeem, M., Akhter, A., & Caraiani, P. (2021). Return and volatility transmission between oil price shocks and agricultural commodities. PLoS ONE, 16(2), 1–18. https://doi.org/10.1371/journal.pone.0246886
- Umar, Z., Gubareva, M., Sokolova, T., & Gherghina, S. C. (2021). The impact of the COVID-19 related media coverage upon the five major developing markets. PLOS ONE, 16(7), e0253791.
- Umar, Z., Gubareva, M., & Teplova, T. (2021). The impact of COVID-19 on commodity markets volatility: Analyzing time-frequency relations between commodity prices and coronavirus panic levels. Resources Policy, 73, 102164. https://doi.org/10.1016/j.resourpol.2021.102164
- Umar, Z., Gubareva, M., Teplova, T., & Tran, D. K. (2022). Covid-19 impact on NFTs and major asset classes interrelations: Insights from the wavelet coherence analysis. Finance Research Letters, 102725. https://doi.org/10.1016/j.frl.2022.102725
- Umar, Z., Jareño, F., & Escribano, A. (2021). Oil price shocks and the return and volatility spillover between industrial and precious metals. Energy Economics, 99, 105291. https://doi.org/10.1016/j.eneco.2021.105291
- Umar, Z., Nasreen, S., Adebola, S., & Kumar, A. (2019). Exploring the time and frequency domain connectedness of oil prices and metal prices. Resources Policy, 64(August 2018), 101516.
- Umar, Z., Riaz, Y., & Zaremba, A. (2021). Patterns of spillover in energy, agricultural, and metal markets: A connectedness analysis for years 1780-2020. Finance Research Letters, 43(March), 101999. https://doi.org/10.1016/j.frl.2021.101999
- Umar, Z., Zaremba, A., & Olson, D. (2022). Seven centuries of commodity co-movement: A wavelet analysis approach. Applied Economics Letters, 29(4), 355–359. https://doi.org/10.1080/13504851.2020.1869151
- Yarovaya, L., Brzeszczyński, J., & Lau, C. K. M. (2016). Intra- and inter-regional return and volatility spillovers across emerging and developed markets: Evidence from stock indices and stock index futures. International Review of Financial Analysis, 43, 96–114. https://doi.org/10.1016/j.irfa.2015.09.004
- Yaya, O. O. S., Tumala, M. M., & Udomboso, C. G. (2016). Volatility persistence and returns spillovers between oil and gold prices: Analysis before and after the global financial crisis. Resources Policy, 49, 273–281. https://doi.org/10.1016/j.resourpol.2016.06.008
- Zaremba, A., Szczygielski, J. J., Umar, Z., & Mikutowski, M. (2021). Inflation hedging in the long run: Practical perspectives from seven centuries of commodity prices. The Journal of Alternative Investments, 24(1), 119–134. https://doi.org/10.3905/jai.2021.1.136
- Zaremba, A., Umar, Z., & Mikutowski, M. (2019). Inflation hedging with commodities: A wavelet analysis of seven centuries worth of data. Economics Letters, 181, 90–94. https://doi.org/10.1016/j.econlet.2019.05.002
- Zaremba, A., Umar, Z., & Mikutowski, M. (2021). Commodity financialisation and price co-movement: Lessons from two centuries of evidence. Finance Research Letters, 38, 101492. https://doi.org/10.1016/J.FRL.2020.101492
- Zhang, D., & Broadstock, D. C. (2020). Global financial crisis and rising connectedness in the international commodity markets. International Review of Financial Analysis, 68. https://doi.org/10.1016/j.irfa.2018.08.003
- Zhang, H., & Wang, P. (2021). Does Bitcoin or gold react to financial stress alike? Evidence from the U.S. and China. International Review of Economics & Finance, 71, 629–648. https://doi.org/10.1016/J.IREF.2020.10.007
Appendix
Table A1. Wavelet multiple correlations
Table A2. Wavelet multiple cross-correlations