
 ?Mathematical formulae have been encoded as MathML and are displayed in this HTML version using MathJax in order to improve their display. Uncheck the box to turn MathJax off. This feature requires Javascript. Click on a formula to zoom.
Abstract
World coffee prices may have crucial implications on domestic prices of coffee. However, empirical evidence on the effect of world coffee prices on the price of coffee traded at the Ethiopian Commodity Exchange (ECX) is very scant. The main objective of this study is to analyze the response of the price of coffee traded at ECX to change in world coffee price. Monthly time series data ranging from July 2009 to June 2020 were used to address the objectives of this study. The result of the Kapetanios and Shin unit root test shows that majority of the series are stationary at first difference while some variables are stationary at level. The ARDL bounds test was applied to examine whether co-movement exists between the world coffee price and the price of coffee traded at ECX and the result reveals that the two prices are cointegrated. The nonlinear ARDL was applied to test the presence of asymmetric price transmission from the world coffee price to the ECX coffee price. The result reveals that there is an asymmetric price transmission both in the short-run and long-run. ECX coffee prices respond more to a positive shock in world coffee prices than a negative shock in the same variable. Results from the dynamic ARDL simulations reveal that a counterfactual shock in world coffee price has a long-lasting short-and long-term effect on ECX coffee price. The TY and frequency-domain Granger causality test results indicate that all variables except the exchange rate the world coffee price Granger cause ECX coffee price. The frequency-domain Granger causality test results show that world coffee price, economic growth, and money supply granger cause ECX coffee price in the long-run while trade openness and volume of coffee exported granger cause ECX coffee price in the short term. Policymakers should focus on improving competitiveness and transaction cost prevailing in the coffee market in Ethiopia.
PUBLIC INTEREST STATEMENT
Understanding the effect of world commodity prices on the domestic price of the export commodities has substantial importance for policy making. This study aims to investigate the response of the price of coffee traded at the Ethiopian Commodity Exchange (ECX). This study reveals that the price of coffee traded at the ECX and the world coffee price are cointegrated/comove which indicated the coffee market integration. A shock in world coffee price transmits to the ECX coffee price asymmetrically. In the long run, the ECX price responds more to an increase in world coffee price than a decrease. The asymmetric price transmission indicates the presence of high transaction costs, weak competitiveness, and inefficiency in the Ethiopian coffee market. Moreover, results from simulation analysis show that a shock in world coffee price has a persistent asymmetric effect on the price of coffee traded at the ECX. The government of Ethiopia should work on improving the competitiveness and efficiency of the coffee market. Transaction costs and market power should be minimized to facilitate the fair transmission of coffee prices.
1. Introduction
Ethiopia is regarded as being the origin of Arabica coffee. Coffee is Ethiopia’s major cash crop and export commodity, which has been and continues to be the backbone of the country’s economy (Worako et al., Citation2008). According to USDA (Citation2021), coffee is the most important source of foreign currency for Ethiopia. Ethiopian coffee exports reached a new high of about 917 million US dollars in the 2017/18 marketing year, accounting for about 34% of the total export trade. According to the International Coffee Organization [ICO], Citation2020), Ethiopia is among the largest Arabica coffee growing countries which managed to increase its volume of green Arabica coffee export by more than triple.
Ethiopia’s primary export product, coffee, is the backbone of the Ethiopian economy (Petit, Citation2007). It leads the agricultural sector in terms of its contribution to the national economy in general and exports in particular. Coffee accounts for 4–5 % of Ethiopia’s GDP, 10% of overall agricultural production, 40% of total exports, 10% of total government revenue, and 25–30% of total export earnings (Ayele et al., Citation2021). Moreover, the coffee sector creates substantial job opportunities for the rural population of Ethiopia.
Given its economic and social importance to the Ethiopian economy, the performance of the coffee sub-sector has remained unsatisfactory. For decades, there has been no significant change in the way of production and processing. Imperfections in the arena and bad market infrastructure have been mentioned as important causes of low performance, among other factors (Worako et al., Citation2008). Furthermore, issues with market regulation policies and a lack of market infrastructure were recognized as important factors of poor performance (Seyoum, Citation2010).
About 95% of Ethiopian coffee is grown by small landholder farmers and coffee production supports the livelihood of more than 4.7 million smallholder farmers. Empirical studies reveal that producers only earn a tiny portion of the international price. The disparity is usually explained by high transportation and transaction costs, as well as monopsonistic rents captured by private traders or public marketing (Fafchamps & Hill, Citation2008; Osborne, Citation2005).
The Ethiopian Commodity Exchange market (ECX) was established in 2008 by the government to organize the Ethiopian coffee trade and improve the prices producers receive. Except for certified cooperatives or producers who can export directly from their commercial plantations, others must go through the ECX. Such policies and interventions have a considerable impact on the global value chain (GVC) operations and how the GVC actors benefit from them (International Coffee Organization [ICO], Citation2020).
Empirical studies are being undertaken to examine the effect of selling coffee through ECX on the price that goes to the producers. For instance, Handino et al. (Citation2019) investigated to document whether going through the ECX can earn the producers a higher price and they found no evidence that supports the argument. Besides, Hernandez et al. (Citation2015) and Hernandez et al. (Citation2017)found that the establishment of ECX did not connect all coffee regions in Ethiopia and integration across regional coffee prices is weak. The Ethiopian coffee growers receive the lowest price compared to their comparator countries like Kenya, Brazil, and India while the coffee price is substantially higher in the US and Europe. Daviron and Ponte (Citation2005) called this situation a “coffee paradox”, which characterizes the GVC for coffee. By the “coffee paradox,” the authors describe the situation where a “coffee boom” in developed countries co-exists with a “coffee crisis” in developing countries. A contradiction inside this paradox is that the international coffee market is flooded with “poor grade” coffee, while “high quality” coffee is in short supply—yet it is the latter that is driving sales growth. The central question of this study is that if the low of one price (LOP) is true, why does the lower coffee price fail to adjust to the higher international coffee price?
Price transmission in agricultural markets has drawn the attention of scholars. Myriad empirical studies identified more detailed phenomena of price transmission relationships and investigated how far price adjustments can be asymmetric. Peltzman (Citation2000) argues that asymmetric price transmission is rampant in the majority of agricultural markets. Cognizant of this, a plethora of studies were conducted to examine the APT from the international market to domestic agricultural markets (Baffes & Gardner, Citation2003; Dong et al., Citation2018; Gizaw et al., Citation2021; Laili et al., Citation2020; Mai et al., Citation2019; Mofya-mukuka & Abdulai, Citation2013; Rahmanta & Ayu, Citation2020; Rezitis & Tsionas, Citation2019; Simioni et al., Citation2012; Varela & Taniguchi, Citation2014).
Results of empirical studies focusing on APT are mixed and inconclusive. Some scholars (Dong et al., Citation2018) argue that asymmetric price transmission occurs only at higher price levels and volatility. Others documented that the magnitude of shock in the international market matters for price transmission to occur. For instance, Abidoye and Labuschagne (Citation2014) found that only large changes in world prices are transmitted to the domestic market. Other empirical studies posit that the level of economic growth is another father that influences price transmission. Price fluctuations and volatility in international agricultural markets do not always spread to all domestic and local markets in emerging economies (Ceballos et al., Citation2017; ICO, Citation2020). For instance, (Hernandez et al., Citation2017) argued that the correlation between the farm-gate price in Ethiopia and international prices is weak while the connection between auction prices and international is strong. They added that volatility in international prices is weakly transmitted to farm-gate prices. On the other hand, Worako et al. (Citation2008) argued that the price of the international coffee market to the Ethiopian auction market is too weak. These studies did not address asymmetric coffee price transmission. Only Seyoum (Citation2010) and Worako et al. (Citation2008) tried to touch the asymmetric coffee price transmission in Ethiopia using only price variables. However, these studies have shortcomings in that they ignore other very important macroeconomic variables like GDP, inflation rate, and the exchange rate that have a high potential of influencing coffee price, therefore, may suffer from omitted variable bias. These studies addressed the effect of world coffee prices on producers’ and auction market prices, not ECX traded coffee prices. Furthermore, they applied conventional econometric techniques. They failed to consider structural breaks which influence cointegration results. More specifically, the previous studies employed then ECM which addressed the speed dimension of the APT. Therefore, the current study pays due attention to the APT from world coffee price to the price of coffee traded at the ECX from a speed, magnitude, and direction dimension.
Ethiopian coffee production was predicted to be 7.25 million 60-kilo bags in 2018/19.
This situation has arisen as a result of excellent weather conditions, low disease and pest impact, adequate rainfall in coffee-growing regions, and improved extension services in some coffee-growing areas. Rainfall is the most important factor in coffee production because all coffee production is rain-fed. About 95% of Ethiopian coffee is grown by small landholder farmers in a variety of environments, including forest, semi-forest, garden, and plantation coffee. MY19/20 production is expected to be 1.1 million metric tons, according to the government’s second Growth & Transformation Plan (GTP II). Coffee yields are expected to rise from 0.75 tons per hectare in 2014/15 to 1.1 tons per hectare in 2019/20. By 2019/20, total production is expected to rise from 420 thousand tons in 2014/15 to 1103 thousand tons (USDA, Citation2021).
Given its economic and social importance to the Ethiopian economy, the performance of the coffee sub-sector has remained unsatisfactory. For decades, there has been no significant change in the way of production and processing. Imperfections in the arena and bad market infrastructure have been mentioned as important causes of low performance, among other factors (Worako et al., Citation2008). Furthermore, issues with market regulation policies and a lack of market infrastructure were recognized as important factors of poor performance (Seyoum, Citation2010).
Worako et al. (Citation2008) discussed that coffee growers in Ethiopia have always received a very little share of the export price before 1992, according to various researchers that examined the performance of this sub-sector. They were paid between 30 and 45 percent of the FOB price, whereas competitors from Brazil, Colombia, Kenya, and India were paid more than 80 percent of the world or FOB price. According to Seyoum (Citation2010), due to high transfer costs, there is a lack of market infrastructure. Poor infrastructure, transportation, and communication services, particularly in developing nations, can result in significant marketing margins due to the high costs of transporting locally produced goods to export ports, obstructing the transmission of price signals and so preventing arbitrage. A well-functioning agricultural exchange platform, which disseminates essential information to all decision-makers and provides storage as well as a legal framework for contract negotiations, has the potential to lower transaction costs.
The first theoretical papers like Baron (Citation1976), Ethier (Citation1973)), and Hooper and Kohlhagen (Citation1978) showed that the volume of trade will be diminished if traders are uncertain about how the exchange rate affects their firms revenue. Bahmani-Oskooee and Hegerty (Citation2007) argue, however, that uncertainty could improve trade flows if traders raise their trading volume to counter any future revenue loss owing to exchange rate volatility. Being an agricultural commodity, coffee is not only affected by the market price fluctuation of internal industry factors but also influenced by the volatility of non-agricultural products such as the World oil price, exchange rate (Tuyen et al., Citation2020).
Ethiopia is one of the developing countries where the agricultural markets had been characterized by high transaction costs. The absence of sufficient market coordination between buyers and sellers, a lack of market information, a lack of trust among market participants, and a lack of contract enforcement were all factors responsible for the high transaction costs.
According to Seyoum (Citation2010), According to the International Coffee Organization (ICO), many individuals working in the coffee industry in Ethiopia currently live on less than $1 per day. Coffee farmers are now selling it for a fraction of the cost of production. This is to explain why the price of coffee in producing countries is decreasing, affecting the living conditions of millions of people in developing countries.
According to Worako et al. (Citation2008), the world prices and domestic prices of coffee integration are somewhat increased during the regimes (i.e; before Derg, during Derg, and after Derg), but when compared to other coffee-producing countries, the response of the domestic coffee prices to the world coffee (price transmission to the actors of the market chain) prices is not satisfactory. Evidence shows that the producer shares price of Free on Board (FOB) for pre-and post-reform periods in most of the relatively important coffee exporting countries, such as Brazil and Colombia, has remained less volatile, even in post-reform periods, than countries such as Ethiopia, Uganda, and India. Similarly, Kenyan producer income has been quite stable.
Although some studies have examined the Ethiopian coffee price, coffee price transmission, coffee price volatility, and developing models of forecasting coffee prices, none of these studies have scrutinized the relationship between ECX coffee prices and world prices. Very few studies have addressed the coffee price, and its dynamics of change while others tried the transmission of coffee price Worako et al. (Citation2008)and Seyoum (Citation2010) through exchange actors to producers and concluded that there is no proportion share of the prices of coffee discovered by the world coffee market for those who produce coffee in Ethiopia.
Still, different authors like Abebe (Citation2020), Seyoum (Citation2010), and Worako et al. (Citation2008) did not reveal the response of ECX coffee prices to the world coffee prices. In addition to this, there are pieces of evidence that reflect the unmatched prices (ie; as world coffee prices increases, the ECX coffee prices decreases and vice versa). For example, the data from ICO and ECX observed for 6 months (Jan- June) during the trading year 2020, revealed this fact. Accordingly, the ICO data of the composite coffee price indicator from Jan—June were 1.16 USD/lb, 1.19 USD/lb, 1.09 USD/lb, 1.09 USD/lb, 1.04 USD/lb, and 0.99 USD/lb while the ECX coffee prices were 1.33 USD/lb, 1.31 USD/lb, 1.21 USD/lb, 1.19 USD/lb, 1.28 USD/lb, and 1.26 USD/lb respectively. So, here the hypothesis can be developed to know the relationships between the ECX coffee prices and world coffee prices (ICO, Citation2020) and (ECX, 2020). These and other claims came from the exchange actors and the intuition of all information initiated me to hold this study. Thus, this study mainly focused on the analysis of the responses of ECX coffee prices to the prices of coffee at the international market.
The contribution of this paper is two folds. First, to the best of the authors’ knowledge, no empirical study in Ethiopia utilizing macroeconomic variables has attempted to investigate the response of ECX coffee prices to world coffee prices. The previous studies that focus on Ethiopian coffee price transmission employed microeconomic data. Second, this study is unique in that it employs recent time series econometric techniques to generate reliable and robust results. Earlier studies relied on traditional cointegration and Granger causality tests, which have endogeneity problems, small sample bias, and are dependent on integration order. Besides, they assume the relationship between dependent and explanatory variables to be symmetric which may not work all of the time. The current study employed ARDL, nonlinear ARDL, and novel dynamic ARDL simulations which are efficient and robust approaches to examine the response of ECX coffee prices to world coffee prices in Ethiopia during the study period. Unlike the previous related empirical studies, this study employed the TY approach and frequency-domain approach to the Granger causality test which overcome the shortcomings of the conventional Granger causality tests.
The remainder of this study is organized as follows. Section 2 deals with the literature review. The materials and methods are presented in Section 3. The empirical results and discussion are detailed in Section 4. The conclusion and policy implications are presented in Section 5.
2. Literature review
The theory of price is one of the pillars of neo-classical economics. Flexible prices are essential for efficient resource allocation in this paradigm, and price transmission links markets vertically and horizontally (Meyer & von Cramon-Taubadel, Citation2004). Accordingly, studies that investigate market efficiency deal with price transmission processes. Asymmetric price transmission (APT) is one of the processes that attracted the attention of many scholars. Peltzman (Citation2000) argues that the standard theory of price that assumes symmetric price transmission is wrong as asymmetric price transmission appears to be the rule rather than the exception.
According to Meyer and von Cramon-Taubadel (Citation2004) classification of the type of price, transmission asymmetry is based on three criteria: magnitude, speed, and a combination of both. The first criterion is related to asymmetry in speed or magnitude of the price transmission. Asymmetric price transmission in magnitude refers to the size of the response of price in a particular market due to a change in price in another market while asymmetry in speed indicates the time it takes price in one market to adjust to a price change in another market. The second criterion classifies APT into negative or positive following Peltzman (Citation2000). Positive APT occurs when the price in one market responds more fully or rapidly to a rise in price in another market than to a fall. On the other hand, Asymmetric transmission is deemed negative when the price in one market responds more completely or quickly to a fall in the price in another market than a rise. The third criterion for classifying APT is whether price changes affect vertical or spatial transmission. Vertical APT deals with response of farm-gate price to change in wholesale or retail price, for example, while the spatial APT refers to response of price at a given market due to a shock in price at another market.
There are a plethora of empirical studies concerning APT (Abdel-latif et al., Citation2018; Alsamara et al., Citation2018; Fousekis et al., Citation2016; Gizaw et al., Citation2021; Kamaruddin et al., Citation2021; Paul & Karak, Citation2022; Sheikh et al., Citation2020; Subervie, Citation2011), but with inconclusive results can be seen from Table . The majority of the previous empirical studies applied weak econometric estimation techniques like the cointegration error correction model (Baffes & Gardner, Citation2003; Rahmanta & Ayu, Citation2020; Varela & Taniguchi, Citation2014; Worako et al., Citation2008), vector error correction method (Paul & Karak, Citation2022; Rezitis & Tsionas, Citation2019), threshold vector error model (Mai et al., Citation2019; Nikiema & Sakurai, Citation2020; Paul & Karak, Citation2022), threshold autoregression (Abunyuwah, Citation2020; Dong et al., Citation2018; Ghoshray, Citation2008). Only a few studies (Abdel-latif et al., Citation2018; Ibrahim, Citation2015; Kamaruddin et al., Citation2021; Kumar, Citation2017; Obeng, Citation2018) employed the second-generation econometric technique like the NARDL to investigate the APT. Moreover, empirical studies that focus on APT in coffee are very scant (Gómez & Koerner, Citation2009; Hernandez et al., Citation2017; Kamaruddin et al., Citation2021; Krivonos, Citation2004; Mai et al., Citation2014, Citation2019; Mofya-mukuka & Abdulai, Citation2013; Rahmanta & Ayu, Citation2020; Seyoum, Citation2010; Subervie, Citation2011).
Table 1. Summary of the empirical literature
However, the majority of the previous studies are criticized on the grounds of employing conventional econometric techniques. They applied ECM to examine APT that ignores the direction and magnitude dimension of the APT. The conventional econometric approach is unable to test for price transmission particularly when endogenously unstable do not equilibrate due to arbitration (Huffaker et al., Citation2021).
3. Materials and methods
3.1. Data and variable description
Data used in this study are obtained from the National Bank of Ethiopia (NBE), the Ethiopian Commodity Exchange (ECX), and the International Coffee Organization (ICO). Monthly data covering a period from 2009 to 2020 were used in this study. The selection of the time is dictated by data availability. shows the definition of variables as well as descriptive statistics for variables of interest.
3.2. Theoretical framework and model specification
The Law of One Price (LOP) underpins the spatial price transmission (Abidoye & Labuschagne, Citation2014; Fackler & Goodwin, Citation2001; Huffaker et al., Citation2021; Lence et al., Citation2017; Nikiema & Sakurai, Citation2020). Domestic prices are associated with international prices mainly through trade. The LOP states that market transaction costs will cause equilibrium prices of the same item in different marketplaces to vary. That is, transaction cost () equals the difference between equilibrium prices of the same commodity in two marketplaces (
). A spatial-arbitrage requirement prevents
and
from being stable when the market is hit by random shocks. Whenever the market equilibrium is disturbed due to market shocks, the re-equilibrating price differs at most by transaction cost. According to Fackler and Goodwin (Citation2001), when prices have re-equilibrated, complete price transmission occurs; nevertheless, transmission remains incomplete during an adjustment period whose length is determined by the rate of adjustment. When it is not profitable to export or import the commodity, spatial arbitrage connects the domestic price with the international prices through trade. Another form of arbitration that links current prices with future prices through storage is illustrated in .
Figure 1. Relationship between domestic and international prices.
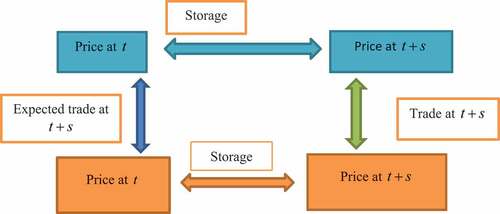
Following the LOP, we included world coffee price as one of the potential determinants of the price of coffee traded at ECX. The inclusion of GDP, inflation rate, and exchange rate in the econometric model is motivated by Simbolon and Purwanto (Citation2018)
The principal objective of this study is to scrutinize the responses of ECX coffee prices to world coffee prices using econometric analysis. To this end, the following econometric model is specified following previous related literature:
3.3. Estimation techniques
3.3.1. Unit root tests
The estimation techniques used in this study, which include ARDL and dynamic ARDL approaches to Cointegration, and TY and frequency-domain methods to Granger causality, are applicable regardless of the order in which the variables are integrated. Nonetheless, performing a unit root test has three key benefits. First, the use of ARDL and dynamic ARDL needs to ensure that the dependent variable is strictly I(1; Jordan & Philips, Citation2018; Sarkodie & Owusu, Citation2020). Second, make sure that none of the independent variables are in a higher than integration order of I(1). Third, a unit root test is necessary to determine the maximum lag length to perform the TY Granger causality test using the VAR (p). In this study, we use the following unit root tests for testing whether the variables under consideration are stationary or not.
The study conducted a stationarity test to distinguish appropriate econometric estimation techniques to obtain robust results. The conventional unit root tests are spurious in explaining true dynamics in macroeconomic variables because they are based on linear hypotheses and they fail to consider any nonlinearity in the deterministic components (Liu & He, Citation2010). To address this issue, Kapetanios and Shin (Citation2008) developed a GLS detrending test for the null of unit root against nonlinear alternatives under which the time series follow a globally stationary exponential smooth transition autoregressive (ESTAR) process. A detailed mathematical presentation of the Kapetanios and Shin (Citation2008) unit root test is obtained in Otero and Smith (Citation2017).
3.3.2. Cointegration test
3.3.2.1. ARDL bounds testing to cointegration
We use the autoregressive distributive lag (ARDL hereafter) bounds test in the cointegration approach to investigate the long-run connection amongst variables mentioned in EquationEquation (1)(1)
(1) . EquationEquation (2)
(2)
(2) presents the unrestricted error correction model (UECM) version of the ARDL model for EquationEquation (1)
(1)
(1) .
The long-run coefficients corresponding to EquationEquation (2)(2)
(2) are denoted by parameters
, while
are the short-run dynamic coefficients of the UECM.
Examining the existence of cointegration between variables of interest stated in EquationEquation (2)(2)
(2) using the ARDL approach requires testing the following hypothesis:
against. Since F-statistic used in the above hypothesis testing is highly influenced by lag length, this study used the Akaike Information Criterion (AIC) to determine the optimal lag length for estimation of the UECM in EquationEquation (2)
(2)
(2) . We reject the null hypothesis of no levels relationship if the F-statistic is greater than the upper critical bound, i.e., I(1), implying that the variables in the model are cointegrated. On the other hand, if the F-statistic is less than the lower critical bound, the null hypothesis is retained which indicates the absence of cointegration. The result is indeterminate if the calculated F-statistic falls between I(0) and I(1) critical bounds.
The next step is estimating the long-run and short-run models specified in EquationEquations (3)(3)
(3) and (Equation4
(4)
(4) ) respectively provided that cointegration is established among the variables.
Where and
are error terms,
represents the speed of adjustment towards the long-run equilibrium and
is lagged error correction term calculated from the estimated cointegrated model.
3.3.2.2. Nonlinear ARDL Technique to Cointegration
The standard ARDL estimates the long-run between time series variables with the assumption that the relationship between them is linear or symmetric. However, the relationship between the independent and dependent variables may be asymmetric. To examine whether the impact of the individual explanatory variable on the response variables is symmetric or asymmetric, the current study employed nonlinear ARDL developed by Shin et al. (Citation2014). The nonlinear ARDL model can be stated as below:
Where signifies long-run and
denotes short-run coefficients.
3.3.2.3. Dynamic simulations of ARDL
Even though the ARDL bounds test to cointegration outperforms conventional cointegration testing techniques the existence of lags, contemporaneous values, first differences, and lagged first differences of the independent and the dependent variable in the model specification interprets the ARDL results complex (Jordan & Philips, Citation2018). To overcome this difficulty, we employed dynamic simulations of ARDL models because it helps us better interpret the practical significance (structural policy modeling) of the long-run and short-run coefficients estimated through the ARDL approach. The chief strength of this model is that it captures and automatically predicts the counterfactual responses of the dependent variable to shock in a single explanatory variable keeping other things constant (Abbasi et al., Citation2021; Jordan & Philips, Citation2018; Sarkodie et al., Citation2020; Sarkodie & Owusu, Citation2020; Solarin et al., Citation2021). The ARDL simulations are expressed as below:
3.3.2.4. Toda-Yamamoto granger causality test
The direction of the causal relationship among ECX coffee price, world coffee price, exchange rate, the volume of coffee exported, inflation rate, money supply, economic growth, and trade openness is tested using the Toda and Yamamoto (Citation1995) Granger causality (TY hereafter) approach. This approach is selected because it has several advantages compared to the conventional Granger causality techniques (Ahmed et al., Citation2020; Toda & Yamamoto, Citation1995; Uzar & Eyuboglu, Citation2019).
In conducting the TY Granger causality test, we estimate a -order VAR model where k is the appropriate lag order of the VAR model and
is the highest order of integration. The TY Granger causality representation of Ep is given as follows:
TY equations for other series can be formulated in the same way. The TY approach uses the modified Wald test to ascertain the direction of the causal relationship amongst variables in EquationEquation (7)(7)
(7) .
3.3.2.5. Frequency-domain Granger Causality Test
To scrutinize the causal relationship among ECX coffee price, world coffee price, exchange rate, the volume of coffee exported, inflation rate, money supply, economic growth, and trade openness at different frequencies, this study employed a frequency-domain Granger causality test approach. The frequency-domain Granger causality test approach enables us to discriminate the short-, medium-, and long-term causal relationships among variables in EquationEquation (7)(7)
(7) . This technique was developed based on the TY causality testing approach; thus, it possesses all advantages of the TY approach. However, the frequency-domain Granger causality testing approach has additional novel advantages. It eliminates seasonal variations since it allows small sample data. Moreover, the approach distinguishes non-linearity and stages of causality in a time series (Adebayo et al., Citation2021).
Following Breitung and Candelon (Citation2006) an equation for a frequency-domain causality test in its cointegrating framework is given below:
The null hypothesis that does not Granger cause
at frequency
is denoted within a bivariate framework. This hypothesis is equivalent to the following linear restriction (Tastan, Citation2015).
Where,
and
.
4. Results and discussions
4.1. Unit root test results
Before conducting a long-run relationship among the variables in EquationEquation (4)(4)
(4) and Granger causality stated in EquationEquation (8)
(8)
(8) , we check for the unit root properties of the variables. presents results from the Kapetanios & Shin unit root test. The result reveals that lnVX and lnIR are stationary at level [I (0)] while the remaining variables (lnEp, lnWp, lnER, lnM, lnTO, and lnGDP) are I (1). Moreover, the results in also confirm that the variables under study have mixed unit root properties (I (0) or I (1)). Now we ensured that the conventional cointegration and Granger causality tests are not appropriate for our study. Moreover, the dependent variable being I(1) and the absence of exploding independent variable make the application of both ARDL and dynamic ARDL approaches more appropriate in our analysis.
Table 2. Variables description and descriptive statistics
Table 3. Kapetanios & Shin unit root test
4.2. Cointegration test results
The first step in undertaking the ARDL bounds cointegration test is determining lag length because the result is lag length sensitive. We used Akaike Information Criteria (AIC) to determine the lag length used in estimating the ARDL bounds cointegration test. The model is estimated under unrestricted constant and unrestricted trend deterministic components.
The result in discloses that the variables under consideration are cointegrated because the F-statistic (3.59) exceeds the upper bound critical value (3.56) at a 5% level of significance. Similarly, the novel Bayer and Hanck (Citation2013) combined cointegration test presented in shows that the null of no cointegration is rejected at a 5% level of significance confirming that the variables are cointegrated.
Table 4. ARDL bounds Cointegration, and Bayer and Hanck Cointegration Tests
4.3. Estimation of long-and short-run coefficients using the ARDL approach
This section presents the long- and short-run estimates resulting from the ARDL approach. Long- and short-run relationships are estimated based on the selected ARDL model. The empirical results of long- and short-run relationships are provided in and respectively.
Table 5. Long-run coefficients
Table 6. Error correction representation for the selected ARDL model
Table 7. NARDL Co-integration Test
The long-run relationship coefficients portrayed in show that the coefficient of lnWp is positive and statistically significant at a 1% level of significance. More specifically, a 1% upsurge in world coffee prices results in a 0.74% rise in the price of coffee traded at ECX, keeping other things constant.
The long-run positive effect of world coffee prices on Ethiopian coffee domestic prices is because domestic prices adjust to world price changes. This finding is coherent with Worako et al. (Citation2008), Seyoum (Citation2010), Kebede (Citation2021), and Worako et al. (Citation2008) asserted that the world prices and domestic prices of coffee integration somewhat increased after coffee market reform was introduced. For example, as the coffee prices increased in the world market, the response of coffee prices in Ethiopia is about 60% after the market reform (post derg) and this price response was transmitted to the producers structurally. But the response of domestic coffee market prices to the world coffee prices changes in Burundi, Kenya, and Uganda, 66%, 74%, and 165% respectively, is greater than that of Ethiopia. A study by Seyoum (Citation2010) suggests that the price of the auction (domestic) market moves together with foreign prices in the long- run.
The long-run coefficient of the inflation rate is positive and statistically significant at a 1% level of significance. This shows that the inflation rate has a long-run positive effect on the prices of coffee traded at ECX. The coefficient of the variable, 0.0685 indicates that a 1% increase in the inflation rate results in a 0.0685 USD increase in ECX coffee prices in the long-run, ceteris paribus. This finding supports the studies of Ayele et al. (Citation2021), which argued that the impact of the inflation rate on the prices of coffee is positive in the long run.
The positive relationship between inflation and commodity price volatility is consistent with theory and previous literature. Breitung and Candelon (Citation2006), the commodity price-inflation connection is that commodities are often used as inflation hedges which could be used to encourage commodity investment. As a result, commodity investments protect the real purchasing power of market participants, and the rise and fall in commodities-related to unexpected deviation from components of inflation.
The coefficient of trade openness is negative but not statistically insignificant. This implies that trade openness is not a predictor of the price of ECX traded coffee. This may be ascribed to the fact that though the Ethiopian government has made significant coffee market reforms and liberalization, still it has a heavy intervention in the coffee market (Kebede, Citation2021). For instance, private coffee traders are obligated to sell coffee through the ECX since the establishment of the Ethiopian Commodity Exchange. License allocation and strict monitoring of the local market to confirm that export-quality coffee is not being sold in the local market are other government interventions.
The volume of Coffee exported (lnVx) is statistically significant and affects the prices of coffee traded at ECX positively in the long run. More precisely, a 1% unit increases in the trade openness results in a 0.1726% increase in ECX coffee prices other variables remain constant. This is consistent with the old Wall Street saying that asserts: “it takes volume to move prices”. It has become the stylized fact that previous empirical studies that studied contemporaneous relations between volume and prices found a positive relationship between the variables. Sercu and Vanhulle (Citation1992) claim that as volatility rises, the value of exporting firms rises as well, promoting exports. According to Broll and Eckwert (1999), volatility raises the value of a trader’s choice to export; because this risk raises the possible gains from trade, the volume of trade will rise as well. Similarly, this study confirms that the more the trade openness to the global market, the lower the long-term ECX coffee prices.
The exchange rate has a negative and statistically significant coefficient, implying that it has a long-term negative impact on coffee prices traded at the ECX. A 1% upsurge in the exchange rate results in a 0.2460% decline in the prices of coffee traded at ECX, ceteris paribus. This result is in contradiction with the finding of Tuyen et al. (Citation2020) who found a statistically insignificant effect of rechange rate on the Vietnamese coffee price. The more the exchange rate fluctuates, the more the prices of the ECX coffee prices decrease. This completely harms the suppliers of coffee and decreases the production of coffee in the country. Currently, the foreign exchange rate increases daily and this implies that it may decrease coffee prices at ECX trade.
Money supply (lnM2) has no statistically significant impact on the prices of coffee traded at ECX in the long run. This finding contradicts the findings of Abebe (Citation2020) and Tekle (2019) who explained that an increase in monthly money supply increases coffee prices in the future. This might be because of the impact of data type and sample size covered in the study. Similarly, trade openness and GDP are not statistically significant and therefore fail to explain variations in prices of coffee traded at ECX.
The error correction representation of the specified ARDL model is shown in . The coefficient of the lagged error term () is negative (−0.4336) and statistically significant at the 1% level. It reveals that the divergence from the long-term ECX coffee price path due to certain shocks is adjusted by 43.36% over the next year. This implies that complete adjustment takes about 2.3 years. World coffee price determines short-run dynamics in the price of coffee traded at ECX. Besides, lnGDP, inflation rate, trade openness, and volume of coffee exported predict short-run dynamics of the price of coffee traded at ECX.
4.4. Stability of estimated model
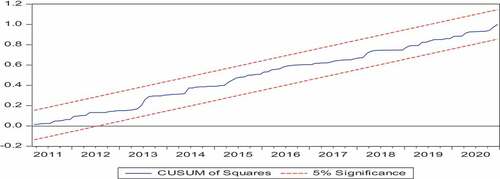
Misspecification of the model in time series data, according to Hansen (Citation1992), might lead to biased conclusions. This reduces the model’s ability to explain empirical data and casts doubt on its suitability for policy-making decisions. To test the structural stability of the estimated coefficients, we use the cumulative sum (CUSUM) and cumulative sum squares (CUSUMSQ) of the recursive residuals.
The results in demonstrate that at a 5% significance level, both CUSUM and CUSUMSQ fall inside the critical boundaries, confirming the estimated model’s stability across the studied period. As a result, the model can be used in Ethiopia for economic analysis, policy formulation, and recommendation.
Figure 2. Plot of the cumulative sum of recursive residuals.
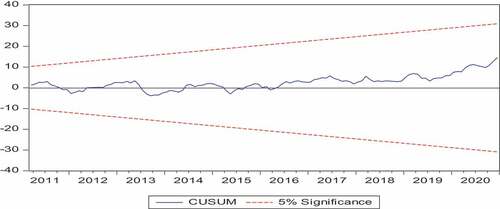
Figure 3. Plot of the cumulative sum of squares of recursive residuals.
The NARDL co-integration test’s short- and long-run results are shown in . In the short and long run, the effect of world coffee prices on ECX coffee prices is asymmetric, according to the findings. Keeping other variables equal, a 1% increase in world coffee prices translates into a 1.955 percent increase in ECX coffee prices, while a 1% fall in world coffee prices results in a 0.596 percent decrease in ECX coffee costs. In both the short and long run, the remaining explanatory variables have an asymmetric effect on ECX coffee prices.
This implies that change in world coffee price asymmetrically transmits to the Ethiopian coffee traded at the ECX. The domestic coffee price in Ethiopia is more responsive to the world coffee price rises than the fall. This finding is consistent with the finding of Mofya-mukuka and Abdulai (Citation2013) and Peltzman (Citation2000). This consistent with the “rockets and feathers” hypothesis which states that prices increase like rockets but falls like feathers (Tappata, Citation2009). Mofya-mukuka and Abdulai (Citation2013) found that the effect of an increase in world market price on the domestic price is stronger than its fall in a country where government intervention is rigorous. Even though the Ethiopian coffee market is more liberalized compared to the Derg regime, the government maintains a strong involvement in the coffee trade (Gabre-madhin, Citation2012; Kebede, Citation2021). In the short run, the asymmetric price transmission is observed in terms of magnitude. The ECX coffee increases in the short-run following both negative and positive shocks to the international coffee prices but it is more responsive to price rises. There is no asymmetry in direction and speed as illustrated in the following table.
Table
4.5. Granger causality test results
Determining the optimal VAR lag length is very crucial in undertaking the Granger causality test. Akaike’s information criteria (AIC) is used to determine VAR lag length since it has superior power properties, and provides efficient and consistent results. The selected optimal lag length is 8 as indicated in . The unit root test results reveal that the maximum order of integration is 1 while some variables are found to be stationary at level. Having variables with mixed, I(1) and I(0), order of integration the TY Granger causality approach is appropriate.
Table 8. VAR lag order selection criteria
By augmenting the VAR(8) system with the maximum order of integration which is 1, we estimate the VAR(9) system to conduct the TY Granger causality test. Seemingly unrelated regression (SURE) was employed to estimate the VAR(9) system since it yields an efficient coefficient and makes computing modified Wald test statistics easier.
presents TY Granger causality test results. Column variables are sources of causation while those on the row are dependent variables.
Table 9. Toda-Yamamoto Granger causality test result
To scrutinize the long-, medium-, and short-run causal relationship among lnECXp, lnWp, lnER, lnVX, lnIR, lnM2, lnTO, and lnGDP, this study applied a frequency-domain causality test. shows the results of the Granger causality tests obtained from the frequency-domain approach. The result reveals that world coffee price is a powerful predictor of ECX coffee prices in the long-run because the null hypothesis of no Granger causality is rejected at a 1% level of significance. However, world coffee prices do not Granger cause coffee prices traded at the ECX at medium- and short-term. Money supply and GDP Granger cause ECX prices in the long-term meanwhile volume of coffee export and trade openness Granger cause ECX coffee prices in the short-term. None of the variables under study Granger cause ECX coffee prices in the medium-term.
Table 10. Frequency Domain Causality Test
4.6. Dynamic ARDL simulations results
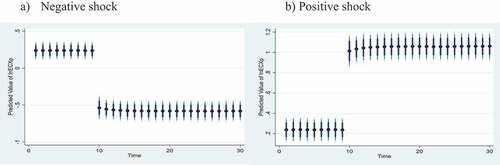
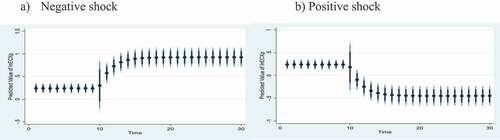
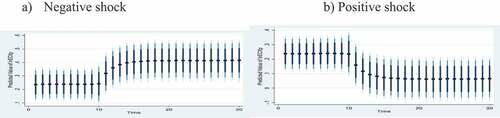
This section presents empirical results from novel dynamic ARDL simulations. The novel dynamic ARDL simulations were employed to capture the effect of future shocks in the independent variables on the ECX coffee prices. Each plot of the dynamic ARDL simulations shows a counterfactual effect of a ±1% shock in an independent variable under consideration, ceteris paribus, on the ECX coffee price. To determine the length of the simulation scenario, each plot was constructed using 10 scenario times from a range of 30. The dark to light-colored lines indicates the 75%, 90 %, and 95 % confidence intervals, while the points represent the mean predicted value.
depicts the effect of counterfactual shock in world coffee prices on the ECX coffee prices. A 1% decrease in world coffee prices has an adverse impact on the ECX coffee price both in the short-run and long-run. A 1% boost in world coffee prices has a positive effect on short-and long-term ECX coffee prices. The result reveals that a boost in world coffee prices has a substantial effect on ECX coffee prices compared to a decline in world coffee prices. This confirms that transmission of world coffee prices to the ECX coffee price is asymmetric in magnitude and direction. The effect of shock in the world prices on the ECX coffee price is persistent as illustrated in .
Figure 4. Effect of counterfactual shock in world coffee prices on ECX coffee prices.
The response of ECX coffee prices to a counterfactual shock in the exchange rate is illustrated in . The impulse response graph shows that a 1% decrease in exchange rate slightly rises ECX coffee prices in the short run but the effect is large in the long-run. On the other hand, a 1% rise in exchange rate boosts ECX coffee prices and the effect are long-lasting. When the exchange rate upsurges by 1%, it has an adverse effect on ECX coffee prices in the long run. When the effects of the two shocks are compared, the effect of a positive shock in the exchange rate outweighs that of a negative shock in the exchange rate indicating asymmetric effect of exchange rate on the ECX coffee prices.
Figure 5. Effect of counterfactual shock in the exchange rate on ECX coffee prices.
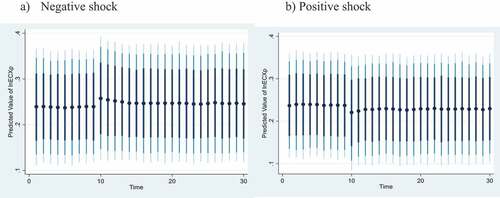
specifies the effect of shock in the volume of coffee exported on EXC coffee prices. A 1% decrease in the volume of coffee export increases ECX coffee prices in the short run, but it starts declining over time in the long run. A 1% increase in the volume of coffee export has a negative effect on ECX coffee prices in the short-run. The result confirms that both negative and positive shocks in the volume of coffee exported have the same effect on ECX coffee prices in magnitude. This result shows that the effect of shock in volume of exported coffee has a temporary that occurs only in the short-run.
Figure 6. Effect of counterfactual shock in a volume of export on ECX coffee prices.
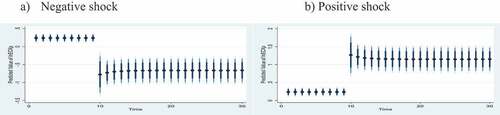
As illuminated in a counterfactual negative shock in interest rate harms ECX coffee prices in the short-and long-run though coffee prices start improving slightly over time in the long run.
Figure 7. Effect of counterfactual shock in the interest rate on ECX coffee prices. (a) Negative shock. (b) Positive shock.
In the short run, a 1% boost in interest rate improves ECX coffee prices while the effect turns out to be negative gradually decreases in the long-run. This reveals that interest rate shock has an asymmetric long-lasting effect on the EXC coffee prices.
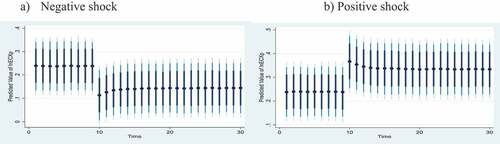
The effect of counterfactual shock in money supply on ECX coffee prices is presented in . The result reveals that a 1% negative shock in money supply has a negative effect on ECX coffee prices in the short run. However, the shock boosts ECX coffee prices in the long run and the effect persists in the long run. Contrary, a 1% money supply upsurge results in ECX coffee prices boom in the short-term while the effect turns out to be negative in the long run.
Figure 8. Effect of counterfactual shock in money supply on ECX coffee prices.
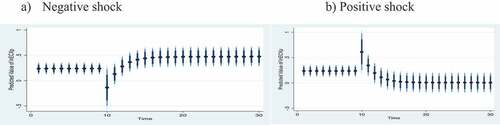
indicates that neither a positive shock nor a negative shock in trade openness has an impact on ECX coffee prices in the short run. However, a 1% negative shock in trade openness has a positive and persistent effect on ECX coffee prices in the long term while the effect of a 1% positive shock in the same variable is negative and long-lasting.
Figure 9. Effect of counterfactual shock in trade openness on ECX coffee prices.
The effect of a counterfactual shock in economic growth (GDP) on ECX coffee prices is depicted in . A 1% shrink in economic growth leads to a decline in ECX coffee prices in the short term while it boosts the price in the long term. A 1% increase in economic growth improves ECX coffee prices in the short run but the price deteriorates over time in the long run due to the shock.
Figure 10. Effect of counterfactual shock in GPD on ECX coffee prices.
5. Conclusion and recommendation
Knowing the effect of world prices on domestic prices of the export commodity is very crucial as it has welfare implications both for a country as well as producers. A plethora of empirical studies was conducted to investigate how domestic commodity prices respond to the international market prices with inconclusive results. These studies are criticized for employing weak econometric estimation techniques. This study aims to analyze the response of coffee prices traded at the ECX to the international coffee prices under the asymmetric price transmission (APT) concept by employing second-generation econometric techniques. The ARDL a nonlinear ARDL to examine whether the domestic coffee price is integrated with the international coffee prices. ECX coffee price adjusts itself at an adjustment speed of 43.4% toward the long-run equilibrium to respond to any shock that occurred in the world coffee price and inflation rate at the current moment. The nonlinear ARDL is applied to explore the asymmetry in price transmission regarding magnitude, direction, and speed. The novel dynamic ARDL is used to examine the effect of future shocks in world coffee prices on ECX coffee prices.
All the series are stationary at first difference except the volume of coffee exported and inflation rate, those became stationary at level. According to the F-bound test, there is a cointegration relation among the variables in the long term. Different diagnostic tests like the Serial correlation LM test, homoscedasticity, stability, and normality were tested and the model was fitted to proceed to the interpretation of the results of the regression.
Results from both the ARDL and nonlinear ARDL approaches to cointegration show that the variables under study are cointegrated in a non-linear fashion. More specifically, the ECX coffee price and international coffee price cointegrated implying that the deviation of ECX coffee prices from the long-run equilibrium due to a certain shock is adjusted towards the equilibrium asymmetrically. This suggests that the ECX coffee market is integrated with the international coffee market. Another essential finding of this study is that the international coffee prices transmit asymmetrically to the ECX coffee prices both in the long-run and short-run. In the long-run, transmission of the world coffee prices to the ECX coffee price is asymmetric both in magnitude and direction. The ECX coffee price responds more to an increase in the world coffee prices that its decreasing. Only asymmetric price transmission in magnitude is observed in the short run. High transaction costs, weak competitiveness, and inefficiency of Ethiopian coffee in the world coffee market are responsible for the price transmission asymmetry.
The long-run estimated coefficients of the variables using the NARDL approach indicated that about 93% of the variations in the dependent variable were explained by the variables included in the model, while 7% of the variations were explained by other factors that did not consider in this model. World coffee prices, the volume of coffee exported and the inflation rate affects the prices of coffee traded at ECX positively, while the exchange rate affects the prices of ECX coffee negatively. On the other hand, the short-run estimation of the variables in the model reflected that only two variables can fit the regression procedures and adjust themselves at the current period towards the long-run equilibrium from the previous deviations. Still, the world coffee prices and inflation rate can affect the ECX coffee prices positively. ECX coffee price adjusts itself at an adjustment speed of 43.4% toward the long-run equilibrium to respond to any shock that occurred in the world coffee price and inflation rate at the current moment.
The effect of future shocks in the world price on the ECX coffee price is simulated using the novel dynamic ARDL model. The result shows that a positive shock in the world coffee prices significantly increases the ECX coffee prices both in the short-run and long-run while a negative shock negatively affects the ECX coffee price in the short-run and long run. The magnitude of increase in the ECX coffee price due to the positive shock in the world coffee prices is greater than the magnitude of decrease due to a negative shock confirming the asymmetric price transmission.
Granger causality test result indicates that causality runs from world coffee price to price of coffee traded at ECX in the long-run with no feedback. Volume of coffee exported Granger causes ECX coffee price only in the short-run while Granger causality runs from GDP to ECX coffee prices both in the short-run and long-run. Granger causality test result implies that there is a relation between world coffee price and ECX coffee price and trade openness and ECX coffee prices. The granger causality test also indicates that trade openness granger causes money supply. The causality test results in this study indicated that the world coffee price and trade openness can cause the ECX coffee prices, but no ECX coffee price causes world coffee prices and trade openness. The short-run causality came from trade openness; the granger causes money supply without feedback. And the granger causality between the variables is unidirectional and with no feedback.
Based on the findings of this study some points might be forwarded to the concerned body here as the following: Existence of APT from the world coffee price to price of coffee traded at ECX implies that the coffee market in Ethiopia fails to perform a perfectly competitive market structure. This is due to high transaction cost, inefficiency and presence of market power. Therefore, policymakers need to exert concerted effort to improve competition and reduce transaction cost.
The world coffee price is the main variable that influences the ECX coffee prices positively. So, it is important to have this data and use it for further price forecasting and analysis. Since the world coffee price is the major variable that influences the ECX coffee price both in the long run and short run, the ECX organization should disseminate this world coffee prices information widely to the beneficiaries and improve the infrastructures that can simply spread information to the local coffee suppliers, especially the local farmers and coffee suppliers in the language they can understand to have a piece of the right information at the right time.
The inflation rate is also another independent variable that is statistically significant and has a positive impact on the prices of coffee traded at ECX both in the long and short run. The positive relationship between inflation and commodity price volatility is consistent with theory and previous literature. As a result, commodity investments protect the real purchasing power of market participants, and the rise and fall in commodities related to unexpected deviation from components of inflation should be managed by the government.
According to this study, the volume of coffee exported affects ECX coffee prices negatively in the long run. This shows that the quantity of coffee exported determines the price of coffee traded at ECX implying that the concerned body focuses on the production of coffee to increase the volume of coffee exported to the world market. So, the government should have to supply technology to farmers to increase the quantity and quality of the commodity to compete in the global market.
According to this study, the exchange rate is an explanatory variable that influences ECX coffee prices. The more the exchange rate increases/decreases, the more the prices of the ECX coffee prices decrease/increase and vice versa. This completely harms the suppliers of coffee and decreases the production of coffee in the country. The concerned body should focus on the implementation of a foreign exchange rate policy to protect the unnecessary exchange fluctuations.
6. Limitations and suggestions for further studies
The absence of price integration does not necessarily imply the presence of market inefficiency or trade restrictions (Minot, Citation2010). Barrett and Li (Citation2002) and Negassa and Myers (Citation2007) argued that transaction costs create a price range in a given market over which it is unaffected by price in another market. For instance, if the domestic price falls between the export parity price and import parity price, it will not move in tandem with the international price though markets are efficient and there are no trade policy restrictions. To overcome this, the parity bounds model (PBM), threshold autoregressive (TAR), moving threshold autoregressive (M-TAR) model, threshold cointegration
It is well understood that structural breaks can hide cointegrating relationships and render cointegration tests ineffective. More specifically, Von Cramon-Taubadel and Meyer (Citation2000) argued that the presence of structural breaks leads to a significant over-rejection of the null hypothesis of symmetric price transmissions. Therefore, future related studies should consider cointegration techniques that take structural breaks into account to improve the reliability of inference.
Empirical evidence indicates that data frequency plays a crucial role in identifying and quantifying price transmissions (Meyer & von Cramon-Taubadel, Citation2004; Miller & Hayenga, Citation2001). Low-frequency data like annual, quarterly, and monthly data are invaluable for examining asymmetry in price transmissions particularly when it is less than the actual frequency of the adjustment process. This is because price transmission takes place within days or weeks. Therefore, future studies that will focus on the analysis of asymmetry in coffee price transmission can better contribute to the existing stock of knowledge by using high-frequency data such as daily or weekly data. The current study is limited to the investigation of international coffee prices transmission to the price of coffee traded at the ECX. Different studies show that coffee collectors and exporters more benefited compared the producers due to the market power they have. Therefore, future studies can investigate the price transmission between ECX or export price and the farm-gate price using second-generation econometric techniques.
Availability of data and materials
The datasets used and/or analyzed during the current study are available from the corresponding author on reasonable request.
Consent for publication
Not applicable
Ethics approval and consent to participate
Not applicable
Disclosure statement
No potential conflict of interest was reported by the author(s).
Additional information
Funding
Notes on contributors

Shemelis Kebede Hundie
Shemelis Kebede Hundie is a lecturer at the Ethiopian Civil Service University, Ethiopia. His research interests lie in energy, environmental sustainability, firms’ innovation, and economic growth. Shemelis has published in Environmental Science and Pollution Research, Journal of Economic Structures, and Journal of Innovation and Entrepreneurship. Bane Biratu is an expert at the Ethiopia Commodity Exchange Authority. His research interests are project delay and project management and their effect on project performance.
References
- Abbasi, K. R., Shahbaz, M., Jiao, Z., & Tufail, M. (2021). How energy consumption, industrial growth, urbanization, and CO2 emissions affect economic growth in Pakistan? A novel dynamic ARDL simulations approach. Energy, 221, 119793. https://doi.org/10.1016/j.energy.2021.119793
- Abdel-latif, H., Osman, R. A., Ahmed, H., & Charfeddine, L. (2018). Asymmetric impacts of oil price shocks on government expenditures : Evidence from Saudi Arabia. Cogent Economics & Finance, 6(1), 1–27. https://doi.org/10.1080/23322039.2018.1512835
- Abebe, T. H. (2020). Modeling time-varying coffee price volatility in Ethiopia. Journal of Applied Economics, 23(1), 497–518. https://doi.org/10.1080/15140326.2020.1804304
- Abidoye, B. O., & Labuschagne, M. (2014). The transmission of world maize price to South African maize market : A threshold cointegration approach. Agricultural Economics, 45(4), 501–512. https://doi.org/10.1111/agec.12102
- Abunyuwah, I. (2020). Modeling market integration and asymmetric price transmission dynamics of yam markets in Ghana. Journal of Economics and Behavioral Studies, 12(3), 23–31. https://doi.org/10.22610/jebs.v12i3(J).2710
- Adebayo, T. S., Genç, S. Y., Castanho, R. A., & Kirikkaleli, D. (2021). Do public–private partnership investment in energy and technological innovation matter for environmental sustainability in the east Asia and Pacific region? An application of a frequency domain causality test. Sustainability, 13(6), 1–15. https://doi.org/10.3390/su13063039
- Ahmed, Z., Asghar, M. M., Malik, M. N., & Nawaz, K. (2020). Moving towards a sustainable environment: The dynamic linkage between natural resources, human capital, urbanization, economic growth, and ecological footprint in China. Resources Policy, 67(March), 101677. https://doi.org/10.1016/j.resourpol.2020.101677
- Alsamara, M., Mrabet, Z., & Dombrecht, M. (2018). Asymmetric import cost pass-through in GCC countries : Evidence from nonlinear panel analysis . Economic Modelling, 75(July), 432–440. https://doi.org/10.1016/j.econmod.2018.07.014
- Ayele, A., Worku, M., & Bekele, Y. (2021). Heliyon Trend, instability and decomposition analysis of coffee production in Ethiopia (1993 – 2019). Heliyon, 7(9), e08022. https://doi.org/10.1016/j.heliyon.2021.e08022
- Baffes, J., & Gardner, B. (2003). The transmission of world commodity prices to domestic markets under policy reforms in developing countries. The Journal of Policy Reform, 6(3), 159–180. https://doi.org/10.1080/0951274032000175770
- Bahmani-Oskooee, M., & Hegerty, S. W. (2007). Exchange rate volatility and trade flows: A review article. Journal of Economic Studies, 34(3), 211–255. https://doi.org/10.1108/01443580710772777
- Baron, D. P. (1976). Fluctuating exchange rates and the pricing of exports. Economic Inquiry, 14(3), 425–438. https://doi.org/10.1111/j.1465-7295.1976.tb00430.x
- Barrett, C. B., & Li, J. R. (2002). Distinguishing between equilibrium and integration in spatial price analysis. American Journal of Agricultural Economics, 84(2), 292–307. https://doi.org/10.1111/1467-8276.00298
- Bayer, C., & Hanck, C. (2013). Combining non-cointegration tests. Journal of Time Series Analysis, 34(1), 83–95. https://doi.org/10.1111/j.1467-9892.2012.00814.x
- Breitung, J., & Candelon, B. (2006). Testing for short- and long-run causality: A frequency-domain approach. Journal of Econometrics, 132(2), 363–378. https://doi.org/10.1016/j.jeconom.2005.02.004
- Ceballos, F., Hernandez, M. A., Minot, N., & Robles, M. (2017). Grain price and volatility transmission from international to domestic markets in developing countries. World Development, 94(June), 305–320. https://doi.org/10.1016/j.worlddev.2017.01.015
- Daviron, B., & Ponte, S. (2005). The coffee paradox: Global markets, commodity trade and the elusive promise of development (1st ed.). Palgrave Macmillan.
- Dong, X., Brown, C., Waldron, S., & Zhang, J. (2018). Asymmetric price transmission in the Chinese pork and pig market. British Food Journal, 120(1), 120–132. https://doi.org/10.1108/BFJ-02-2017-0056
- Ethier, W. (1973). The American Economic Review. International trade and the forward exchange market. 63(3), 494–503. https://www.jstor.org/stable/1914383
- Fackler, P. L., & Goodwin, B. K. (2001). Spatial price analysis. In B. L. Gardner & G. C. Rausser (Eds.), Handbook of agricultural economics (Vol. 1, pp. 971–1024). Elsevier.
- Fafchamps, M., & Hill, R. V. (2008). Price transmission and trader entry in domestic commodity markets. Economic Development and Cultural Change, 56(4), 729–766. https://doi.org/10.1086/588155
- Fousekis, P., Katrakilidis, C., & Trachanas, E. (2016). Vertical price transmission in the US beef sector : Evidence from the nonlinear ARDL model. Economic Modelling, 52(Part B), 499–506. https://doi.org/10.1016/j.econmod.2015.09.030
- Gabre-madhin, E. (2012). A M arket for Abdu: Creating a Commodity Exchange in Ethiopia. https://www.ifpri.org/publication/market-abdu-creating-commodity-exchange-ethiopia
- Ghoshray, A. (2008). Asymmetric adjustment of rice export prices : the case of Thailand and Vietnam. International Journal of Applied Economics, 5(September), 80–91. https://citeseerx.ist.psu.edu/viewdoc/download?doi=10.1.1.554.9340&rep=rep1&type=pdf
- Gizaw, D., Myrland, Ø., & Xie, J. (2021). Asymmetric price transmission in a changing food supply chain. Aquaculture Economics & Management, 25(1), 89–105. https://doi.org/10.1080/13657305.2020.1810172
- Gómez, M. I., & Koerner, J. (2009). Do retail coffee prices increase faster than they fall? Asymmetric price transmission in France, Germany and the United States.Working Papers 55930, Cornell University, Department of Applied Economics and Management.
- Handino, T. D., D’Haese, M., Demise, F., & Tamirat, M. (2019). De-commoditizing Ethiopian coffees after the establishment of the Ethiopian commodity exchange : An empirical investigation of smallholder coffee producers in Ethiopia. International Food and Agribusiness Management Review, 22(4), 499–518. https://doi.org/10.22004/ag.econ.290383
- Hansen, B. E. (1992). Tests for parameter instability in regressions with 1(1) processes. Journal of Business and Economic Statistics, 10(3), 321–335. https://doi.org/10.1080/07350015.1992.10509908
- Hernandez, M. A., Lemma, S., & Rashid, S. (2015). The Ethiopian Commodity Exchange and the coffee market : Are local prices more integrated to global markets ? 2015 Conference, August 9-14, 2015, Milan, Italy 211732, Agriculture in an Interconnected World. https://doi.org/10.22004/ag.econ.211732
- Hernandez, M. A., Rashid, S., Lemma, S., & Kuma, T. (2017). Market Institutions and price relationships: The case of coffee in the Ethiopian commodity exchange. American Journal of Agricultural Economics, 99(3), 683–704. https://doi.org/10.1093/ajae/aaw101
- Hooper, P., & Kohlhagen, S. W. (1978). The effect of exchange rate uncertainty on the prices and volume of international trade. Journal of International Economics, 8(4), 483–511. https://doi.org/10.1016/0022-1996(87)90001-8
- Huffaker, R., Griffith, G., Dambui, C., & Canavari, M. (2021). Empirical detection and quantification of price transmission in endogenously unstable markets : The case of the global – domestic coffee supply chain in Papua New Guinea. Sustainability, 13(9172), 1–18. https://doi.org/10.3390/su13169172
- Ibrahim, M. H. (2015). Oil and food prices in Malaysia : A nonlinear ARDL analysis. Agricultural and Food Economics, 3(1), 2–14. https://doi.org/10.1186/s40100-014-0020-3
- ICO. (2020). Volatile coffee prices : COVID-19 and market fundamentals. Coffee Break Series 2. International Coffee Organization.
- International Coffee Organization [ICO]. (2020). The Value of Coffee: Sustainability, Inclusiveness, and Resilience of the Coffee Global Value Chain. https://www.internationalcoffeecouncil.com/_files/ugd/38d76b_4fc7b54a15f14a548b2f4a208c2eae6d.pdf
- Jordan, S., & Philips, A. Q. (2018). Cointegration testing and dynamic simulations of autoregressive distributed lag models. Stata Journal, 18(4), 902–923. https://doi.org/10.1177/1536867x1801800409
- Kalkuhl, M. (2016). How strong do global commodity prices influence domestic food prices in developing Countries? A global PRICE transmission and vulnerability mapping analysis. In M. Kalkuhl & J. von Braun (Eds.), Food price volatility and its Implications for food security and policy (pp. 269–301). Springer Nature.
- Kamaruddin, M. R., Syahnur, S., & Majid, S. A. (2021). Asymmetric price transmission of Indonesian coffee asymmetric price transmission of Indonesian coffee. Cogent Economics & Finance, 9(1), 1–15. https://doi.org/10.1080/23322039.2021.1971354
- Kapetanios, G., & Shin, Y. (2008). GLS detrending-based unit root tests in nonlinear STAR and SETAR models. Economics Letters, 100(3), 377–380. https://doi.org/10.1016/j.econlet.2008.02.033
- Kebede, H. A. (2021). The pass-through of international commodity price shocks to producers ’ welfare : Evidence from Ethiopian coffee farmers. The World Bank Economic Review, 36 (2), 1–24. Article The https://doi.org/10.1093/wber/lhab020
- Krivonos, E. (2004). The impact of coffee market reforms onm producer prices and price transmission (No. 3358; Policy Research Working Paper). http://hdl.handle.net/10986/14183
- Kumar, S. (2017). On the nonlinear relation between crude oil and gold. Resources Policy, 51(January), 219–224. https://doi.org/10.1016/j.resourpol.2017.01.003
- Laili, F., Widyawati, W., & Setyowati, P. B. (2020). Asymmetric price transmission in the Indonesian food market asymmetric price transmission in the Indonesian food market. IOP Conf. Series: Earth and Environmental Science, 518. https://doi.org/10.1088/1755-1315/518/1/012078
- Lence, S. H., Moschini, G., & Santeramo, F. G. (2017). Threshold cointegration and spatial price transmission when expectations. Agricultural Economics, 49(1), 25–39. https://doi.org/10.1111/agec.12393
- Liu, C. C., & He, L. Y. (2010). KSS unit root test of nonlinearity and nonstationarity in China’s agricultural futures markets. Physics Procedia, 3(5), 1753–1756. https://doi.org/10.1016/j.phpro.2010.07.015
- Mai, T. C., Shakur, S., & Cassells, S. (2014). Price asymmetry of coffee beans : Evidence from Vietnam. 2016 Conference, August 25-26, Nelson, New Zealand 260807, New Zealand Agricultural and Resource Economics Society. https://ideas.repec.org/p/ags/nzar16/260807.htmlhttps://ideas.repec.org/p/ags/nzar16/260807.html
- Mai, T. C., Shakur, S., & Cassells, S. (2019). Testing vertical price transmission for Vietnam ’ s robusta coffee. Australian Journal of Agricultural and Resource Economics, 62(4), 563–575. https://doi.org/10.1111/1467-8489.12260
- Mclaren, A. (2015). Asymmetry in price transmission in agricultural markets. Review of Development Economics, 19(2), 415–433. https://doi.org/10.1111/rode.12151
- Meyer, J., & von Cramon-Taubadel, S. (2004). Asymmetric price transmission: A review. Journal of Agricultural Economics, 55(3), 581–611. https://doi.org/10.1111/j.1477-9552.2004.tb00116.x
- Miller, D. J., & Hayenga, M. L. (2001). Price cycles and asymmetric price transmission in the U . S . Prok Market. American Journal of Agricultural Economics, 83(3), 551–562. https://doi.org/10.1111/0002-9092.00177
- Minot, N. (2010). Transmission of world food price changes to African markets and its effect on household welfare. In Food price variability: Causes, consequences, and policy options (Issue January). International Food Policy Research Institute (IFPRI).
- Mofya-mukuka, R., & Abdulai, A. (2013). Policy reforms and asymmetric price transmission in the Zambian and Tanzanian coffee markets. Economic Modelling, 35(September), 786–795. https://doi.org/10.1016/j.econmod.2013.08.040
- Negassa, A., & Myers, R. J. (2007). Estimating policy effects on spatial market efficiency: An extension to the parity bounds model. American Journal of Agricultural Economics, 89(2), 338–352. https://doi.org/10.1111/j.1467-8276.2007.00979.x
- Nikiema, A. R., & Sakurai, T. (2020). Asymmetry in transaction costs and price transmission : The case of cowpea market in Burkina Faso. Jpn. J. Agric. Econ, 22, 89–94. https://doi.org/10.18480/jjae.22.0_89
- Obeng, C. K. (2018). Is the effect of exchange rate volatility on export diversification symmetric or asymmetric ? Evidence from Ghana. Cogent Economics & Finance, 6(1), 1–11. https://doi.org/10.1080/23322039.2018.1460027
- Osborne, T. (2005). Imperfect competition in agricultural markets : Evidence from Ethiopia. Journal of Development Economics, 76(2), 405–428. https://doi.org/10.1016/j.jdeveco.2004.02.002
- Otero, J., & Smith, J. (2017). Response surface models for OLS and GLS detrending-based unit-root tests in nonlinear estar models. Stata Journal, 17(3), 704–722. https://doi.org/10.1177/1536867x1701700310
- Paul, R. K., & Karak, T. (2022). Asymmetric price transmission : A case of wheat in India. Agriculture, 12(3), 1–17. https://doi.org/10.3390/agriculture12030410
- Peltzman, S. (2000). Prices rise faster than they fall prices rise faster than they fall. Journal of Political Economy, 108(3), 466–502. https://doi.org/10.1086/262126
- Petit, N. (2007). Ethiopia’s coffee sector: A bitter or better future? Journal of Agrarian Change, 7(2), 225–263. https://doi.org/10.1111/j.1471-0366.2007.00145.x
- Rahmanta, Z. D., & Ayu, S. F. (2020). Price transmission of arabica coffee between North Sumatra with state main export purpose price transmission of Arabica coffee between North Sumatra with state main export purpose (America-Europe). Earth and Environmental Science, 474(7), 1–6. https://doi.org/10.1088/1755-1315/454/1/012026
- Rezitis, A. N., & Tsionas, M. (2019). Modeling asymmetric price transmission in the European food market. Economic Modelling, 76(January), 216–230. https://doi.org/10.1016/j.econmod.2018.08.004
- Sarkodie, S. A., Adams, S., Owusu, P. A., Leirvik, T., & Ozturk, I. (2020). Mitigating degradation and emissions in China: The role of environmental sustainability, human capital and renewable energy. Science of the Total Environment, 719(June), 137530. https://doi.org/10.1016/j.scitotenv.2020.137530
- Sarkodie, S. A., & Owusu, P. A. (2020). How to apply the novel dynamic ARDL simulations (dynardl) and Kernel-based regularized least squares (krls). MethodsX, 7(November), 101160. https://doi.org/10.1016/j.mex.2020.101160
- Schweikert, K. (2019). Asymmetric price transmission in the US and German fuel markets : A quantile autoregression approach. Empirical Economics, 56(3), 1071–1095. https://doi.org/10.1007/s00181-017-1376-5
- Sercu, P., & Vanhulle, C. (1992). Exchange rate volatility, international trade, and the value of exporting firms. Journal of Banking and Finance, 16, 155–182. https://doi.org/10.1016/0378-4266(92)90083-c
- Seyoum, M. E. (2010). Price transmission system in Ethiopian coffee market. Swedish University of Agricultural Sciences.
- Sheikh, U. A., Asad, M., Ahmed, Z., & Mukhtar, U. (2020). Asymmetrical relationship between oil prices, gold prices, exchange rate, and stock prices during global financial crisis 2008 : Evidence from Pakistan. Cogent Economics & Finance, 8(1), 1757802. https://doi.org/10.1080/23322039.2020.1757802
- Shin, Y., Yu, B., & Greenwood-Nimmo, M. (2014). Modelling Asymmetric Cointegration and Dynamic Multipliers in a Nonlinear ARDL Framework. In R. C. Sickles & W. C. Horrace (Eds.), Festschrift in Honor of Peter Schmidt: Econometric Methods and Applications (pp. 281–314). New York, NY: Springer. https://doi.org/10.1007/978-1-4899-8008-3
- Simbolon, L., & P. (2018). The Influence of Macroeconomic Factors on Stock Price : The Case of Real Estate and Property Companies. In J. W. Kensinger (Ed.), Global Tensions in Financial Markets (pp. 19–39). Emerald Publishing Limited. https://doi.org/10.1108/S0196-382120170000034010
- Simioni, M., Gonzales, F., Guillotreau, P., & Grel, L. L. (2012). Detecting asymmetric price transmission with consistent threshold along the fish supply chain. Canadian Journal OfAgricultural Economics, 61(1), 1–24. https://doi.org/10.1111/j.1744-7976.2012.01257.x
- Solarin, S. A., Nathaniel, S. P., Bekun, F., Okunola, A. M., & Alhassan, A. (2021). Towards achieving environmental sustainability: Environmental quality versus economic growth in a developing economy on ecological footprint via dynamic simulations of ARDL. Environmental Science and Pollution Research, 28(14), 17942–17959. https://doi.org/10.1007/s11356-020-11637-8
- Subervie, J. (2011). Producer price adjustment to commodity price shocks : An application of threshold cointegration. Economic Modelling, 28(5), 2239–2246. https://doi.org/10.1016/j.econmod.2011.06.010
- Tappata, M. (2009). Rockets and feathers : Understanding asymmetric. The RAND Journal of Economics, 40(4), 673–687. https://doi.org/10.1111/j.1756-2171.2009.00084.x
- Tastan, H. (2015). Testing for spectral Granger causality. Stata Journal, 15(4), 1157–1166. https://doi.org/10.1177/1536867x1501500411
- Toda, H. Y., & Yamamoto, T. (1995). Statistical inference in vector autoregressions with possibly integrated processes. Journal of Econometrics, 66(1–2), 225–250. https://doi.org/10.1016/0304-4076(94)01616-8
- Tuyen, D. T., Caihong, Z., Hong, N. T., Akhtar, R., & Elamin, K. M. E. (2020). Assessing the effect of factors on agricultural commodity export price volatility: Evidence from Vietnamese coffee. Fresenius Environmental Bulletin, 29(12), 11151–11164.
- USDA Foreign Agricultural Service, USDA. (2021). Ethiopia: Coffee Annual. ET2021-0013. UDSA. https://www.fas.usda.gov/data/ethiopia-coffee-annual-6
- Uzar, U., & Eyuboglu, K. (2019). The nexus between income inequality and CO2 emissions in Turkey. Journal of Cleaner Production, 227(August), 149–157. https://doi.org/10.1016/j.jclepro.2019.04.169
- Varela, G. J. (2012). Incomplete, slow, and asymmetric price transmission in ten product markets of Bolivia. World Bank Policy Research Working Paper 6291. World Bank Group. https://papers.ssrn.com/sol3/papers.cfm?abstract_id=2188804
- Varela, G. J., & Taniguchi, K. (2014). Asymmetric price transmission in indonesia’s wheat flour market. http://hdl.handle.net/11540/1975.
- von Cramon-Taubadel, S., & Meyer, J. (2000). Asymmetric price transmission: Fact or Artefact? The Food Consumer in the Early 21st Century, 19–20. https://www.google.com/search?client=firefox-b-d&q=Asymmetric+AQ55+price+transmission%3A+Fact+or+Artefact%3F+
- Worako, T. K., van Schalkwyk, H. D., Alemu, Z. G., & Ayele, G. (2008). Producer price and price transmission in a deregulated Ethiopian coffee market. Agrekon, 47(4), 492–508. https://doi.org/10.1080/03031853.2008.9523812