?Mathematical formulae have been encoded as MathML and are displayed in this HTML version using MathJax in order to improve their display. Uncheck the box to turn MathJax off. This feature requires Javascript. Click on a formula to zoom.
Abstract
The specific properties of assets such as cryptocurrencies, gold, and stocks have welcomed more empirical studies in assessing their nexus. As a result, market conditions, whether good or bad, become imperative to assess the benefits of safe have, hedges or diversification. Also, the presence of uncertainties in markets may have asymmetrical effects which make it necessary to assess their impact over time. The emergence of COVID-19 pandemic as a global uncertainty has altered the dynamics of most financial markets. Consequently, this may influence the lead/lag relationships in most financial time series at various frequencies to contribute to the heterogeneous nature of market participants. Hence, the study examines the interdependencies between cryptocurrencies, selected stocks markets of Africa, and Gold returns in a time-frequency domain before and during the COVID-19 pandemic. Using a day-to-day observations, from August 8th, 2015 to May 5th, 2020, we assess the benefits of portfolio diversification, hedges, and safe haven with the bi-wavelet technique. The findings reveal that gold and cryptocurrencies provide a safe haven, diversification and, hedge for investors of African stock especially in the Ghanaian stock market (short-term) and also during this COVID-19 period. These findings contribute to the literature on financial market interdependencies, asymmetries to demonstrate financial market participants’ diverse investment horizons. Again, policymakers and governments of these stock markets should institute a sound system of controls in regulating stock markets. This will enable the benefits of safe haven, hedges or diversification to be efficiently realized for Gold and Cryptocurrencies during different market conditions.
1. Introduction
The outbreak of COVID-19 has brought a lot of changes in the world. The novel coronavirus emerged from Wuhan, a city in China, spread globally and, announced by the World Health Organisation (WHO) as a pandemic on 11 March 2020. In January 2020, the COVID-19 outbreak triggered a drop in global financial markets’ performance, but the drop was short-lived, and losses were quickly recovered (Şenol & ZEREN, Citation2020). Notwithstanding, financial markets across the globe have been negatively affected by the COVID-19 pandemic (Asafo-Adjei, Owusu Junior et al., Citation2021; Asafo-Adjei, Adam et al., Citation2021; Owusu Junior et al., Citation2021aa, Citation2021b).
The market for cryptocurrency has developed rapidly as a component of the international financial market (Asafo-Adjei, Owusu Junior et al., Citation2021; Gajardo et al., Citation2018) and a new class of assets (Asafo-Adjei, Owusu Junior et al., Citation2021; Corbet et al., Citation2018). As of 4 May 2021, the cryptocurrency industry had about 9576 coins and a market capitalisation of US$2,216 billion, with Bitcoin swallowing approximately 45.9%, followed by Ethereum (17.3%), Binance coin (4.3%), Dogecoin (3.1%), and Ripple (2.9%) (Coinmarket, Citation2021Accordingly, the examination of cryptocurrencies cannot be ignored with their evolving dynamics. Thus, policymakers and academic researchers have devoted a lot of time and effort to figure out its dynamics and features across time and frequencies (Asafo-Adjei, Owusu Junior et al., Citation2021; Tiwari et al., Citation2019).
The appearance of cryptocurrencies has expanded the investment and diversification opportunities available to international investors (Asafo-Adjei, Owusu Junior et al., Citation2021). Cryptocurrencies have been utilised as a hedge, safe haven or diversifier against assets such as bonds, gold, and, other financial assets (Baur & Lucey, Citation2010; Klein et al., Citation2018). The link between cryptocurrencies and other financial markets such as stocks is well defined by empirical studies (Asafo-Adjei, Owusu Junior et al., Citation2021; Yarovaya et al., Citation2016). Yarovaya et al. (Citation2016) postulated that the speculative bubbles in the cryptocurrency market could spread contagion and undermine financial stability. This reiterates the claim made by Anyikwa and Le Roux (Citation2020) that stock markets, specifically, African stocks, are driven by the contagion effect which distorts the fundamental relationships across markets.
On the other hand, gold, historically, has operated as a store of value. Gold has also been employed as a hedge or haven against assets like bonds, stocks, and other financial assets for years now and is preferred as an alternative investment by risk-averse investors (Baur & McDermott, Citation2010; Beckmann & Czudaj, Citation2013; Dyhrberg, Citation2016a; Van Hoang et al., Citation2016; Klein et al., Citation2018; Shahzad et al., Citation2020; Owusu Junior et al., Citation2022). Without a doubt, significant attention has shifted from gold to cryptocurrencies (Baur et al., Citation2016; Van Hoang et al., Citation2016; Bouri, Jalkh et al., Citation2017; Das & Kannadhasan, Citation2018; Shahzad et al., Citation2020; Owusu Junior et al., Citation2020; etc.). Exposure to individual asset risks can be reduced in line with the modern portfolio theory (Markowitz, Citation1952) by holding assets of a diversified portfolio.
Despite the substantial expansion of Cryptocurrencies, there are limited studies that devote interest to find the lead-lag relationships with African stocks. A research by Anyikwa and Le Roux (Citation2020) showed that African financial markets are not connected to the global, irrespective of the decline in the value of most international markets in times of global financial crisis and Eurozone sovereign debt crisis. Anyikwa and Le Roux (Citation2020) mentioned that the contagion effect, rather than holdings of asset and investor behaviour, drove the reaction of African stock markets during these crises (Hemche et al., Citation2016). This distinguishing feature of stock markets in Africa proffers the connection among cryptocurrencies, gold and, stocks in Africa as an interesting circumstance to scrutinize considering the long-held assumption that African stock markets can offer diversification opportunities (Anyikwa & Le Roux, Citation2020; Asafo-Adjei et al., Citation2020).
Cryptocurrencies, gold and, stocks have been flaunted to be assets through which investors can channel their investments (Hoang et al., 2016; Owusu Junior et al., Citation2020; Pieters & Vivanco, Citation2017; Tiwari et al., Citation2019). Aside the fact that the cryptocurrency economy is radically different from the stock market (Durcheva & Tsankov, Citation2019), both of the markets operate in a similar manner. For instance, their prices are determined by demand and are valued in fiat currencies. Investors of stocks (traditional assets) may hedge against volatility in the stock market using cryptocurrencies, due to the fear of volatility in demand for stocks and loss of currency value, which may reduce asset prices (Asafo-Adjei, Owusu Junior et al., Citation2021).
The very few empirical literature that considers the nexus between cryptocurrencies and other assets do not consider African stocks (see, for example, Enilov et al., Citation2021; Handika et al., Citation2019; Owusu Junior et al., Citation2020; Su & Li, Citation2020; Tiwari et al., Citation2019), except for the study by Kumah et al., Citation2021). They tested the haven properties of cryptocurrencies for stocks in Africa and the commodity market implementing the frequency domain spillover index which shows only the frequency. Furthermore, these studies did not consider the impact of COVID-19 pandemic on the nexus between the aforesaid variables.
The current study fills this gap by incorporating major African stocks into the discussion of cryptocurrencies’ nexus with other assets in a time-frequency domain. Again, the study considers the COVID-19 pandemic period to address the extent of stress in financial markets. This approach clearly supports the stock market investment horizons to reflect the heterogeneous market hypothesis (HMH; Müller et al., Citation1997). Again, the adaptive market hypothesis (AMH) by Lo (Citation2004) indicates that markets evolve (due to events and structural changes), and adapt—in that market efficiency varies in degree at different times. That is, the presence of the bi-wavelet technique in this study responds to the HMH and AMH which contribute to minimising noise from the outcome of the study which is lacking in most studies. The study, therefore, assesses the lead-lag time-frequency structures of cryptocurrencies and gold on stocks using wavelet analysis before and during the COVID-19 period. This will enable us to clearly assess the time and frequency at which only two variables (either cryptocurrencies and stocks or gold and stocks) lead or lag. The lead or lag relationships between the variables would help to examine the degree of interdependencies between the variables to assess the safe haven, hedge or diversification properties.
In addition, the lead or lag relationships would enable policymakers to regulate the creation of new markets. Also, the study would offer portfolio managers some amount of information in the determination of possible combinations of assets towards risk-minimization through effective diversification. Moreover, the study will provide a guide and direction to potential investors of cryptocurrencies and gold, not forgetting stock market investors, in making an informed choice of specific kinds of investable assets within these markets.
We found that all the stock returns, especially in the short term, comove with BTC, XRP, Gold, DOGE (except Nigeria) returns and with ETH in the medium to long term except for Tunisia which additionally had traces of co-movement in the short term throughout the years. Specifically for 2020, the stock market of Ghana in the short to long run has a weak correlation. This shows that the co-movements between cryptocurrencies and stock returns of Ghana as well as gold and Ghana stock returns, there are traces of diversification, safe haven or, hedge benefits at certain times and frequency domains.
The paper is organized into five sections. The literature review is the next section of this paper followed by the model specification which is presented in the third section. Section 4 is devoted to results and discussions and lastly, the conclusion of the study is presented in the fifth section.
2. Literature review
Many works have explored the potential of cryptocurrencies, mostly Bitcoin, and of gold to act as safe havens or hedge in global stock markets (Baur & McDermott, Citation2010; Baur & Lucey, Citation2010; Van Hoang et al., Citation2016; Baur et al., Citation2016; Dyhrberg, Citation2016a; Dyherberg, Citation2016b; Bouri, Gupta et al., Citation2017; Bouri, Jalkh et al., Citation2017, Citation2017; Feng et al., Citation2018Citation2018; Shahzad et al., Citation2019; JERIBI et al., Citation2020), but few studies concentrate on African stocks (Kumah et al., Citation2021). Some studies also consider the nexus between these financial time series during the COVID-19 pandemic period (Conlon & McGee, Citation2020; Demir et al., Citation2020; Ghorbel & Jeribi, Citation2021).
Similarly, Abakah et al. (Citation2020) analysed the volatility persistence in 12 major cryptocurrencies (Bitcoin, Nem, Tether, Bitshare, Siacoin, Ether, Litecoin, Dash, Monero, Ripple, Bytecoin, and, Stellar) taking into account structural breaks. Their results showed a reduction in the cryptocurrency sector that was persistent. As a result, market participants must account for the persistence properties of cryptocurrencies in their valuation and forecasting models in order to boost long-term volatility market forecasts and make the best decisions. Conlon and McGee (Citation2020) explored, during the COVID-19 period, the haven properties of Bitcoin for the S&P 500 and reported bitcoin is not a safe haven asset. Since S&P 500 and Bitcoin move in lockstep, an investor’s downside risk increased during the period (March 2019- March 2020).
The work of Demir et al. (Citation2020) applying the wavelet coherence model scrutinized the link between cryptocurrencies (Ripple, Bitcoin, and Ethereum) and COVID-19 cases plus the number of deaths and finds that cryptocurrencies are hedges against the COVID-19. Also, researchers have studied cryptocurrency by applying different models and techniques. These are the generalised autoregressive conditional heteroskedastic models (Bohte & Rossini, Citation2019; Cebrián-Hernández & Jiménez-Rodríguez, Citation2021; Cheikh et al., Citation2020), wavelet analysis (Kumar & Kamaiah, Citation2017; Omane-Adjepong et al., Citation2019; Qiao et al., Citation2020), multiple least squares (Nguyen et al., Citation2020; Sami & Abdallah, Citation2020), conditional autoregressive Value at Risk (Borri, Citation2019; Enilov et al., Citation2021).
None of the aforementioned empirical studies examined the relationship between cryptocurrencies, gold and stocks during the COVID-19 pandemic period via the wavelet approach. However, analysis through the wavelet approach inclusive of the COVID-19 pandemic period may contribute to financial markets diverse participants’ investment horizons. This is done to accurately describe stock market participants’ diverse investment time-frequencies which is in line with the hypothesis for heterogeneous market (Müller et al., Citation1997). Again, the adaptive market hypothesis (AMH) engineered by Lo (Citation2004) suggests that markets evolve due to events and structural changes, and market efficiency varies in degree at diverse times. The study therefore employs the bi-wavelet technique, which is lacking in most prior literature on cryptocurrencies and or gold nexus with stock markets in Africa, inclusive of the COVID-19 pandemic period.
3. Methodology
3.1. Wavelet analysis
The study looks at the haven, hedging and, diversification properties of cryptocurrencies and gold for African Stock Market utilizing continuous wavelets and cross-wavelet transforms. Continuous wavelet transforms (CWTs) and discrete wavelet transforms (DWTs) are the two types of wavelet transforms. Only the continuous wavelet transform will be addressed in the section below. This has a better feature extraction purpose than the discrete wavelet transforms, which also has data compression and reduces noise (Li et al., Citation2020; Pal & Mitra, Citation2019; Wu et al., Citation2020).
3.1.1. Continuous wavelet transfer (CWT)
A wavelet transform function decomposes time series into elementary functions that are derived from a mother wavelet in general. Two parameters make up the mother wavelet: time (ί) and scale (s), which can be described as
where is the element of normalization, which ensures that the variance unit of the wavelet
|| is the time parameter, that specifies the wavelet’s exact location; and s is the scale dilation parameter, defining the wavelet stretch. Thus, the Morlet wavelet is as follows
where is the wavelet’s central frequency. following Rua and Nunes (Citation2009), and Vacha and Barunik (Citation2012)
is positioned at six.
A time series x (t) with respect to a chosen mother wavelet can be decomposed (Li et al., Citation2020) as
By projecting the specific wavelet (
) onto the selected time series, we are able to quickly obtain
. Correspondingly, CWT’s main advantage is its capacity to break down and reassemble a function
3.1.2. Wavelet coherence
The WPS has some limitations in low-frequency oscillations (Li et al., Citation2020). To reduce the bias of WPS, we use the cross-wavelet transform tools developed by Ng and Chan (Citation2012) to analyse the interconnectedness of cryptocurrencies and gold on returns of African stocks. The cross-wavelet transform explaining covariance in the time-frequency domain is defined as
where and
indicate the cross wavelet of series x(t) and y(t), in the order given (Li et al., Citation2020; Torrence & Compo, Citation1998). * denotes a complex conjugate. The cross-wavelet transform shows the area in time space with high common power.
The absolute value squared of normalizing a wavelet cross spectrum to a single wavelet power spectrum is known as Wavelet Transform Coherence (Grinsted et al., Citation2004). As a result, the wavelet coefficient squared is indicated as
where indicates a smoothing factor, which balances resolution and significance, and
. A weak relationship is identified by a value close to 0, while a value close to 1 describes a strong relationship. Wavelet analysis depicts a complete co-movement between the series in the time-frequency domain. Furthermore, the normalizing feature of the wavelet coherence eliminates issues that are biased in the wavelet power and cross spectrum and, MWC and PWC are no exception. Coherence can be used effectively to examine co-movement in African financial markets.
3.1.3. Phase difference
We assume that describes the phase difference in African stock markets. Therefore, following Bloomfield et al. (Citation2004), Li et al. (Citation2020), and Wu et al. (Citation2020), the phase difference between x(t) and y (t) is represented as follows
where represents the imaginary operator and
the real operator. The dimensional phase pattern in the map of wavelet coherence determines the effects of the wavelet coherence gap. Different phase patterns are distinguished using dimensional arrows. For instance, if x(t) and y(t) are in-phase, the arrow points to the rightward (leftward). Similarly, an arrow is pointing downward (or upward), this implies that y(t) or x(t) is leading.
3.2. Empirical data
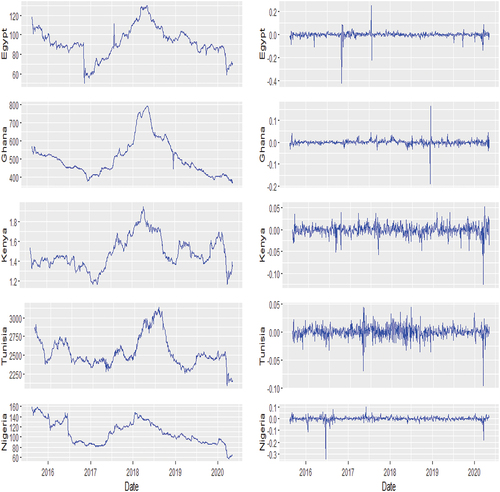
The study employed daily prices which are made up of African stock markets and cryptocurrencies with high market capitalization and volume in addition to gold prices. African stock markets selected for this study comprise; Nigeria (NGX), Egypt (EGX), Ghana (GSE), Kenya (NSE) and, Tunisia (BVMT). On the other hand, the cryptocurrencies consist of Bitcoin (BTC), Dogecoin (DOGE), Ripple (XRP) and Ethereum (ETH). The daily data span from August 8th, 2015 to May 5th, 2020 yielding a total of 818 observations. The suggested period was preferred to welcome different market conditions—2015-2017 denotes normal or good market conditions, whilst 2018 depicts poor market conditions for Cryptocurrencies, and 2019–2020 denotes stress or poor market conditions for all markets. The period of 2018 is considered to be poor market conditions for Cryptocurrencies because in September 2018, Cryptocurrency markets faced extreme price instability which resulted in 80% loss of their values (Brauneis & Mestel, Citation2018). This would support the definitions of safe haven, hedges and diversification of Baur and Lucey (Citation2010). Data obtained daily was selected over monthly series to observe the rapid wavering in financial data (Asafo-Adjei et al., Citation2020; Bannigidadmath & Narayan, Citation2016). The data on stocks, gold and, cryptocurrencies were obtained from EquityRT. As shown below, the study was based on daily returns as , where
is the return that is compounded continuously,
is the current index and
the previous index.
4. Results and discussion
4.1. Descriptive statistics
presents the graphical plots of price and returns series for Cryptocurrencies, Gold and some selected African stocks. It can be analysed that the fluctuations in Cryptocurrencies over the sampled period exceed that of Gold and stocks depicting instability or the high speculative nature of Cryptocurrencies. However, the returns illustrate stationarity which confirms the stylized fact of asset returns.
Figure 1. Plots of price and returns series for cryptocurrencies, gold and African stocks.
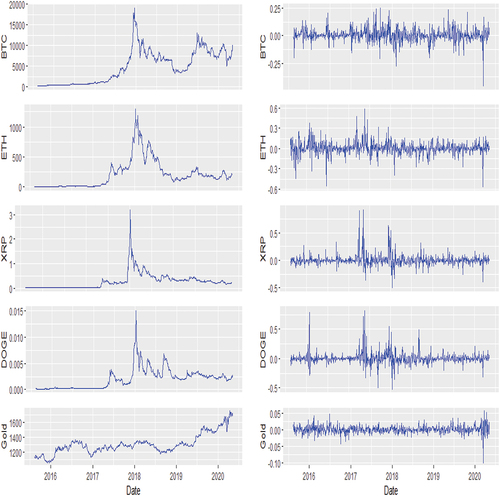
Figure 1. (Continued)
The descriptive statistics for Bitcoin, Ethereum, Ripple, Dogecoin, Egypt, Ghana, Nigeria, Tunisia, Kenya and, Gold are shown in . These financial assets are all valued in USD. The cryptocurrencies and Gold have positive average daily returns while the African stocks have negative average daily returns. Ethereum has a much higher average daily return than the others. The standard deviation of XRP is the highest and the lowest for the Tunisia stock market. This suggests that XRP is more volatile than the other cryptocurrencies, stock markets and, gold. The standard deviation for all indices is higher than their mean indicating a higher level of risk in these markets. All stocks, gold and, BTC exhibit skewness to the left while the others are right-skewed showing an asymmetric distribution. The kurtosis of the data analysed is way above 3, showing high peaks and fat tails (leptokurtic) and this suggests non-normality of the distribution. The test of normality using Shapiro-Wilk rejects the null hypothesis for all indices confirming that indeed the distribution is not normal at the 1% significance level (as illustrated by the W*). Table shows the test of stationarity for both ADF and KPSS at levels and first difference. It is noticeable from Table that the series are stationary only at first difference. Knowing the stationarity of the series, the wavelet approaches employed in this study however are effective in dealing with both stationary and nonstationary series.
Table 1. Summary statistics
Table 2. Unit root test
4.2. Main results
4.2.1. Time-Frequency
The statistical interpretations and scripts for analysis were obtained from Gouhier et al. (Citation2013). Right-pointing arrows and left-pointing arrows indicate when the financial time series are respectively in-phase (movement in identical direction) and antiphase (movements in the reverse direction). Specifically, left pointing arrows indicate negative correlations whereas right pointing arrows denote positive correlations. Right-pointing arrows upwards and left-pointing arrows downwards mean that the first variable leads, while the left-pointing arrows upwards and the right-pointing arrows downwards mean that the second variable leads (Asafo-Adjei, Adam et al., Citation2021). The leading variable indicates the first variable to respond to shocks, and vice versa for lagging variables. The intensity of the interdependence between the paired series is indicated by the surface colour and the colour pallet is represented. The red (warm) colour signifies parts that have major interactions, while the blue (cold) colour shows a lower series correlation (Asafo-Adjei, Adam et al., Citation2021; Boateng et al., Citation2022). The interpretations of the scales for the data frequency of 5 days per week, lj, j = 1 … 7, of the wavelet factors are linked to times of, respectively, “2–4 days (intra week scales), 4–8 days (weekly scale), 8–16 days (fortnightly scale), 16–32 days (monthly scale), 32–64 days (monthly to quarterly scale), 64–128 days (quarterly to biannual scale), and 128–256 days (biannual to annual scale)” for scales 1–64 respectively from , as indicated by Tweneboah et al. (Citation2019, p. 4), Tweneboah et al. (Citation2019, p. 5), and Asafo-Adjei et al. (Citation2020). The summary of results is however presented in Table .
Figure 2. Co-movements between bitcoin and African stocks.
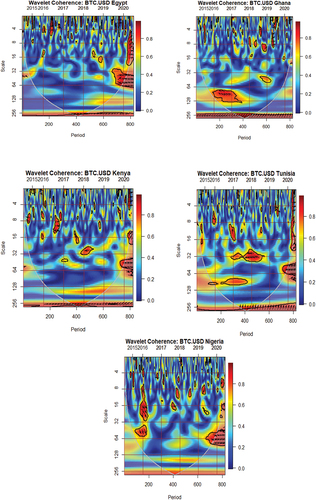
Figure 3. Co-movements between ethereum and African stocks.
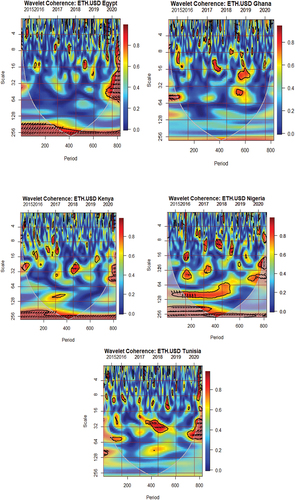
Figure 4. Co-movements between ripple and African stocks.
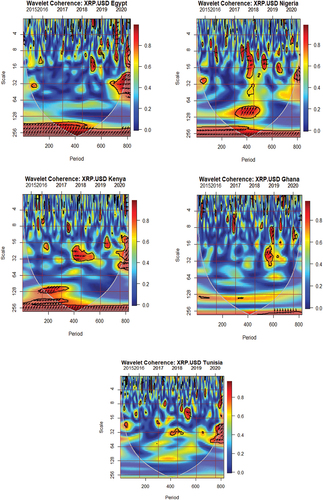
Figure 5. Co-movements between dogecoin and African stocks.
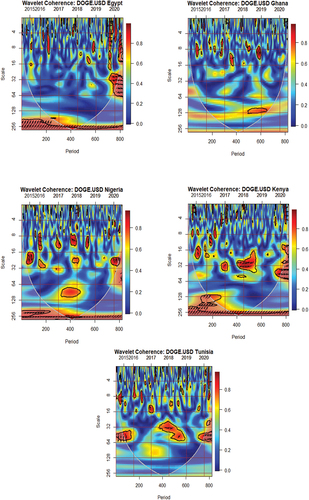
Table 3. Summary of results for diversification, hedge or safe haven benefits
shows the co-movement of Bitcoin returns (BTC) and stock returns of selected African countries. All of the stock returns comove with BTC returns especially in the short-run. However, in the medium-term, BTC comoves with stock returns except for Ghana, but in the long term, except Egypt and Nigeria. From a time perspective, that is from 2015–2019, BTC comoves with stock returns in the medium to long-term (approximately 16–256 days) with the exception of Nigeria.
In 2020 there were very high co-movements in the short-medium term between BTC and all the stock returns, and at scale 256 there are high co-movements except stock returns of Nigeria. Following from Baur and Lucey (Citation2010), a possible combination of assets can lead to the benefits of diversification, safe haven or hedge. The area from with blue colour shows that BTC and stocks are uncorrelated at a given time-frequency domain. Specifically, the uncorrelated area signifies the benefits of diversification, safe haven or hedge. Specifically for 2019 and 2020, the stock market of Ghana has a correlation in the short-, and long-terms that is weak. This shows that the co-movements between BTC and stock returns of Ghana offer greater safe haven benefits throughout the scales in 2019 and 2020. In addition, in the long-term at an approximate scale 64–256, the stock returns of Egypt, Kenya, Nigeria and, Tunisia provide benefits of diversification (2015–2017), safe haven (2018–2020) and, hedge (2015–2017) with BTC concerning the level of market conditions in line with the literature of Baur and Lucey (Citation2010).
The right-pointing arrows upwards in indicate that BTC leads stock market returns with the exception of Nigeria which recorded right-pointing arrows downwards. This signifies that the stock returns of Nigeria lead BTC at 2015–2016 and 2019–2020, but mostly at scales 8–100 days. The left arrows in 2018 for Kenya, Tunisia, and possibly Nigeria with BTC represent safe haven benefits.
The heterogeneous and adaptive behaviours of the comovements between BTC and African stocks generally minimize investors’ portfolio risks. Accordingly, investors may find BTC and African stocks as complementary assets rather than substitutes, except for the few right pointing arrows indicating positive correlations.
shows the co-movement of Ethereum returns (ETH) and stock returns of selected African countries. Most of the stock returns comove with ethereum returns but in the medium to long term, except for Tunisia which additionally had traces of co-movement in the short term throughout the years. From 2015–2020, ethereum returns comove with most stock returns in the medium to long-term (approximately 16–256 days) specifically; Nigeria, Kenya, Ghana and, Egypt.
Following from the COVID-19 pandemic period (2020), there were very high co-movements in the short-medium term with the exception of Ghana. Also, there seem to be no co-movements between ETH and return on stocks of Tunisia and Ghana in the long term. However, the co-movements between ETH and the remaining stocks (Egypt, Kenya and, Nigeria) only occurred at approximately scale 256. From Baur and Lucey (Citation2010), a possible combination of assets can lead to the benefits of diversification, safe haven or hedge. Since the COVID-19 pandemic has been touted to disrupt most economic activities by extant literature (Ashraf, Citation2020; Şenol & ZEREN, Citation2020), we consider 2020 as an extreme market condition. The area from Figure with blue colour shows that ETH and stocks are uncorrelated at a given time-frequency domain. Specifically, the uncorrelated area signifies the benefits of diversification, safe haven or hedge. Specifically for 2020, the stock market of Ghana has a correlation that is weak in the short term-long term. This shows that the co-movements between ETH and stock returns of Ghana offer safe haven benefits throughout the scales. In addition, in the long-term at an approximate scale of 64–256, the stock returns of Egypt, Kenya, Nigeria and, Tunisia provide benefits of diversification (2015–2017), safe haven (2018, 2019 and 2020) and, hedge (2015–2017) with ETH.
The right-pointing arrows upwards in indicate that ETH drives stock market returns with the exception of Ghana, which demonstrate indeterminable directional comovements. The left arrows in 2018 for Kenya, Nigeria and Tunisia with ETH demonstrate the benefits of safe haven.
shows the co-movement of Ripple (XRP) returns and stock returns of selected African countries. All the stock returns comove with XRP returns especially in the short-run. However, in the medium-term, XRP comoves with stock returns but in Ghana, co-movement occurs in 2019 at a scale of 8–32 days and Egypt at 2019–2020 at a scale of 8–64 days. In the long term at diverse time-frequencies, co-movements occur between stock returns and XRP except for Tunisia. However, most co-movements in the long-term occur at scale 256 days.
In 2020 there were very high co-movements in the short-medium term between XRP and all the stock returns, and at scale 256 there are high co-movements except stock returns of Ghana. Following from Baur and Lucey (Citation2010) and Boateng et al. (Citation2021), a possible combination of assets can lead to the benefits of diversification, safe haven or hedge. The area from with blue colour shows that XRP and stocks are uncorrelated at a given time-frequency domain. Specifically, the uncorrelated area signifies the benefits of diversification, safe haven or hedge depending on the market conditions. Specifically for 2020, the stock market of Ghana has a weak correlation in the short term-long term. This shows that the co-movements between XRP and stock returns of Ghana offer greater diversification, safe haven and, hedge benefits throughout the scales. In addition, in the long-term at approximately scale 64–250 days, the stock returns of all countries provide benefits of diversification, safe haven or hedge with XRP, but very little can be said at scale 256 days.
The right-pointing arrows upwards in indicate that XRP leads stock market returns. This suggests that stock markets during these period act as a follower to XRP. However, from 2018 at scale 8–32 days, there are traces of safe haven benefits with reference to the arrows pointing to the left between XRP and Kenya, Nigeria and, Tunisia.
shows the co-movement of DOGE returns and stock returns of selected African countries. Most of the stock returns comove with DOGE returns especially in the short-run except Nigeria and Kenya. However, in the medium-term, DOGE comoves with stock returns except for Ghana, but in the long run at scale 256, except Tunisia and Ghana. From 2015–2019, DOGE comoves with stock returns in the medium to long-run (approximately 16–256 days) with the exception of Ghana, and Tunisia in the long term..
There were very high co-movements in the short-medium term between DOGE and all the stock returns, and at scale 256 there is high co-movements except stock returns of Ghana in 2020. Following from Baur and Lucey (Citation2010), a possible combination of assets can lead to the benefits of diversification, safe haven or hedge. The area from with blue colour shows that DOGE and stocks are uncorrelated at a given time-frequency domain. Specifically, the uncorrelated area signifies the benefits of diversification, safe haven or hedge with respect to the market conditions. Specifically for 2020, the stock market of Ghana has a weak short-, medium-, and long-term correlation. This shows that the benefits of diversification, safe haven or hedge are realised in the co-movements between DOGE and stock returns of Ghana throughout the scales. In addition, in the long-term at an approximate scale of 64–256, the stock returns of Tunisia and Ghana provide benefits of diversification, safe haven and, hedge with DOGE. Also, at scales 0–32 days, the stock returns of all counties comove with DOGE.
The right-pointing arrows upwards in indicate that DOGE drives stock market returns. However, in 2018 at scale 32, there are traces of safe haven benefits regarding the arrows pointing to the left between DOGE and Kenya as well as Tunisia. The left pointing arrows in 2018 corresponds to the one obtained for BTC, ETH and XRP and most stocks.
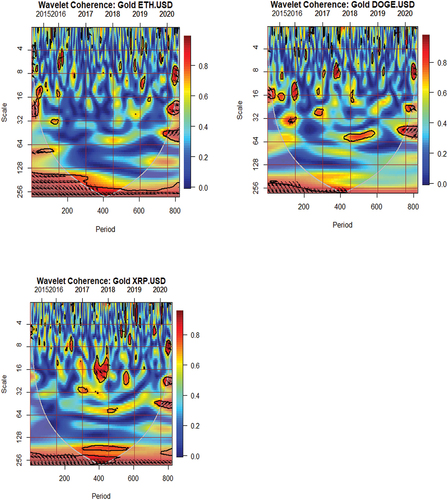
Figure A1 (presented at the appendix) shows the co-movement of Gold returns and stock returns of selected African countries as well as for cryptocurrencies. Gold returns comove with the stock returns of Ghana, Nigeria, Kenya, Tunisia, as well as short-run DOGE and XRP returns beyond 2016. However, in the medium-term, Gold returns comove with stock returns and cryptocurrencies. In the long term at diverse time-frequencies, co-movements occur between Gold and remaining variables except Ghana and Tunisia. However, most co-movements in the long-term occurs at scale 256 days.
In 2020 there were very high co-movements in the short-medium term between, and at scale 256 there are high co-movements except for stock returns of Ghana. The area from Figure A1 with blue colour shows that Gold and stocks, as well as cryptocurrencies, are uncorrelated at a given time-frequency domain. Specifically, the uncorrelated area signifies the benefits of diversification, safe haven or, hedge. Specifically for 2020, the stock market of Ghana has a weak correlation in the short to long term. This shows that the comovements between Gold returns and stock returns of Ghana offers greater diversification, safe haven and, hedge benefits throughout the scales. In addition, in the long-term at an approximate scale 64–250 days, the stock returns of all countries and Cryptocurrencies provide benefits of diversification (2015–2017), safe haven (2019 and 2020) or hedge (2015–2017) with Gold returns, except BTC.
The right-pointing arrows upwards in Figure A1 indicate that Gold drives stock market returns. However, from 2015 to 2020 at scale 128–256 days, there are traces of hedge benefits concerning the arrows pointing to the left between Gold and XRP; DOGE; ETH and BTC and the stock returns of Nigeria. Investors can observe the heterogeneous and adaptive behaviours of the comovements between gold and the remaining assets to minimize their investment or portfolio risks. Thus, investors may find gold, African stocks and cryptocurrencies as complementary assets rather than substitutes, except during the COVID-19 pandemic where most comovements were positive.
4.2.2. Comparative analysis
This section presents a linear regression model through the ordinary least squares for the relationship between cryptocurrencies, gold and stock markets of Africa to provide some comparison with the wavelet technique. Since it is practically impossible and for the sake of simplicity to present all possible combination, we show the relationship with stock markets as the dependent variables. This is necessary because cryptocurrencies and gold act as a possible transmitter to African stocks (Asafo-Adjei, Owusu Junior et al., Citation2021; Baur & Lucey, Citation2010; Baur et al., Citation2016). This rests on the fact that African stocks are mostly detached from the global (Asafo-Adjei et al., Citation2020; Boateng, Adam & Owusu Junior, 2021) with less tendency to transmit speculative bubbles to other financial assets to act as potential receiver of shocks. The outcome on the linear model is presented in .
Table 4. Linear relationships with the impact of cryptocurrencies and gold on stock markets
From , it can be seen that Bitcoin significantly transmit positive shocks to stock markets of Egypt and Tunisia. This renders diversification potentials impossible over the sampled period. As a result, investors of these assets during this period are unlikely to minimise their investing risks. Same can be said of the relationship between ethereum and stock market of Nigeria as well as between gold and stock market of Tunisia. The remaining relationships with the stock markets provides an indication of diversification potentials on the average. The outcome on the linear model is partly similar to the bi-wavelet even though the wavelet technique is analysed in a time-frequency perspective. The similarities in the results hinge on the potential diversifications between the variables. That is throughout the sampled period, investors who held their portfolios from these assets are most likely to minimise their investment risks. This is therefore relevant for risks management strategies for an averaged response of the relationships.
5. Conclusion
This paper uses bi-wavelet techniques to investigate the diversification, haven and, hedging properties of cryptocurrencies (Ripple, Dogecoin, Ripple and, Bitcoin) and gold for African stock markets (GSE, EGX, NSG, NSE and, BVMT). The pandemic has adversely affected financial markets worldwide and therefore every investor would want some form of security for their investments. All the stock returns, especially in the short term, comove with BTC, XRP, Gold, DOGE (except Nigeria) returns and with ETH in the medium to long term except for Tunisia which additionally had traces of co-movement in the short term throughout the years. Specifically for 2020, the stock market of Ghana in the short to long run has a weak correlation. This shows that the co-movements between cryptocurrencies and stock returns of Ghana as well as gold and Ghana stock returns, there are traces of diversification, safe haven or, hedge benefits at certain times and frequency domains. In addition, in the long-term at an approximate scale of 64–256 days, the stock returns of all countries provide benefits of diversification, safe haven or hedge with BTC, ETH, XRP (64–250 days), DOGE (only Tunisia and Ghana) and, Gold (except BTC). Investors should consider including cryptocurrencies and gold in their portfolios and especially during this COVID-19 period.
Despite the aforesaid, comovements between Cryptocurrencies and stocks illustrated safe haven benefits during 2018. This may be due to the price instability which resulted in 80% loss of Cryptocurrencies values in 2018 (Brauneis & Mestel, Citation2018). That is, the lead/lag relationships between stocks and Cryptocurrencies markets, are able to offer safe haven benefits in times of market stress on Cryptocurrencies. The findings from the bi-wavelet are similar to the linear regression model on the point of diversification wherein, the linear model is limited to averaged response of the relationships.
The findings of the study present the lead/lag relationships between financial assets in the midst of diverse market conditions to illustrate the benefits of safe haven, hedges or diversification in a time-frequency domain. This has important implications for investors with diverse investment horizons to magnify the heterogeneous market hypothesis (Müller et al., Citation1997) and the adaptive market hypothesis (Lo, Citation2004). For the sake of asset allocation and risk management, the support is incumbent on the negative comovements between the financial assets at various investment horizons. The differences in causality over diverse investment horizons during the COVID-19 provide evidence of contagion (Asafo-Adjei, Adam et al., Citation2021). As a result, we provide that cryptocurrencies are not detached from the financial system but as an effective asset for portfolio analysis with African stocks and gold, and clearly act as complementary assets rather than substitutes. They may also inform policymakers as well as governments to effectively regulate their financial markets to suit the cryptocurrencies instability market dynamics.
Further studies may concentrate on assessing the flow of information among cryptocurrencies, stocks and gold in times of uncertainties. Other stock variables such as global market index, developed market index, BRIC index, REITs, to mention but a few, may be incorporated in addition to the variables employed in this study to examine their lead/lag relationship.
Disclosure statement
No potential conflict of interest was reported by the author(s).
Additional information
Funding
References
- Abakah, E. J. A, Gil-Alana, L. A, Madigu, G, & Romero-Rojo, F. (2020). Volatility persistence in cryptocurrency markets under structural breaks. International Review of Economics & Finance, 69, 680–22. https://doi.org/10.1016/j.iref.2020.06.035
- Anyikwa, I, & Le Roux, P. (2020). Integration of African stock markets with the developed stock markets: An analysis of co-movements, volatility and contagion. International Economic Journal, 34(2), 279–296. https://doi.org/10.1080/10168737.2020.1755715
- Asafo-Adjei, E, Adam, A. M, & Darkwa, P. (2021). Can crude oil price returns drive stock returns of oil producing countries in Africa? Evidence from bivariate and multiple wavelet. Macroeconomics and Finance in Emerging Market Economies, 1–19. https://doi.org/10.1080/17520843.2021.1953864
- Asafo-Adjei, E, Agyapong, D, Agyei, S. K, Frimpong, S, Djimatey, R, & Adam, A. M. (2020). Economic policy uncertainty and stock returns of Africa: A wavelet coherence analysis. Discrete Dynamics in Nature and Society, 2020. https://doi.org/10.1155/2020/8846507
- Asafo-Adjei, E., Boateng, E., Isshaq, Z., Idun, A. A. A., Owusu Junior, P., & Adam, A. M. (2021). Financial sector and economic growth amid external uncertainty shocks: Insights into emerging economies. Plos one, 16(11), e0259303.
- Asafo-Adjei, E., Owusu Junior, P., & Adam, A. M. (2021). Information flow between global equities and cryptocurrencies: A VMD-based entropy evaluating shocks from COVID-19 pandemic. Complexity, 2021.
- Ashraf, B. N. (2020). Stock markets’ reaction to COVID-19: Cases or fatalities? Research in International Business and Finance, 54, 101249. https://doi.org/10.1016/j.ribaf.2020.101249
- Bannigidadmath, D., & Narayan, P. K. (2016). Stock return predictability and determinants of predictability and profits. Emerging Markets Review, 26, 153–173. https://doi.org/10.1016/j.ememar.2015.12.003
- Baur, D. G, & Lucey, B. M. (2010). Is gold a hedge or a safe haven? An analysis of stocks, bonds and gold. Financial Review, 45(2), 217–229. https://doi.org/10.1111/j.1540-6288.2010.00244.x
- Baur, D. G., & McDermott, T. K. (2010). Is gold a safe haven? International evidence. Journal of Banking & Finance, 34(8), 1886–1898. https://doi.org/10.1016/j.jbankfin.2009.12.008
- Baur, D. G., McDermott, T. K. . (2016). Why is gold a safe haven? Journal of Behavioral and Experimental Finance, 10, 63–71. https://doi.org/10.1016/j.jbef.2016.03.002.
- Beckmann, J, & Czudaj, R. (2013). Gold as an inflation hedge in a time-varying coefficient framework. The North American Journal of Economics and Finance, 24, 208–222. https://doi.org/10.1016/j.najef.2012.10.007
- Bloomfield, D. S., McAteer, R. J., Lites, B. W., Judge, P. G., Mathioudakis, M., & Keenan, F. P. (2004). Wavelet phase coherence analysis: Application to a quiet-sun magnetic element. The Astrophysical Journal, 617(1), 623. https://doi.org/10.1086/425300
- Boateng, E., Adam, A. M., & Junior, P. O. (2021). Modelling the heterogeneous relationship between the crude oil implied volatility index and African stocks in the coronavirus pandemic. Resources Policy, 74, 102389. https://doi.org/10.1016/j.resourpol.2021.102389
- Boateng, E., Asafo-Adjei, E., Addison, A., Quaicoe, S., Yusuf, M. A., Adam, A. M., & Adam, A. M. (2022). Interconnectedness among commodities, the real sector of Ghana and external shocks. Resources Policy, 75, 102511. https://doi.org/10.1016/j.resourpol.2021.102511
- Bohte, R., & Rossini, L. (2019). Comparing the forecasting of cryptocurrencies by Bayesian time-varying volatility models. Journal of Risk and Financial Management, 12(3), 150. https://doi.org/10.3390/jrfm12030150
- Borri, N. (2019). Conditional tail-risk in cryptocurrency markets. Journal of Empirical Finance, 50, 1–19. https://doi.org/10.1016/j.jempfin.2018.11.002
- Bouri, E., Gupta, R., Tiwari, A., & Roubaud, D. (2017). Does bitcoin hedge global uncertainty? evidence from wavelet-based quantile-in-quantile regressions. Finance Research Letters, 000( Article in Press), 1–9.
- Bouri, E., Jalkh, N., Molnãąr, P., & Roubaud, D. (2017). Bitcoin for energy commodities before and after the December 2013 crash: Diversifier, hedge or safe haven? Applied Economics, 49(50), 5063–5073.
- Brauneis, A., & Mestel, R. (2018). Price discovery of cryptocurrencies: Bitcoin and beyond. Economics Letters, 165, 58–61. https://doi.org/10.1016/j.econlet.2018.02.001
- Cebrián-Hernández, Á., & Jiménez-Rodríguez, E. (2021). Modeling of the bitcoin volatility through key financial environment variables: An application of conditional correlation mgarch models. Mathematics, 9(3), 267. https://doi.org/10.3390/math9030267
- Cheikh, N. B, Zaied, Y. B, & Chevallier, J. (2020). Asymmetric volatility in cryptocurrency markets: New evidence from smooth transition GARCH models. Finance Research Letters, 35, 101293. https://doi.org/10.1016/j.frl.2019.09.008
- CoinMarketCap, 2021 Available online 4 May 2021 https://coinmarketcap.com
- Conlon, T., & McGee, R. (2020). Safe haven or risky hazard? Bitcoin during the COVID-19 bear market. Finance Research Letters, 35, 101607. https://doi.org/10.1016/j.frl.2020.101607
- Corbet, S., Meegan, A., Larkin, C., Lucey, B., & Yarovaya, L. (2018). Exploring the dynamic relationships between cryptocurrencies and other financial assets. Economics Letters, 165, 28–34. https://doi.org/10.1016/j.econlet.2018.01.004
- Das, D., & Kannadhasan, M. (2018). Do global factors impact bitcoin prices? Evidence from wavelet approach. Journal of Economic Research, 23, 227–264.
- Demir, E, Bilgin, M. H, Karabulut, G, & Doker, A. C. (2020). The relationship between cryptocurrencies and COVID-19 pandemic. Eurasian Economic Review, 10(3), 349–360. https://doi.org/10.1007/s40822-020-00154-1
- Durcheva, M., & Tsankov, P. (2019, November). Analysis of similarities between stock and cryptocurrency series by using graphs and spanning trees. In AIP conference proceedings (Vol. 2172, No. 1, p. 090004). AIP Publishing LLC.
- Dyhrberg, A. H. (2016a). Bitcoin, gold and the dollar–A GARCH volatility analysis. Finance Research Letters, 16, 85–92. https://doi.org/10.1016/j.frl.2015.10.008
- Dyhrberg, A. H. (2016b). Hedging capabilities of bitcoin. Is it the virtual gold? Finance Research Letters, 16, 139–144. https://doi.org/10.1016/j.frl.2015.10.025
- Enilov, M., Fazio, G., & Ghoshray, A. (2021). Global connectivity between commodity prices and national stock markets: A time‐varying MIDAS analysis. International Journal of Finance & Economics, 1–13. https://doi.org/10.1002/ijfe.2552
- Feng W, Wang Y and Zhang Z. (2018). Can cryptocurrencies be a safe haven: a tail risk perspective analysis. Applied Economics, 50(44), 4745–4762. https://doi.org/10.1080/00036846.2018.1466993
- Gajardo, G, Kristjanpoller, W. D, & Minutolo, M. (2018). Does Bitcoin exhibit the same asymmetric multifractal cross-correlations with crude oil, gold and DJIA as the Euro, great british pound and yen? Chaos, Solitons, and Fractals, 109, 195–205. https://doi.org/10.1016/j.chaos.2018.02.029
- Gouhier, T. C, Grinsted, A, Simko, V, Gouhier, M. T. C, & Rcpp, L. (2013). Package ‘biwavelet’. Spectrum, 24, 2093–2102. https://github.com/tgouhier/biwavelet
- Grinsted, A., Moore, J. C., & Jevrejeva, S. (2004). Application of the cross wavelet transform and wavelet coherence to geophysical time series. Nonlinear Processes in Geophysics, 11(5/6), 561–566. https://doi.org/10.5194/npg-11-561-2004
- Handika, R, Soepriyanto, G, & Havidz, S. A. H. (2019). Are cryptocurrencies contagious to Asian financial markets? Research in International Business and Finance, 50, 416–429. https://doi.org/10.1016/j.ribaf.2019.06.007
- Hemche, O, Jawadi, F, Maliki, S. B, & Cheffou, A. I. (2016). On the study of contagion in the context of the subprime crisis: A dynamic conditional correlation–multivariate GARCH approach. Economic Modelling, 52, 292–299. https://doi.org/10.1016/j.econmod.2014.09.004
- JERIBI, A., Chamsa, D., & Manzli, Y. S. (2020). Emerging stock markets’ reaction to COVID-19: can cryptocurrencies be a safe haven? Studies, 2(3), 152–165 http://doi.org/10.26677/TR1010.2020.619. .
- Jeribi A and Ghorbel A. (2021). Forecasting developed and BRICS stock markets with cryptocurrencies and gold: generalized orthogonal generalized autoregressive conditional heteroskedasticity and generalized autoregressive score analysis. IJOEM, https://doi.org/10.1108/IJOEM-06-2020-0688
- Klein, T, Thu, H. P, & Walther, T. (2018). Bitcoin is not the new gold–A comparison of volatility, correlation, and portfolio performance. International Review of Financial Analysis, 59, 105–116. https://doi.org/10.1016/j.irfa.2018.07.010
- Kumah, S. P., Abbam, D. A., Armah, R., & Appiah-Kubi, E. (2021). African financial markets in a storm: Cryptocurrency safe havens during the COVID-19 pandemic. Journal of Research in Emerging Markets, 3(2), 60–70. https://doi.org/10.30585/jrems.v3i2.635
- Kumar, A. S., & Kamaiah, B. (2017). Returns and volatility spillover between Asian equity markets: A wavelet approach. Economic Annals, 62(212), 63–83. https://doi.org/10.2298/EKA1712063K
- Li, R., Li, S., Yuan, D., & Yu, K. (2020). Does economic policy uncertainty in the US influence stock markets in China and India? Time-frequency evidence. Applied Economics, 52(39), 4300–4316. https://doi.org/10.1080/00036846.2020.1734182
- Lo, A. W. (2004). Lo. The adaptive markets hypothesis. The Journal of Portfolio Management, 30(5), 15–29. https://doi.org/10.3905/jpm.2004.442611
- Markowitz, H. (1952). Portfolio Selection. Journal of Finance. Markowitz, HM—1952, 77–91.
- Müller, U. A., Dacorogna, M. M., Davé, R. D., Olsen, R. B., Pictet, O. V., & Von Weizsäcker, J. E. (1997). Volatilities of different time resolutions—analyzing the dynamics of market components. Journal of Empirical Finance, 4(2–3), 213–239. https://doi.org/10.1016/S0927-5398(97)00007-8
- Ng, E. K., & Chan, J. C. (2012). Geophysical applications of partial wavelet coherence and multiple wavelet coherence. Journal of Atmospheric and Oceanic Technology, 29(12), 1845–1853. https://doi.org/10.1175/JTECH-D-12-00056.1
- Nguyen, H., Liu, B., & Parikh, N. Y. (2020). Exploring the short-term momentum effect in the cryptocurrency market. Evolutionary and Institutional Economics Review, 17(2), 425–443. https://doi.org/10.1007/s40844-020-00176-z
- Omane-Adjepong, M., Alagidede, P., & Akosah, N. K. (2019). Wavelet time-scale persistence analysis of cryptocurrency market returns and volatility. Physica A: Statistical Mechanics and Its Applications, 514, 105–120. https://doi.org/10.1016/j.physa.2018.09.013
- Owusu Junior, P, Adam, A. M, Asafo-Adjei, E, Boateng, E, Hamidu, Z, & Awotwe, E. (2021a). Time-frequency domain analysis of investor fear and expectations in stock markets of BRIC economies. Heliyon, 7(10), e08211. https://doi.org/10.1016/j.heliyon.2021.e08211
- Owusu Junior, P., Adam, A. M., & Tweneboah, G. (2020). Connectedness of cryptocurrencies and gold returns: Evidence from frequency-dependent quantile regressions. Cogent Economics & Finance, 8(1), 1804037. https://doi.org/10.1080/23322039.2020.1804037
- Owusu Junior, P, Frimpong, S, Adam, A. M, Agyei, S. K, Gyamfi, E. N, Agyapong, D, & Tweneboah, G. (2021). COVID-19 as information transmitter to global equity markets: Evidence from CEEMDAN-based transfer entropy approach. Mathematical Problems in Engineering, 2021.
- Owusu Junior, P, Tiwari, A. K, Tweneboah, G, & Asafo-Adjei, E. (2022). GAS and GARCH based value-at-risk modeling of precious metals. Resources Policy, 75, 102456. https://doi.org/10.1016/j.resourpol.2021.102456
- Pal, D., & Mitra, S. K. (2019). Oil price and automobile stock return co-movement: A wavelet coherence analysis. Economic Modelling, 76, 172–181. https://doi.org/10.1016/j.econmod.2018.07.028
- Pieters, G, & Vivanco, S. (2017). Financial regulations and price inconsistencies across Bitcoin markets. Information Economics and Policy, 39, 1–14. https://doi.org/10.1016/j.infoecopol.2017.02.002
- Qiao, X, Zhu, H, & Hau, L. (2020). Time-frequency co-movement of cryptocurrency return and volatility: Evidence from wavelet coherence analysis. International Review of Financial Analysis, 71, 101541. https://doi.org/10.1016/j.irfa.2020.101541
- Rua, A, & Nunes, L. C. (2009). International comovement of stock market returns: A wavelet analysis. Journal of Empirical Finance, 16(4), 632–639. https://doi.org/10.1016/j.jempfin.2009.02.002
- Sami, M., & Abdallah, W. (2020). Cryptocurrency and stock markets: Complements or substitutes? Evidence from gulf countries. Sami M., & Abdallah W. (2020). Cryptocurrency and Stock Market: Complements or Substitutes, 25–35.
- Şenol, Z., & ZEREN, F. (2020). Coronavirus (COVID-19) and stock markets: The effects of the pandemic on the global economy. Avrasya Sosyal ve Ekonomi Arastirmalari Dergisi, 7(4), 1–16.
- Shahzad, S. J. H, Bouri, E, Roubaud, D, & Kristoufek, L. (2020). Safe haven, hedge and diversification for G7 stock markets: Gold versus bitcoin. Economic Modelling, 87, 212–224. https://doi.org/10.1016/j.econmod.2019.07.023
- Shahzad S Jawad, Bouri E, Roubaud D, Kristoufek L and Lucey B. (2019). Is Bitcoin a better safe-haven investment than gold and commodities?. International Review of Financial Analysis, 63 322–330. 10.1016/j.irfa.2019.01.002
- Su, X., & Li, Y. (2020). Dynamic sentiment spillovers among crude oil, gold, and Bitcoin markets: Evidence from time and frequency domain analyses. Plos one, 15(12), e0242515. https://doi.org/10.1371/journal.pone.0242515
- Tiwari, A. K, Raheem, I. D, & Kang, S. H. (2019). Time-varying dynamic conditional correlation between stock and cryptocurrency markets using the copula-ADCC-EGARCH model. Physica A: Statistical Mechanics and Its Applications, 535, 122295. https://doi.org/10.1016/j.physa.2019.122295
- Torrence, C, & Compo, G. P. (1998). A practical guide to wavelet analysis. Bulletin of the American Meteorological Society, 79(1), 61–78. https://doi.org/10.1175/1520-0477(1998)079<0061:APGTWA>2.0.CO;2
- Tweneboah, G., Owusu Junior, P, & Oseifuah, E. K. (2019). Integration of major African stock markets: Evidence from multi-scale wavelets correlation. Academy of Accounting and Financial Studies Journal, 23(6), 1–15.
- Vacha, L., & Barunik, J. (2012). Co-movement of energy commodities revisited: Evidence from wavelet coherence analysis. Energy Economics, 34(1), 241–247. https://doi.org/10.1016/j.eneco.2011.10.007
- Van Hoang, T. H, Lahiani, A, & Heller, D. (2016). Is gold a hedge against inflation? New evidence from a nonlinear ARDL approach. Economic Modelling, 54, 54–66. https://doi.org/10.1016/j.econmod.2015.12.013
- Wu, K, Zhu, J, Xu, M, & Yang, L. (2020). Can crude oil drive the co-movement in the international stock market? Evidence from partial wavelet coherence analysis. The North American Journal of Economics and Finance, 53, 101194. https://doi.org/10.1016/j.najef.2020.101194
- Yarovaya, L, Brzeszczyński, J, & Lau, C. K. M. (2016). Intra-and inter-regional return and volatility spillovers across emerging and developed markets: Evidence from stock indices and stock index futures. International Review of Financial Analysis, 43, 96–114. https://doi.org/10.1016/j.irfa.2015.09.004
Appendix
Figure 6. Co-movements between gold and African stocks and between gold and cryptocurrencies.
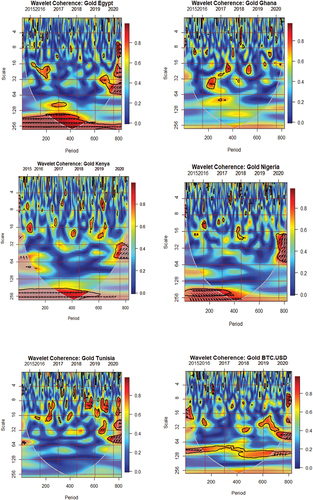
Figure 6. (Continued)