
 ?Mathematical formulae have been encoded as MathML and are displayed in this HTML version using MathJax in order to improve their display. Uncheck the box to turn MathJax off. This feature requires Javascript. Click on a formula to zoom.
Abstract
If a company’s corporate performance forecasting bias is not zero and it continues to over- or under-predict actual performance, capital investments and employment will deviate from their expected levels. Therefore, forecast bias is a very important issue for a company’s management. However, few empirical studies exist on corporate performance forecasting bias in start-up companies, given the data limitations. Most existing studies have primarily analysed listed companies, and few studies particularly targeted small, medium and micro or start-up companies. Therefore, this study uses data from start-up companies that received loans from the Japan Finance Corporation (JFC) to investigate how new start-up companies’ performance forecasting bias is affected by their attributes and past performance forecasts. The results of the analysis showed that company size, profitability and optimism of past performance forecasts had a positive impact on performance forecasting bias. The results of this research contribute to the elaboration of corporate performance forecasts and are expected to be useful for corporate management when formulating management strategies and engaging in resource allocation, stakeholder decision making and policymaking.
1. Introduction
Performance forecast bias refers to the extent to which the forecast error (the difference between actual and forecast performance) deviates from zero. In addition to direct factors, such as company size and financial strength, indirect factors, such as management characteristics, can cause a positive or negative bias in the performance forecasts announced by companies. Companies make decisions regarding capital investments, employment of employees and other issues using their forecasts of future conditions and the economic environment. If a company’s performance forecast has a continuing bias, its capital investments and employment will deviate from their optimal levels. Therefore, if a company’s performance forecasts are biased, over- or under-investments in capital and employment will occur, making it difficult for the company to allocate resources efficiently.
Although performance forecast bias is a critical issue for corporate management, few empirical studies exist on the topic because obtaining data is difficult. Furthermore, most existing studies focused their analysis on publicly listed firms and few focused on small and micro firms and start-up businesses.
Some previous studies pointed out that a systematic bias exists when companies forecast their production (Bachmann and Elstner, Citation2015). Others noted that companies with optimistic forecasts tend to display a performance forecasting bias (Ota, Citation2006; Kato et al., Citation2009; Tsumuraya, Citation2009).
Therefore, the two following research questions were proposed. First, what are the attributes of start-up companies influence performance forecasting bias? Second, how do companies’ past performance forecasts affect their performance forecasting bias? To answer these questions, this study analysed the relationship between company attributes and corporate performance forecasting bias. Moreover, data from start-up companies that received loans from the Japan Finance Corporation (JFC) were used to analyse the relationship between past performance forecasts and performance forecasting bias.
Miller and Friesen (Citation1984), a leading study of the corporate life cycle, showed that companies develop in five common stages: birth, growth, maturity, revival, and decline. This study analyses mainly enterprises in the birth stage. The birth stage is the period during which a new company is trying to become a viable entity. The main characteristics of companies in this stage are that they are young, controlled by owners and have a simple and informal structure.
This study focused on the rarely studied performance prediction bias of start-up companies and performed an analysis using panel data. Knowing what type of company has what type of performance forecast bias as well as the causes of such bias leads to refinement in a company’s performance forecast. Therefore, the results of this research are expected to be useful as a form of corporate support in constructing management strategies, resource allocation, stakeholder decision making and policymaking.
The structure of this study is as follows. Section 2 describes previous research on performance forecast bias. Section 3 describes the methods, data and variables of the empirical analysis. Section 4 presents the results and interpretation of the empirical analysis. Section 5 concludes.
2. Literature review
This section summarises previous studies on performance forecasting bias. McDonald (Citation1973) is a classic study of the bias in company published profit forecasts. Using profit forecasts published in the Wall Street Journal, McDonald (Citation1973) statistically examined the frequency of over- and under-forecasting and revealed the existence of forecast bias. Bachmann and Elstner (Citation2015) used microdata from German manufacturers and showed that some companies systematically over- or under-predict their production growth and have forecast biases regarding their output. These studies pointed to the existence of biases in companies’ forecasts of their performance.
Several studies also examined the impact of corporate attributes on corporate performance bias. Koch (Citation2003) used a sample of management earnings forecasts collected by First Call Corporation in Boston to examine the relationship between financial difficulties and bias in management-generated voluntary earnings forecasts and noted that bias exists in companies experiencing financial difficulties. Similarly, Frost (Citation1997) and Mande et al. (Citation2003) showed that companies in financially distressed situations are biased when making optimistic earnings forecasts. In addition, Suzuki (Citation2014) showed that companies that tend to overpredict are Japanese listed companies whose managers are rewarded with the benefits of high share prices, financially distressed companies, companies operating under strong stock market pressure and companies planning to raise funds from shareholders during the forecast financial year; in contrast, companies operating under strong pressure from creditors tend to publish under-predictions. These studies showed that companies’ financial situation and financing status affect their performance forecasting bias.
Next, the following studies showed that variables related to company ownership and organisational structure affect performance forecasting bias. Umezawa and Goto (Citation2007) found that the ownership structure variables of the shares of Japanese listed companies, such as managers, financial institutions, foreign investors and other firms, affect the bias of managers’ earnings forecasts. Sosnowski and Wawryszuk-Misztal (Citation2019) used data from companies that conducted initial public offerings on the Warsaw Stock Exchange to show that earnings forecasting bias improves as the board of directors’ ages become more diverse and management ownership increases. Ali and Zhang (Citation2015) used data from companies included in the ExecuComp, to show that CEO tenure and the severity of external and internal audits affect the bias of their earnings forecasts. Ajinkya et al. (Citation2005) and Tsumuraya (Citation2009) pointed out that the presence of outside directors plays a role in improving performance forecasting bias.
Jaggi (Citation1978) used the Wall Street Journal as a data source for earnings forecasts to study performance forecasting bias by industry and found that the accuracy of earnings forecasting differed by industry. McDonald (Citation1973) stated that utilities need to more accurately forecast future earnings because they are subject to government regulation; the study also discussed the background behind the differences in earnings forecast accuracy by industry. As previously mentioned, prior studies showed that company attributes, such as financial condition, capital structure and industry, affect the bias of company performance forecasts.
Studies exist on the continuity of the performance forecasting bias, such as the fact that companies that make optimistic forecasts continue to make them and companies that make conservative forecasts continue to make them. Ota (Citation2006) used data on Japanese listed companies from 1979 to 1999 and showed that bias has continuity. Similarly, Kato et al. (Citation2009) examined data on Japanese listed companies from 1997 to 2007 and found that managers’ annual earnings forecasts were, on average, optimistic with an upward bias and that optimistic forecasts were persistent. Koga and Kato (Citation2017) used data on Japanese listed companies from 1989 to 2015 to investigate corporate performance forecasts and found that the state of corporate earnings affects bias over the long-term and that companies that are performing well are more likely to be optimistic in both their short- and long-term corporate performance forecasts. Tsumuraya (Citation2009) used data from a survey of investor relations activities and revealed the existence of both conservative and optimistic corporate performance forecasting bias for Japanese companies, noting that the direction of this bias may be irreversible.
There is an extensive literature on demand forecasts and biases for goods and services, rather than performance forecasts (Arvan et al., Citation2019; Petropoulos et al., Citation2022). Their results point to the existence of an optimism bias, especially when adjusting forecasts positively, which leads to lower accuracy (Fildes et al., Citation2009; Franses & Legerstee, Citation2009; Syntetos et al., Citation2009).
These previous studies analysed on performance forecasting bias primarily large- and medium-sized companies. Few studies analysed corporate performance forecasting bias for start-up and small and medium-sized enterprises (SMEs) because of data constraints. Verifying corporate performance forecasting bias requires panel data on accumulated forecast and actual values for each company for a certain period. However, such data are often not publicly available. In particular, available data on start-up and SMEs are limited, despite their significant impact on the economy in terms of the number of companies and the number of people employed. In contrast, this study uses the JFC Business Startup Panel Survey by the Panel Data Research Center at Keio University to enable an empirical analysis of small start-up companies in Japan. Therefore, this study analysed the relationship between the attributes of start-up companies and their corporate performance forecasting bias using panel data and the continuity of this bias.
3. Empirical analysis
3.1. Data overview
In this study, two research questions were proposed. First, what are the attributes of start-up companies influence performance forecasting bias? Second, how do companies’ past performance forecasts affect performance forecasting bias? To answer these research questions, this study analysed the relationship between company attributes and corporate performance forecasting bias, and the relationship between past performance forecasts and performance forecasting bias was analysed using data from start-up companies that received loans from the JFC.
This study uses the JFC Business Startup Panel Survey data from the JFC through the Panel Data Research Center at Keio University. JFC is a public corporation wholly owned by the Japanese government that aims to complement financial activities performed by private financial institutions. JFC provides business loans to SMEs and business start-ups. According to Japan Finance Corporation (Citation2012), JFC provides general business loans, as well as start-up loans, safety net loans for companies affected by disasters, and loans related to social business. In addition, JFC provides loans that are not biased to regions or industries. The number of lender companies and average loan balance per company are shown in . Compared with banks and credit unions, the JFC is mainly engaged in small-lot finance.
Table 1. Number of lender companies and average loan balance per company
The first questionnaire was sent to 9,287 companies that were assumed to have opened in 2011 with a loan from the JFC National Life Programme, and 3,046 of the responding companies (excluding those in the property rental industry) were identified as continuing survey targets if they were confirmed to have opened in 2011. Questionnaire respondents comprised the sample of JFC Startup Panel Survey data. The 2011 questionnaire included questions on the business outline, manager attributes, financing situation and the extent of preparation when the business started up. By 2015, the JFC conducted annual follow-ups with these companies and explored their status. Because these data cover companies from across Japan, excluding Okinawa prefecture, no area bias exists. Because forecast and actual performance for the following year is used, the data period is four years, from 2012 to 2015. The JFC Business Startup Panel Survey identifies the following three types of firms as being out of business; (i) companies that responded to a questionnaire question asking about the continuation of their business by stating that they are not currently in business; (ii) companies that were confirmed not to be in business through on-site surveys or other means; and (iii) companies that were confirmed not to be in business by JFC branches. The going out of business rate is 10.18% for all the companies analysed in the JFC Business Startup Panel Survey. If a company went out of business, it was excluded from the analysis from the year in which it went out of business. If a company had missing values in the explained and dependent variables in a given year, the company was excluded from the analysis in that year. The above results in unbalanced panel data. Survival bias may exist because of the large going-out-of-business rate. It was 3,831 observations in 1,243 companies included in the sample.
3.2. Empirical methodology
This study uses a fixed effects model in a panel regression model for the empirical analysis and a 5% significance level is adopted. A fixed effects model is used to remove the effects of unobserved time-invariant company-specific characteristics. The model used in this study does not include time-fixed effects.
For details on the fix effect models, see, Cameron and Trivedi (Citation2005) and Wooldridge (Citation2010). To avoid multiple collinearity, highly correlated explanatory variables are not included in the model.
This study analyses the relationship between the attributes of start-up companies and corporate performance forecasting bias and between past performance forecasts and performance forecasting bias. The explained and explanatory variables are described as follows.
Performance forecasting bias is used as the explained variable. Previous studies used various definitions of performance forecasting bias (Rogers and Stocken, Citation2005). For example, there are four measurement methods for performance forecast bias: prediction error, absolute prediction error, prediction error rate, and absolute prediction error rate. The current year is designated as period . The prediction error is defined as
The absolute prediction error is defined as
The prediction error rate is defined as
The absolute prediction error rate is defined as
The prediction error is the simplest, but scale dependent. The absolute forecast errors are scale-dependent and cannot distinguish between over- and under-prediction. The prediction error rate is a ratio, so it controls for size; the absolute prediction error rate also controls for size, but cannot distinguish between over- and under-prediction. Since the prediction error rate and absolute prediction error rate are ratios, they have the property of becoming larger when the denominator is smaller. In addition, the prediction error rate and absolute prediction error rate may be sign-reversed and difficult to interpret when the denominator is negative.
In this study, as in Tsumuraya (Citation2009), performance forecasting bias is defined as the prediction error rate at which over- and under-predictions can be discriminated, controlling for size. In this study, sales (average monthly sales, in tens of thousands yen) are used as a measure of performance, so there is no possibility of the denominator being negative. If the performance forecasting period as of period
is lower than the actual performance in period
, the numerator is negative, the performance forecasting bias is calculated negatively, and the performance forecast can be interpreted as having an under-performance bias. In contrast, if the performance forecasting in period
as of period
is greater than the actual performance in period
, the bias is positive and the performance forecasting can be interpreted as having an excessive bias.
Next, the explanatory variables are described. The first is the forecast ratio of performance, which is a variable that expresses the rate of the forecast for period at time of
compared to the actual performance for period
. The forecast ratio of performance to period
at time
, defined as follows,
The forecast ratio of performance is also a ratio and therefore has the same mathematical properties as the prediction error rate as a measurement measure.
If the business performance forecast in period at period
is lower than the actual business performance in period
, then the numerator and the ratio of forecasted business performance to the next period are both negative. In this case, the forecast of performance for the next period can be interpreted as conservative. In contrast, if the performance forecast in period
at time
is greater than the actual performance in period
, the forecast ratio is positive and can be interpreted as an optimistic performance forecast.
If the coefficient of the forecast ratio of performance to period at time
is positive and significant, then the earnings forecast bias tends to be greater if more optimistic performance forecasts are made in period
. In contrast, a negatively significant coefficient of the forecast ratio of performance indicates that as more conservative forecasts are made in period
, the greater the performance forecast bias tends to be. Using this variable makes it possible to determine whether a forecasting bias exists because of management expectations, as pointed out by Ota (Citation2006), Kato et al. (Citation2009), and Tsumuraya (Citation2009).
The second explanatory variable is the company’s profitability in period . Given the limitation of the data from the questionnaire survey, a company’s profitability variable takes the value of 1 if the company was profitable in period
and 0 if it was unprofitable in period
. If the coefficient of the company profitability variable in period
is positive and significant, then the performance forecasting bias tends to be greater if the company was profitable in period
. This result can be interpreted as a tendency to have a larger performance forecasting bias if the company was profitable in period
. In contrast, a negatively significant coefficient of this variable can be interpreted as the performance forecasting bias being greater when the company was not profitable in period
. As Koga and Kato (Citation2017) pointed out, a variable related to the company’s profitability situation is employed when a company’s earnings situation affects the bias.
The third explanatory variable is the company’s cash flow situation in period . Given the limitations of the data from the questionnaire survey, this variable was defined as taking the value of 0 if the cash flow in period
was not tight and 1 if tight. A positive and significant coefficient of this variable is interpreted as the performance forecasting bias being greater if the cash flow in period
was not severe. In contrast, a negatively significant coefficient of this variable is interpreted as the performance forecasting bias being greater if the cash flow in period
was severe. Frost (Citation1997), Koch (Citation2003), Mande et al. (Citation2003), and Suzuki (Citation2014) pointed out that a variable related to the company’s cash flow situation is employed when a company’s financial situation affects the bias.
The fourth explanatory variable is sales (average monthly sales, in tens of thousands yen) as a proxy variable for company size as a control variable. Ota (Citation2006) noted that the larger the company, the greater the performance forecasting bias.
The regression model can be written in mathematical form as follows. For individual companies and several time periods
where is the fixed effect for the individual company and
is the error term.
provides the descriptive statistics for each variable.
Table 2. Descriptive statistics for each variable
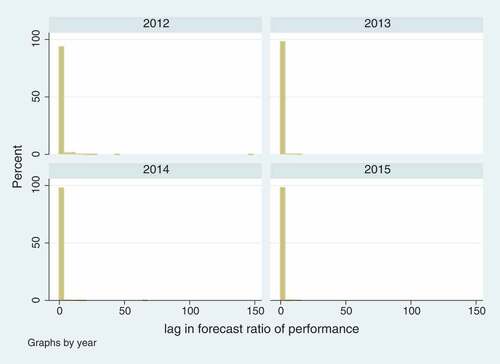
The histograms of each variable are described in . Outliers were found for performance forecast bias, forecast ratio of performance and sales, so they were winsorised at the 1% and 99% points in the regression analysis. It cannot be determined from that the performance forecast bias is increasing with time.
Figure 1. Histogram of performance forecast bias.
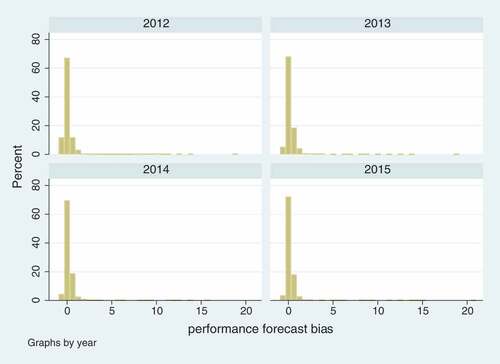
Figure 2. Histogram of lag in forecast ratio of performance.
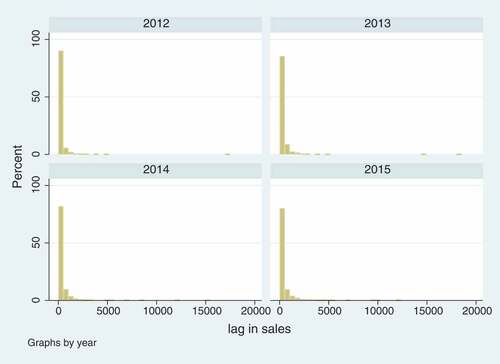
Figure 3. Histogram lag in profitability.
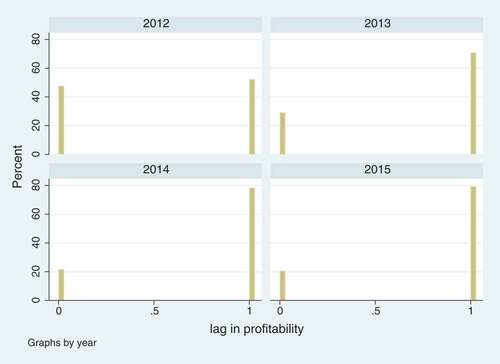
Figure 4. Histogram of lag in cash flow.
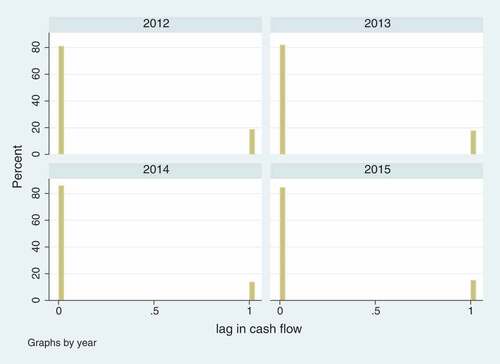
Figure 5. Histogram of lag in sales.
4. Results and discussion
shows the estimated results of the fixed effects model in the panel regression model. The coefficients of the performance forecast ratio, profitability status and sales were significantly positive and are explained as follows.
Table 3. Results of fixed effects model in panel regression model
The coefficient of the performance forecasting ratio was significantly positive, indicating that the more optimistic managers forecast in the previous year, the greater the performance forecasting bias, which is consistent with Ota (Citation2006), Kato et al. (Citation2009), Tsumuraya (Citation2009), Fildes et al. (Citation2009), Franses and Legerstee (Citation2009), and Syntetos et al. (Citation2009) points to the existence of optimism bias in demand forecasting, but optimism bias are observed in performance forecasting.
The coefficient of a company’s profitability was significantly positive. The better the company’s profitability status, the more positive the bias in the performance forecast tended to be. This result is consistent with the result from Koga and Kato (Citation2017) that company earnings status affects positive performance forecast bias. Heuristics are laws and cues used unconsciously when making judgments, but heuristics are known to cause cognitive biases and inappropriate judgments (Kahneman & Frederick, Citation2002; Lawrence et al., Citation2006; Tversky & Kahneman, Citation1974). In this study, the profit situation one year ago positively influenced the performance forecast bias in the current year at one year ago. This suggests that the easy-to-understand information of the profit situation one year ago is used as a heuristic to forecast the future, resulting in a cognitive bias and possibly making performance forecasting inaccurate.
The coefficient of sales was significantly positive. Sales is a proxy variable for the company’s size. The larger the company, the more optimistic performance forecasts tended to be. This result is consistent with the findings in Ota (Citation2006).
The coefficient of a company’s cash flow was not found to be significant. Therefore, the results were not consistent with Frost (Citation1997), Koch (Citation2003), Mande et al. (Citation2003), and Suzuki (Citation2014), who found that companies’ financial situation affects bias. This discrepancy may be the result of the limitations of the questionnaire data that caused only companies with tight cash flow to have dummy variables that took a value of 1; therefore, not much information was available on cash flow.
As mentioned in Section 3.1, JCR lends without bias in industry and region, so there is little bias in the analysis results regarding industry and region. However, as JCR loans are relatively small loans, there is a selection bias in that the analysis is focused on micro-enterprises in particular.
5. Conclusion
The research question set in this study was how the attributes of start-up companies and companies’ past performance forecasts affect performance forecasting bias. To answer these research questions, the relationship between company attributes and past corporate performance forecasts and performance forecasting bias was analysed using data on start-up companies that received loans from JFC.
The analysis revealed that a positive performance forecasting bias exists when past performance forecasts are optimistic. A performance forecast bias was also found to exist for companies that were profitable prior to the forecast and for larger companies. These results are consistent with the results of previous studies that analysed corporate performance forecasting bias in large companies. Furthermore, variables related to the company’s cash flow did not significantly affect the performance forecast bias.
One issue for future studies is that, because the analysis in this study was conducted using panel data, using variables that do not change over time was not possible, such as managers’ attributes, and restrictions existed on the variables that could be selected. In particular, corporate performance forecasts are considered to be influenced by the attributes of the managers who announce performance. Therefore, in future research, adopting variables, including non- financial variables, such as manager characteristics, is necessary. In addition, because the period and companies analysed were limited, a wider sample is needed for future studies.
Despite these limitations, this study focused on corporate performance forecasting bias in start-up companies, which was rarely studied and conducted a panel data analysis using panel data. Therefore, the results of this study are expected to be useful in the development of management strategies, resource allocation, stakeholder decision- making and policymaking to support companies because they will lead to the refinement of corporate performance forecasts.
Disclosure statement
No potential conflict of interest was reported by the author(s).
Additional information
Funding
Notes on contributors
Yukiko Konno
Yukiko Konno is an associate professor at Faculty of Economics, Kokugakuin University. Her research interests include financial management and quantitative analysis of company activities.
References
- Ajinkya, B., Bhojraj, S., & Sengupta, P. (2005). The association between outside directors, institutional investors and the properties of management earnings forecasts. Journal of Accounting Research, 43(3), 343–13. https://doi.org/10.1111/j.1475-679x.2005.00174.x
- Ali, A., & Zhang, W. (2015). CEO tenure and earnings management. Journal of Accounting and Economics, 59(1), 60–79. https://doi.org/10.1016/j.jacceco.2014.11.004
- Arvan, M., Fahimnia, B., Reisi, M., & Siemsen, E. (2019). Integrating human judgement into quantitative forecasting methods: A review. Omega, 86, 237–252. https://doi.org/10.1016/j.omega.2018.07.012
- Bachmann, R., & Elstner, S. (2015). Firm optimism and pessimism. European Economic Review, 79, 297–325. https://doi.org/10.1016/j.euroecorev.2015.07.017
- Cameron, A. C., & Trivedi, P. K. (2005). Microeconometrics: Methods and applications. Cambridge University Press.
- Fildes, R., Goodwin, P., Lawrence, M., & Nikolopoulos, K. (2009). Effective forecasting and judgmental adjustments: An empirical evaluation and strategies for improvement in supply-chain planning. International Journal of Forecasting, 25(1), 3–23. https://doi.org/10.1016/j.ijforecast.2008.11.010
- Franses, P. H., & Legerstee, R. (2009). Properties of expert adjustments on model-based SKU-level forecasts. International Journal of Forecasting, 25(1), 35–47. https://doi.org/10.1016/j.ijforecast.2008.11.009
- Frost, C. A. (1997). Disclosure policy choices of UK firms receiving modified audit reports. Journal of Accounting and Economics, 23(2), 163–187. https://doi.org/10.1016/S0165-4101(97)00006-2
- Jaggi, B. (1978). Comparative accuracy of management’s annual earnings forecast. Financial Management, 7(4), 24–32. https://www.jstor.org/stable/3665082
- Japan Finance Corporation. (2012). . Japan Finance Corporation Disclosure, in Japanese.
- Kahneman, D., & Frederick, S. (2002). Representativeness revisited: Attribute substitution in intuitive judgment. In T. Gilovich, G. Dale, & D. Kahneman (Eds.), Heuristics and biases: The psychology of intuitive judgment (pp. 49–81). Cambridge University Press.
- Kato, K., Skinner, D. J., & Kunimura, M. (2009). Management forecasts in Japan: An empirical study of forecasts that are effectively mandated. The Accounting Review, 84(5), 1575–1606. https://doi.org/10.2308/accr.2009.84.5.1575
- Koch, A. S. (2003) Financial distress and the credibility of management earnings forecasts. GSIA Working Paper, No. 2000-10, 1–41.
- Koga, M., & Kato, H. (2017). Behavioral biases in firms’ growth expectations. Bank of Japan working paper series, 17-E-9. Bank of Japan, 1–59.
- Lawrence, M., Goodwin, P., O’Connor, M., & Önkal, D. (2006). Judgmental forecasting: A review of progress over the last 25years. International Journal of Forecasting, 22 (3), 493–518 https://doi.org/10.1016/j.ijforecast.2006.03.007
- Mande, V., Wohar, M. E., & Ortman, R. F. (2003). An investigation of asymmetric earnings forecasts of Japanese financial analysts. Multinational Business Review, 11(1), 13–43. https://doi.org/10.1108/1525383X200300002
- McDonald, C. L. (1973). An empirical examination of the reliability of published predictions of future earnings. The Accounting Review, 48(3), 502–510. https://www.jstor.org/stable/245148.
- Miller, D., & Friesen, P. H. (1984). A longitudinal study of the corporate life cycle. Management Science, 30(10), 1161–1183. https://doi.org/10.1287/mnsc.30.10.1161
- Ota, K. (2006). Determinants of bias in management earnings forecasts: Empirical evidence from Japan. In G. N. Gregoriou & M. K. A.-G. Gaber (Eds.), International accounting: Standards, regulations, and financial (pp. 267–294). Elsevier Press.
- Petropoulos, F., et al. (2022).Forecasting: Theory and practice. International Journal of Forecasting. 38(3). 705–871.
- Rogers, J. L., & Stocken, P. C. (2005). Credibility of management forecasts. The Accounting Review, 80(4), 1233–1260. https://doi.org/10.2308/accr.2005.80.4.1233
- Sosnowski, T., & Wawryszuk-Misztal, A. (2019). Board characteristics and earnings forecasts accuracy in IPO prospectuses. International Journal of Management and Economics, 55(1), 25–29. https://doi.org/10.2478/ijme-2019-0003
- Suzuki, T. (2014). Management incentives to publish aggressive or conservative earnings forecasts and disclosure policy change. In K. Ito & M. Nakano (Eds.), International perspectives on accounting and corporate (pp. 285–309). Springer.
- Syntetos, A. A., Nikolopoulos, K., Boylan, J. E., Fildes, R., & Goodwin, P. (2009). The effects of integrating management judgement into intermittent demand forecasts. International Journal of Production Economics, 118(1), 72–81. Special Section on Problems and models of inventories selected papers of the fourteenth International symposium on inventories. https://doi.org/10.1016/j.ijpe.2008.08.011
- Tsumuraya, S. (2009). Analysis of bias in management forecasts. Security Analysts Journal, 47 (5), 77–88. in Japanese
- Tversky, A., & Kahneman, D. (1974). Judgment under uncertainty: Heuristics and biases. Science, 185(4157), 1124–1131. https://doi.org/10.1126/science.185.4157.1124
- Umezawa, T., & Goto, U. (2007). Corporate ownership structure and management earnings forecast. Corporate Ownership and Control, 4(3), 2470–2570. https://doi.org/10.22495/cocv4i3c2p2
- Wooldridge, J. M. 2010. . Econometric analysis of cross section and panel data, 2nd. MIT Press.