
 ?Mathematical formulae have been encoded as MathML and are displayed in this HTML version using MathJax in order to improve their display. Uncheck the box to turn MathJax off. This feature requires Javascript. Click on a formula to zoom.
Abstract
This article discussed the impact of Covid-19 pandemic on the performance of Equity and Fixed-Income Islamic unit trusts in Malaysia. The study adopted two methods of analysis; (i) empirical analysis using conventional methodologies such as Sharpe, Treynor and Jensen in comparing the 2019 and 2020 performance of Malaysian Islamic fixed-income and Islamic equity unit trust funds, whilst run (ii) in-depth performance review on Islamic unit trusts using systematic literature review. The findings show that both the Islamic unit trust funds and fixed-income equity demonstrated fairly good performance, indicating an outperformed indicator as compared to the established benchmark during the Covid-19 pandemic. Thus, given significant positive insight to the investors would profiting from Islamic mutual or unit trust funds, by offering decent hedging for long-run investment. Second, risk-averting investors may benefit from investing in the diversified portfolios of Islamic equity funds as they have been proven to perform marginally better than conventional funds owing to better risk management.
1. Introduction
Malaysia is one of the largest contributors to the biggest market share in the Islamic funds industry globally after Saudi Arabia. Currently, Malaysian Islamic investment market holds 388 funds in the form of equity, fixed-income, sukuk, money market and real estate totaling USD 22.6 billion or a contribution of 45% Assets Under Management (AUM; Bank Negara, Citation2018; Hassan et al., Citation2010; Securities Commission, Citation2020). In terms of global market share of Islamic financial assets, the total market value for all investments for Islamic AUM managed by entity of fund on behalf of investors increases by 31.9% in 2020 despite the pandemic (IFSB, Citation2021). This demonstrates the high interest of investors to invest and diversify their portfolios in Islamic unit trust funds, especially under Covid-19 outbreak.
Past research has shown that Islamic unit trust funds are viable alternatives to conventional investment options under uncertain market environments. Kassim and Kamil (Citation2012) indicated that most Islamic unit trusts or 72.73% had performed better than the market during the sub-period crisis under the adjusted-Jensen Alpha (AJI) in comparison to the adjusted-Sharpe Index (ASI) which recorded a mere 15.15%, whilst indicated a significant difference in returns between Islamic and conventional funds during the 2008–2009 global financial crisis based on the ASI and AJI ratios. Islamic equity funds demonstrated better risk management than conventional funds owing to the greater risk-averse investment asset classes. Hence, it can be concluded that as opposed to conventional funds, Islamic unit trusts significantly declined return loss risks and moderately provide better performance under uncertain economic conditions (Abdullah et al., Citation2007; Alam et al., Citation2016; Kassim & Kamil, Citation2012; Omri et al., Citation2019). Thus, most recent studies argued that Islamic unit trusts characterized to be (i) safe-haven properties (ii) lower risk (iii) income cleansing based on Sharia-compliant (iv) more resilient (v) lower drawdown by investors as well as faster recovery during an economic downturn caused by financial crisis 2008 and the Covid-19 pandemic (Chowdhury et al., Citation2021; Hassan, Chowdhury et al., Citation2021; International Monetary Fund, Citation2021; Merdad et al., Citation2010; Mirza et al., Citation2022; Al Rahahleh & Bhatti, Citation2022).
Based on this scenario, this study aims to investigate the performance of the two forms of Islamic financial instruments unit trusts, namely Islamic equity and fixed-income unit trust funds in Malaysia during the Covid-19 pandemic. Equity-based unit trusts are closed-end investment funds in public stocks while fixed-income-based unit trusts (government and corporate bonds) are investment securities that give fixed interest payouts or dividend payments up until the maturity date. Earlier studies had focused on the comparison between Islamic and conventional unit trust, where the findings differentiated conventional unit trust generalized as (i) underperform and (ii) shock absorbers compared to Islamic unit trust under uncertain economic condition (Abdullah et al., Citation2007; Alam et al., Citation2016; Al-Khazali et al., Citation2014). Therefore, this study focuses only on Islamic unit trust equity and fixed income as suggested by Mirza et al. (Citation2022) in their limitation of study. Despite the financial instrument’s feature concentration, most previous studies concentrated on three-sub samples i.e. before, during and after the recent global financial crisis, whilst in this study, specifically concentrate on the Covid-19 pandemic outbreak era. The health outbreak crisis immobilized global economics, financial markets dynamism and businesses synergy around the globe as indicated by the significant decline of −4.5% GDP in global growth (Chowdhury et al., Citation2021; Hassan, Chowdhury et al., Citation2021; International Monetary Fund, Citation2021; Mirza et al., Citation2022; Al Rahahleh & Bhatti, Citation2022). Additionally, this study offers various analysis insights including (i) in-depth performance review on Islamic unit trusts using systematic literature review, and (ii) empirical analysis using conventional methodologies such as Sharpe, Treynor and Jensen to compare the 2019 and 2020 performance of Islamic fixed-income and Islamic equity unit trust funds in Malaysia.
1.1. Systematic literature review
The systematic literature review (SLR) is designed to perform extensive database searches (Müller et al., Citation2020). Lagorio and Pinto (Citation2020) delineated SLR studies as those that frame questions, classify relevant studies and appraise their quality, and recapitulate the obtained evidence using a specific methodology. Thorough protocols have been established to structure the SLR, and PRISMA is used to retrieve relevant articles from Scopus and ScienceDirect. These protocols complementing process of the systematic review, acknowledge of the eligibility and exclusion criteria, carried out the review procedure (i.e. identification, screening, eligibility), and perform data abstraction and analysis.
1.2. Prisma
This review is conducted based on the PRISMA Statement (Preferred Reporting Items for Systematic Reviews and Meta-Analyses). PRISMA is commonly employed in social science studies. Petticrew and Roberts (Citation2008) and Dezi et al. (Citation2018) listed three distinctive benefits of this method: 1) it defines research questions clearly thus allowing for systematic research, 2) it identifies the inclusion and exclusion criteria, and 3) it examines large scientific databases in a well-defined timeline as suggested by Shaffril et al. (Citation2018), Z. S. Li and Hasson (Citation2020), and Ishak et al. (Citation2021).
1.2.1. Research question
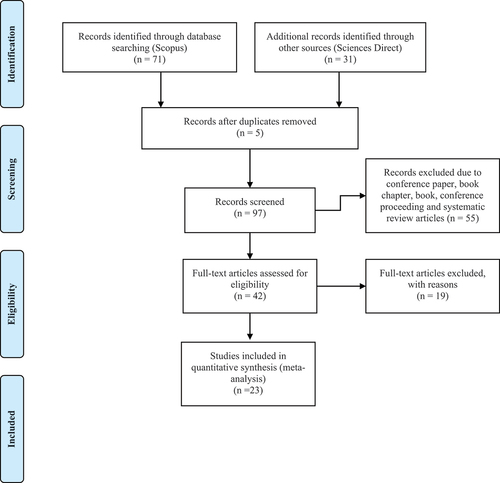
This paper analyzes relevant studies that had identified the role of Islamic equity or fixed-income-based unit trust funds in establishing shareholder wealth value creation. Thus, the research question guides the literature search: Does Islamic equity or fixed-income unit trust funds result in value creation performance (Sharpe, Jensen and Treynor) within the period of global Covid-19 crisis? Past studies are scoped via PRISMA to answer the research question (see, Figure ).
Figure 1. The flow diagram of the study adopted by the PRISMA Group (Moher et al., Citation2009).
1.2.2. Eligibility and exclusion criteria
A number of eligibility and exclusion criteria had been established. In terms of literature type, only empirical journal articles are chosen. This means that this study excludes all review articles, book series, books, book chapters, editorials, notes, and conference proceedings. Next, only articles in the English language are chosen to avoid issues with translation. Finally, timeline-wise as per Table , only articles published between 2007 and 2022 (15 years) are chosen so as to maintain the relevancy of the studies.
Table 1. The inclusion and exclusion criteria
1.3. Resources
Scopus and ScienceDirect are the two journal databases used in this study. ScienceDirect offers 1.2 million open-access articles entailing 24 disciplines including Business, Management and Accounting, Economics, Econometrics and Finance. Scopus on the other hand offers a wide range of abstracts and citation databases of peer-reviewed literatures, boasting over 22,800 journals from 5000 publishers globally. Scopus covers 27 multidisciplinary fields including Economics, Econometrics and Finance. The journals that discuss the current research topic are presented together with those that frequently mention the topic. Firstly, the journals in which the papers are published are identified. A total of 40 journals were identified to have discussed this topic. Table shows that the journal with the highest number of publications is Journal of Islamic Accounting and Business Research with seven papers (14.00%). This is followed by The International Journal of Islamic and Middle Eastern Finance and Management, The International Journal of Managerial Finance, and Pacific Basin Finance Journal each with three papers (6.00%). Next, The International Journal of Business and Society, Journal of International Financial Markets, Institutions and Money, Managerial Finance and Review of Financial Economics each have two papers. The remaining 24 journals each have one paper (2.00%).
Table 2. List of journals examined
1.3.1. Systematic review searching process
There are four stages in the systematic review process conducted in May 2021. Firstly, the search process entails the identification of keywords such as “performance”, “Covid-19”, “mutual-fund”, and “Islamic”. Following thorough screening, a total of four duplicate articles are omitted. Next, the screening process is carried out whereby out of the 93 eligible articles, 50 are omitted. The third step entails accessing the 39 articles in full. Following thorough examination, 16 articles are removed as 10 of them are not focused on Islamic mutual fund performance and the other 6 only concentrated on qualitative research papers (concept/systematic). The final step entails the analysis of the resulting 23 empirical quantitative articles derived. Table shows that 10 papers employed the empirical qualitative method (case study/multiple case study), another 23 used the empirical quantitative method, and only 6 used the concept and systematic literature review method.
Table 3. Sample selection criteria
1.3.2. Performance of Islamic unit trust fund in various market
Derived from the selection pool of articles, 23 papers empirically address the performance of Islamic unit trusts or mutual funds, however, 8 articles were excluded due to their unconventional methodologies (Sharpe, Treynor & Jensen). In a latest study by Mirza et al. (Citation2022) examined comparative performance between Islamic equity trust and conventional equity funds in six countries (Malaysia, Pakistan, Saudi Arabia, Qatar, Kuwait and the UAE) during Covid-19 outbreak. Using a pool of 476 Islamic equity trust and 591 conventional equity funds we found that Islamic equity funds in all six countries demonstrated a significant positive adjusted Sharpe ratio, Sortino ratios and Jensen’s alpha. As for Islamic equity funds show that Malaysia has a maximum adjusted Sharpe ratio of 0.97 and Sortino (0.79) while Pakistan has the maximum alpha (0.06) at least at 5% level. Conventional equity funds however demonstrated significant negative returns for all performance except UAE, showing positive significance for an adjusted Sharpe ratio of 0.14, Sortino ratio of 0.10 as well as Jensen’s alpha across all funds. The premise lean on the outcome that Islamic equity funds across six countries outperformed their conventional counterparts. It is because Islamic funds are safe-haven, and more resilient during pandemic outbreaks whilst conventional funds struggle to sustain the COVID-19 pressure.
Kassim and Kamil (Citation2012) examined the performance of 33 equity-based Islamic unit trusts in Malaysia during the 2007 global financial crisis using the adjusted Sharpe index (ASI), adjusted Jensen Alpha index (AJI) and Treynor index (TI). The study focused on three sub-periods that reflect the changing economic or market environment, namely: January 2000 to December 2004 (non-crisis period), January 2005 to June 2007 (the up-market period), and July 2007 to December 2009 (during crisis period). The authors found that during the non-crisis period, 30% of the Islamic unit trusts had outperformed the market portfolio based on the TI and ASI, and only one Islamic unit trust or 10% had outperformed the market when measured under the AJI. This means that 23.33% of the Islamic unit trusts had outperformed the market during the normal period. Meanwhile, during the up-market period, all the Islamic unit trusts had outperformed the market portfolio as measured by the ASI, only 27.59% outperformed the market based on the TI, and none had outperformed the market based on the AJI. Overall, 42.53% of the Islamic unit trusts had outperformed the market during the up-market period. Finally, during the crisis period, 72.73% of the Islamic unit trusts had outperformed the market based on the AJI, and only 15.15% had outperformed the market when measured under the ASI. On average for all the sub-periods, 43.43% of the Islamic unit trusts had outperformed the market. The authors assert that the Islamic unit trusts are highly sensitive during the up-market period, but less so during the down-market period. The authors went on to suggest that during market uncertainties, Islamic unit trusts are viable alternatives to conventional investment.
Likewise, Abdullah et al. (Citation2007) employed the risk-adjusted return method to investigate the performance of Islamic and conventional equity-based funds in governmental and non-governmental funds over three periods i.e. pre-, during and post-economic crisis. Their findings revealed that, when measured under the ASI, AJI and TI, the Islamic funds reported positive average monthly returns during the crisis and post-crisis periods whilst the conventional funds reported negative average monthly returns. Based on the authors’ argument, Islamic funds have a lower degree of risk exposure than conventional funds because the former disengage from investments that involve usury, gambling or ambiguous elements; hence, Islamic funds generally have minimal risks. Islamic funds are fairly less volatile during economic crises thus enabling them to attain better returns during bearish conditions. Meanwhile, governmental funds were found to outperform the non-governmental funds in the pre-crisis period; however, there were insignificant differences between the two during and after the crisis period. This can be justified by the “special governmental attention” given to lessen political risks and to ensure equal market competition among all governmental and non-governmental conventional funds.
Also, in the context of Malaysia, Alam et al. (Citation2016) studied the performance of conventional and Islamic unit trusts for the period between February 1995 and July 2012. The authors used two types of analysis, namely (i) risk-adjusted returns, and (ii) market timing abilities. Under the conventional method, the findings revealed that the conventional and Islamic unit trusts have positive alpha (α) and are statistically significant. This means that the actual performance of both types of unit trusts approximate their expected performance. Based on the market timing abilities as measured by Treynor, during the sub-prime crisis, the positive value of β found in conventional unit trusts indicates the higher sensitivity of portfolio excess returns against positive market excess returns as compared to negative market excess returns. Meanwhile, the Islamic unit trusts recorded a negative value of β, suggesting greater resistance during market downturn. The authors assert that Islamic mutual funds provide good hedging during economic downturns and drive long-term market stability.
Hassan et al. (Citation2010) compared the performance of equity-based non-Islamic unit trusts against Islamic unit trusts in Malaysia for the period between January 1996 and November 2005. Under the conventional method using the Sharpe ratio, their findings revealed that the non-Islamic funds (−0.6196) had outperformed the Islamic funds (−0.8034). Meanwhile, under the Treynor ratio, the non-Islamic funds (−0.1159) were found to underperform compared to the Islamic funds (−0.0151). The authors justified this by stating that Islamic unit trust funds are oriented on small caps whilst non-Islamic funds are oriented on large caps with a value-focused growth. The differing results were also justified as the outcome of measuring risk using two different ratios (Treynor uses systematic risks, β, while Sharpe uses total risks, σ). The alpha value showed that both funds are averagely underperforming. In a separate analysis, a 5% statistical significance was found in the long-term relationship between the Islamic and non-Islamic unit trust funds in Malaysia.
Boo et al. (Citation2017) compared the performance of Islamic and conventional equity-based mutual funds in Malaysia during crisis and non-crisis periods, i.e. between 1996 and 2013. The study focused on three different events of financial crises namely the East Asian Financial (EAF) crisis from December 1997 to November 1998, the “tech bubble” crisis from February 2001 to February 2002, and the global financial crisis (GFC) from February 2008 to March 2009. The findings revealed a significant difference in the returns of the Islamic and conventional funds during the GFC as measured by the Sharpe and Jensen ratios. The authors justified this by stating that the Islamic equity funds demonstrated better performance due to better risk management in comparison to the conventional funds that adopt more risk-averse investment asset classes.
Kamil et al. (Citation2021) compared the diversification performance of Islamic and conventional equity mutual funds in Malaysia; the study involved 50 Islamic funds and 78 conventional funds over the period between 1992 and 2016. Based on the Sharpe and Jensen ratios, the conventional funds were found to have a statistically and significantly higher average investment performance than the Islamic funds. This was attributed to numerous factors including managerial capability (e.g., stock selection and market timing skills), the firm’s in-house research capabilities, management acumen, access to limited information or market intelligence, as well as fund size and age. Investors are recommended to invest in multiple mutual funds to prevent lossess on diversification benefits.
Omri et al. (Citation2019) conducted a comparative study investigating the risk-adjusted performance of Islamic and conventional equity-based mutual funds in Saudi Arabia during the 2009–2014 global financial crisis. The findings revealed that the Islamic funds generated higher excess returns and thus outperformed the conventional funds. The authors justify this by saying that the majority of Muslim investors in the Gulf region prefer to invest in Shari’ah-compliant stocks. Being Shari’ah compliant did not pose any negative effects on the Islamic funds’ performance or cause additional risks irrespective of the market and location. In general, Islamic funds in Saudi Arabia are highly competitive and able to generate substantial returns with reasonable risks.
Also, in the context of Saudi Arabia, Ashraf (Citation2013) compared the market timing capabilities of Islamic and conventional equity-based mutual funds. The study involved 159 mutual funds i.e. 43 conventional and 116 Islamic mutual funds listed on TAWADUL from 2007 to 2011. Based on the Treynor index, it was revealed that IMF managers generally do not have good market timing capabilities. Hence, the flow of funds to IMFs is more stable as compared to conventional funds. However, conventional fund managers demonstrated a significantly negative market timing capability coefficient that indicates that they would typically time the market when the market returns are low. The authors also suggest that on average, the IMFs had performed better than the conventional funds during the economic crisis.
Similarly, Merdad et al. (Citation2010) compared the performance of Islamic and conventional mutual funds in Saudi Arabia from January 2003 to January 2010 covering four period segments, namely: full period, bullish period, bearish period and financial crisis. The findings revealed that the conventional funds (2.85%, 108.17%) had outperformed the Islamic funds (0.18%, 53.51%) during the bullish period. However, the Islamic funds had performed better during the bearish and financial crisis periods; although all the returns were negative, the Islamic fund portfolio was less negative than the conventional portfolio. Under the Treynor index measurement, the Islamic funds also recorded less lossess (1.64%, 1.58%) than the conventional funds (1.83%, 1.59%) during the bearish period. The authors went on to suggest that investors can include Islamic funds in their portfolio during bearish or crisis periods to hedge the downside risk in such adverse economic conditions.
In the context of Pakistan, Shaikh et al. (Citation2019) also compared the performance of Islamic and conventional income and equity funds covering the period from 2006 to 2016. The findings revealed a higher average annualized return for the Islamic equity funds (17.5%) as compared to the conventional funds (15.6%) against the market benchmarks. Additionally, a majority of the Islamic equity funds demonstrated positive Sharpe and Treynor ratios. According to the authors, Islamic equity funds are marginally less risky with a lower average standard deviation, variation coefficient and tracking error. Nonetheless, the Islamic income funds showed greater market underperformance (8.4%) than the conventional income funds (9.5%) as they have less Shari’ah compliant investment class assets and because of the prohibition to invest in interest-based money market instruments, derivatives and high return yielding treasury bills. The authors suggested that Islamic portfolios are good investment options due to their adequate selection and market timing capability; it would be more beneficial to pay their investment management fees instead of investing in passive portfolios.
Castro et al. (Citation2020) compared the performance of three main US-constrained assets, namely: Christian-based mutual funds, Islamic mutual funds and socially responsible investing funds (SRI). The study involved 165 Christian-based funds, 153 socially responsible funds (SRI), and 11 Islamic funds covering the period from 2005 to 2015. SRI funds are defined as funds that engage in societal improvements including community investment, human rights and labor issues. Meanwhile, Christian-based mutual funds cover Protestants, Catholics and Lutherans as well as adult service sectors including alcohol distilleries, gaming, and defense services amongst others (sin industry). Under the conventional method using the Sharpe ratio, the findings revealed the performance of the three funds i.e. Islamic funds with 11.98%, Christian funds (6.85%) and SRI funds (6.17%). Despite outperforming the Christian and SRI funds, the results for the Islamic funds are not statistically significant owing to the extremely large volatility and small data sample. The Christian and SRI funds are each statistically significant at 5%. Under the Jensen ratio, the Islamic funds and SRIs constantly recorded an underperformance against the Christian funds; the authors justify this by saying that sin industries always outperform religious and ethically based funds.
Another study in the context of the US market by Jawadi et al. (Citation2014) compared the performance of Islamic and conventional equity-based mutual funds covering the period between January 2000 and June 2011. The authors defined Islamic mutual funds as those that only engage in “halal” and Sha’riah-compliant business activities. The study employed the conventional methods of Sharpe, Treynor and Jensen index measurements to analyze the risks and returns of both funds. Under the Treynor index, the Dow Jones Islamic funds demonstrated an underperformance against the conventional funds. The authors justified this by saying that the excess returns provided by the conventional funds had attracted more investors. Therefore, the rising demand for conventional funds implies an increase in liquidity and high financial performance. Under the Sharpe index, both funds demonstrated an insignificant overperformance against the market. Interestingly, Jensen’s Alpha analysis revealed that the Islamic funds showed positive and significant overperformance during the 2008–2009 global financial crisis. The Islamic funds demonstrated better resistance against the financial crisis in comparison to the conventional funds due to their moral and ethical standing which had attracted more investors.
Ho et al. (Citation2014) studied the risk-adjusted performance of Islamic and conventional equity-based mutual funds listed on the Dow Jones Index, Kuala Lumpur Index and Swiss Index. The study period entailed the Dotcom boom (2000–20,002) and the global financial crisis (2008–2009). During the Dotcom crisis, the Dow Jones Islamic Index demonstrated an overperformance based on the Treynor and Jensen ratios, whilst the Kuala Lumpur Islamic Index demonstrated an overperformance based on the Sharpe ratio. According to the authors, the Islamic funds’ returns were less affected than the conventional funds although both recorded a negative performance. Meanwhile, during the global financial crisis, both funds recorded negative returns but the Islamic funds still outperformed their conventional counterparts. Based on the measurements of the Sharpe, Treynor and Jensen ratios, the Islamic Dow Jones, MSCI, FTSE, Royal Bank of Scotland, and Kuala Lumpur Index had demonstrated an overperformance against the conventional funds. The study concluded that a majority of the Islamic equity-based funds provide better hedging during periods of economic turbulence.
Finally, Al-Khazali et al. (Citation2014) compared the performance of Islamic stock indexes against conventional stock indexes during three distinctive periods, namely: the Asian financial crisis (1996–2000), the pre-financial crisis (2001–2006), and the global financial crisis (2007–2012). The study employed nine Islamic indexes and another nine conventional indexes from the Asia Pacific, Canada, Developed Countries, Emerging Markets, Europe, Global, Japan, UK and the US. The findings revealed that the Sharpe ratio for the Islamic indexes is higher for Asia Pacific, Developed Countries, Emerging Markets, Europe, Global, Japan and the US throughout the entire study period (1996–2012). During the Asian financial crisis (1996–2000), all the Islamic indexes demonstrated a high performance except for Canada. During the pre-financial crisis (2001–2006), the conventional indexes recorded a higher global performance than the Islamic indexes. Remarkably, during the global financial crisis (2007–2012), the Sharpe ratio revealed that the Islamic indexes had demonstrated a better performance in the Asia Pacific, Developed Countries, Europe, Global, Japan, the UK and the US. Meanwhile, the Treynor and Jensen ratios revealed a similar performance between the Islamic and conventional indexes throughout the entire study period and globally. As the Islamic indexes had outperformed the conventional indexes during the global financial crisis, the authors concluded that investing in Islamic funds is more advantageous during economic recessions.
1.4. Summary of literature gap
The empirical evidences used in this study derived from performance of Islamic unit trust in selective countries namely Malaysia, the United State, Saudi Arabia and Pakistan. Data pooled from previous studies linked to performance of Islamic equity instruments and conventional equity unit trust during turbulent and economics uncertainty, such as financial crisis in the year 2008 to 2009 captured in the works of Kassim and Kamil (Citation2012); East Asian Financial (EAF) in Boo et al. (Citation2017); and case of Covid-19 outbreak in Mirza et al. (Citation2022). Moreover, previous studies applied conventional methodologies such as Sharpe, Treynor & Jensen in examining performance of unit trust equity funds whilst lack of study focused on fixed-income (Kamil et al., Citation2021; Mirza et al., Citation2022; Omri et al., Citation2019). Therefore, this study aims specifically filling the gap with an inclusion of two dominant Islamic financial instruments in Malaysia, namely Islamic equity unit trust and fixed-income. The findings from previous studies show that Islamic equity unit trust outperform conventional equity unit trust funds during uncertain economic conditions.
2. Methodology
2.1. Sample selection
Sample derived from Thomson DataStream and Bloomberg Terminal selection based on numerous categories such the daily net asset value data and information about Islamic equity and Islamic fixed-income unit trust funds. By utilizing Thomson DataStream daily KLCI data as market return proxy and weekly 90-day Malaysian Treasury Bills denoting the risk-free rate. Data gathers from the 37 asset management companies’ prospectuses and websites, specifically information on Shariah-compliant funds listed in Malaysia from July 2019 to July 2020 covering the Covid-19 period following the latest previous studies of Sherif (Citation2020), Hassan, Rabbani et al. (Citation2021). The data selection period allows this study to capture the performance analysis during the pandemic periods.
Initially, 20 out of the 138 Islamic equity unit trust funds and all of the 54 Islamic fixed-income unit trust funds are included in this study due to their complete data covering the entire study period i.e. from July 2019 to July 2020. The sample selection also adhered to the following inclusion criteria: (i) the unit trust funds are not closed-ended; (ii) the funds are not recently launched, and (iii) there are no missing data. The criterion of being an open-ended unit trust fund is attributed to the preference of a majority of retail investors for such funds (N. Li & Lin, Citation2011). The outcomes would therefore directly affect individual investors. The exclusion of closed-ended funds is attributed to the fact that they are traded with a limited number of shares offered strictly via an initial public offering, and that they are quoted and publicly traded on Bursa Malaysia. Meanwhile, the exclusion of recently launched funds is due to their ineffectiveness in comparison to funds that have already been around for over 10 years. Since this study focuses on daily data, initial results indicated higher volatility in terms of performance analysis, which provide robustness check could not be implemented in this study following N. A. H. Abdullah and Shari (Citation2019).
The research objectives are achieved by calculating the samples’ returns and risks. Returns are calculated using three performance measures, namely, the Treynor (Citation1965), Sharpe (Citation1966), and Jensen (Citation1968) measures. In the analysis of 57 open-ended unit trust funds listed between 1953 and 1962, Treynor (Citation1965) found that investors depend on market index variability and that the fund managers did not outperform the market. The Treynor ratio utilizes a systematic risk component of the portfolio’s return measured by ) i.e. the beta coefficient. The ratio also measures the portfolio’s ability to obtain excess returns that have been adjusted for systematic risk. The Treynor ratio can be calculated as follows:
where
= average return on fund i
= average return on Malaysian 3-month Treasury Bills (the risk-free rate of return)
= Beta of the unit trust fund over the evaluation period or the slope of the fund’s characteristic line during the selected period (indicating the fund’s relative volatility)
Since the reported Treasury bill rate is an annualized holding period yield on a 3-month Treasury bill, this rate is converted to a weekly equivalent, consistent with the weekly returns of the unit trust funds and the market’s return. Essentially, the formula to compute the estimation of daily equivalents of the annualized yield is as a geometric mean.
Sharpe (Citation1966) recommended a composite measure for evaluating the performance of unit trust funds. On top of measuring the systematic risk ), the portfolio’s total risk expressed as the standard deviation of returns is also measured (Reilly & Brown, Citation2009). The Sharpe ratio’s standard deviation measures the total risk i.e. both systematic and unsystematic risks; the Treynor ratio only measures the systematic risk. The Sharpe ratio also measures the excess return per unit of risk, and a portfolio’s reward-to-risk ratio. A higher Sharpe ratio indicates that the unit trust fund has a better risk-adjusted performance. Hence, the ratio measures both returns and risk, delivering a single measure proportionate to the risk-adjusted returns. This ratio is beneficial for investors due to its ability to assess fund performance based on the existing amount of risk. Despite the ability of a fund to present superior returns, it is only acknowledged as a superior investment if the risks involved in generating those returns are low. A higher Sharpe ratio suggests that the fund has a better risk-adjusted performance. A negative Sharpe ratio suggests that an asset with lower risks would be a better alternative as compared to the analysed fund scheme. The formula to measure the Sharpe ratio is as follows:
where
= average return on fund i
= average return on Malaysian 3-month Treasury Bills
= standard deviation (total risk) of returns for fund
The average weekly returns of fund i () for Treynor and Sharpe are calculated based on the following formula:
where
= Return of fund i in period t
= Net Asset Value of fund i in period t
= Net Asset Value of fund i in period t-1
The performance measure introduced by Jensen (Citation1968) was developed using the capital asset pricing model (CAPM). The Treynor and Sharpe ratios only focus on providing comparative performance rankings (Reilly & Brown, Citation2009). The Jensen method on the other hand enables the correction of market risk, and measures the fund manager’s security selection skill, market timing skill or both. The results of the Jensen measurement are also easily understandable and interpretable. For instance, an alpha value (α) of 0.03 denotes a 3% return generation under the evaluation period. The equation below is used to measure the Jensen index:
where
= Excess return of portfolio i in period t
= Excess return of market portfolio proxied by KLCI index
= Jensen’s alpha to measure portfolio performance
= The systematic risk (beta) for Portfolio i
= The random error term
The value determines the superiority or inferiority of the portfolio manager in terms of market timing and/or stock selection to outperform the market. A significant and positive
suggests the superior performance of a fund due to consistent differences that enable the fund manager to outperform the market using its stock selection skills. Meanwhile, a significant and negative
suggests that the fund has inferior performance whereby its return is lower than the projection of the capital asset pricing model, thus resulting in consistently negative differences (Lai & Lau, Citation2010). A higher value suggests a better performance. The
value is significant for the retail investor as it assesses the excess returns generated by the fund in comparison to the established benchmark. The Treynor and Sharpe ratios calculate the average weekly risks for fund i using the formula presented below.
where
= The Standard deviation on portfolio i
= Return of a fund
= Mean Return of the fund
= Number of daily returns
In this current study, risk is measured using the standard deviation and beta values. As previously mentioned, standard deviation measures the fund’s total risks. The slope coefficient in the regression of the fund’s return rate is used to calculate the systematic risk ). Similarly, it is calculated by dividing the covariance of the fund returns and the market returns by the standard deviation:
The research objective of comparing the performance between Islamic fixed-income unit trust funds and equity unit trust funds is achieved by conducting the Wilcoxon signed-rank test on : The risk-adjusted performance of Islamic fixed-income unit trust funds is the same as the performance of Islamic equity unit trust funds,
: The risk-adjusted performance of Islamic fixed-income unit trust funds is the same as the performance of the market benchmark, and
: The risk-adjusted performance of Islamic equity unit trust funds is the same as the performance of the market benchmark. The aforementioned test is used due to the abnormal distribution of the sample.
2.2. Analysis and findings
Table presents the return, risk and ranking of the Islamic equity unit trust funds’ performance measures in descending order based on the Sharpe ratio (as shown in the top 20 fixed income unit trust funds and equity unit trust funds in Table and Table . Tables with the full sample unit trust funds are available upon request). The KLCI is used as the market index for both the Islamic equity and fixed-income unit trust funds. The standard deviations of both funds ranged between 0.0118% and 6.0550% in comparison to KLCI’s standard deviation, i.e. 1.0452%. Meanwhile, the standard deviations for all the funds’ daily returns are lower than that of KLCI. Takaful Dana Ekuiti Dinas recorded the highest daily standard deviation, i.e. 6.0550%. Amprecious Metal recorded the most superior mean return with an average daily return of 0.1798% compared to that of KLCI i.e. −0.0254%. All the funds recorded betas that are lower than that of KLCI benchmarked at 1.0. The average beta value is −0.0549, approximating zero. This means that market return fluctuations pose a very low effect on the prices of the Islamic equity unit trust funds.
Table 4. Top 20 daily performance measures for Islamic equity unit trust funds: July 2019—July 2020
Table 5. Top 20 daily performance measures for islamic fixed income unit trust funds: July 2019—July 2020
The Malaysian 90-day Treasury Bills have higher average returns than KLCI. The higher return is in line with its standard deviation and β or systematic risk i.e. 0.0013 and—0.0001, respectively.
The Treynor measures indicate that 32 out of the 138 funds outperform the KLCI index by −0.0003. Affin Hwang AII PRS Shariah Growth recorded the highest Treynor measure at 0.4222. Meanwhile, the Sharpe measures indicate that 129 out of the 138 funds outperform the market index by −0.0315. Interpacific Dana Safi recorded the highest Sharpe measure at 0.1269. As many as 112 Islamic equity unit trust funds recorded Jensen’s alphas above the KLCI benchmark; the remaining 26 funds recorded Jensen measures between −0.0001 and −0.0008.
In terms of the Jensen measures, two out of the 138 Islamic equity unit trust funds recorded positive alphas with significant differences at a confidence level of 99%, 95% and 90%. The positive alphas point out that these two funds are the only ones that had outperformed the KLCI. Approximately two-thirds out of the total Islamic equity unit trust funds demonstrated a statistically insignificant but positive alpha, indicating that these funds offer similar risk adjusted returns to that of KLCI. A total of 26 Islamic equity unit trust funds recorded a statistically significant but negative alpha value for the Jensen performance measure.
The performance ranking of the Islamic fixed-income unit trust funds utilized in this study is presented in Table in descending order based on the Sharpe ratio. TA Dana Principal Preservation Robotic Theme recorded the most superior mean return, i.e. 0.0441% in average daily returns. The Islamic equity unit trust funds recorded an average daily return of 0.0153%. Meanwhile, the KLCI benchmark’s average daily return is −0.0254%. A total of 49 out of the 54 funds recorded higher returns than that of the KLCI, indicating that the Islamic equity unit trust funds have a similar performance to KLCI. The Islamic equity unit trust funds also recorded greater standard deviations compared to the Islamic fixed-income unit trust funds. The Islamic fixed-income unit trust funds have standard deviations that are lower than 1%, indicating that they have lower total risk and market risk. Additionally, the Islamic fixed-income unit trust funds have average beta values that are lower than the benchmark of 1.0; meanwhile, their standard deviations are within the range of 0.0480% to 1.1193% with the highest value recorded by TA Dana Global 50 Fund Equity. Furthermore, TA Dana Global 50 Fund recorded a 0.0042% return that is higher than the mean benchmark of −0.0254%. KLCI is outperformed by two-thirds of the funds’ average returns.
The Malaysian 90-day Treasury Bill recorded lower standard deviations than that of KLCI and the average standard deviations of 54 Islamic equity funds, which is also recorded in its beta values. The Treasury bills recorded higher mean returns compared to the KLCI. Meanwhile, 25 out of the 54 Islamic fixed-income unit trust funds recorded a Treynor index value of −0.0051 which is higher than that of the KLCI market index. A total of 48 out of the 54 Islamic fixed-income unit trust funds also recorded higher Sharpe values than that of the market return. The Principal Islamic Institutional Sukuk fund reported the highest Sharpe value, i.e. 0.1653% in comparison to that of the market index, i.e. −0.0315. The funds reported Jensen’s alpha values ranging between −0.0014 and 0.0003. A mere 11 out of the 54 Islamic fixed-income unit trust funds had shown significant outperformance over the market benchmark. Five-unit trust funds, namely, AmAL-Amin Fund, AmPRS, Al-Fakhim Fund, Kenanga I-Echanced Cash Fund and Kenanga Sukuk Wholesale Fund showed significantly negative alpha performance as compared to another six which showed positive and statistically significant performance. The rest of the Islamic fixed-income unit trust funds showed non-significant alpha performance, suggesting that the risk-adjusted returns provided by these trust funds are similar to that of the KLCI index.
Based on Figure , there is an uneven distribution of the risk adjusted returns for the Treynor, Sharpe and Jensen performance measures. Due to this, the Wilcoxon Signed Ranks test is carried out. It was found that the performance of the fixed-income and equity unit trust funds is insignificant at a 5% level for the Sharpe and Jensen performance measures. This finding is in line with that of NA Abdullah and Abdullah (Citation2009) who also found non-significant differences in the performance of the domestic and international unit trust funds when the Sharpe and Jensen performance measures are used.
Figure 2. Distribution of risk adjusted returns.

The results derived in this study are inconsistent. This study yields conflicting results. The Islamic equity unit trust funds’ returns are found to be outperformed the KLCI benchmark index, but the Islamic fixed-income unit trust funds’ returns recorded an underperformance against the same benchmark. Additionally, the Islamic equity unit trust funds demonstrated a more superior performance than the Islamic fixed-income unit trust funds in the aspect of risk and return analysis. Similarly, the Islamic equity unit trust funds also demonstrated higher mean returns and standard deviation than the Islamic fixed-income unit trust funds. These findings are consistent with that of, Ho et al. (Citation2014), and Boo et al. (Citation2017). Therefore, investment in Islamic equity unit trust funds could be beneficial to all types of investors as noted by Mirza et al. (Citation2022). The results indeed in accordance with previous findings from Mirza et al. (Citation2022); Al Rahahleh and Bhatti (Citation2022) associated with the fund’s performance analysis during Covid-19 pandemic. This is where Islamic unit trust funds outperform fixed income unit trust funds even though during the Covid-19 pandemic.
3. Summary and conclusion
The study indicated that the Islamic equity unit trust funds performed better than the Islamic fixed-income unit trust funds as the former had mostly outperformed the established benchmark. As articles reviews exhibited promising outcomes in Islamic equity and fixed-income unit trust funds using the Sharpe, Treynor and Jensen performance measures.
In term of risk-wise, the Islamic equity unit trust funds demonstrated higher standard deviations than the Islamic fixed-income unit trust funds as presented in Tables . The standard deviation between both the unit trust funds is found to be widely varied. Additionally, the Islamic fixed-income unit trust funds are found to have lower total risk and market risk in comparison to the Islamic equity unit trust funds. The outcome unsurprising because the assets in this group are less risky. Next, there are less outperformed Islamic equity unit trust funds as compared to outperformed Islamic fixed-income unit trust funds based on the Jensen’s Alpha measure. This means that generally, Islamic equity unit trust funds perform better than Islamic fixed-income funds as indicated by the Sharpe performance measurement.
Overall, this study outlined significant indicators regards to Islamic unit trust funds demonstrated good performance as both had outperformed the established benchmark at the back of the Covid-19 pandemic. The practical implication, investors would profit from investing in Islamic mutual or unit trust funds as they offer good hedging for long-run investment particularly in environments of economic decline. Second, risk-averting investors may benefit from investing in the diversified portfolios of Islamic equity funds as they have been proven to perform marginally better portfolios than conventional funds owing to better risk management.
Another interesting outcome is that Islamic mutual or unit trust fund indexes perform better in such an environment as compared to conventional indexes due to their moral and ethical features. Future studies may examine unit trust funds especially and wholesale funds from a new standpoint; for instance, they may investigate the features of fixed-income-based unit trusts, such government and corporate bonds with commercial and social goals and as a mechanism for promoting environmental, social and governance (ESG) considerations towards establishing a low-carbon economy.
Acknowledgements
We would like to thank our colleagues who provided insight and expertise that greatly assisted the research and publication. This study was fully supported by Universiti Malaysia Sabah research grant (SBK0458-2021)
Disclosure statement
No potential conflict of interest was reported by the author(s).
Additional information
Funding
References
- Abdullah, N. A., & Abdullah, H. (2009). The performance of Malaysian unit trusts investing in domestic versus international markets. Asian Academy of Management Journal of Accounting and Finance, 5(2), 77–19. http://web.usm.my/journal/aamjaf/5-2-4-2009.html
- Abdullah, F., Hassan, T., & Mohamad, S. (2007). Investigation of performance of Malaysian Islamic unit trust funds: Comparison with conventional unit trust funds. Managerial Finance, 33(2), 142–153. https://doi.org/10.1108/03074350710715854
- Abdullah, N. A. H., & Shari, A. (2019). A comparative analysis of fixed income unit trust funds versus equity unit trust funds in Malaysia. Asian Academy of Management Journal of Accounting & Finance, 15(2), 95–117. https://doi.org/10.21315/aamjaf2019.15.2.5
- Alam, N., Tang, K. B., & Rajjaque, M. S. (2016). Acomparative performance of conventional and Islamic unit trusts: Market timing and persistence evidence. Journal of Financial Services Marketing,18, 316–326. https://doi.org/10.1057/fsm.2013.24
- Al-Khazali, O., Lean, H. H., & Samet, A. (2014). Do Islamic stock indexes outperform conventional stock indexes? A stochastic dominance approach. Pacific Basin Finance Journal, 28(C), 29–46. https://doi.org/10.1016/j.pacfin.2013.09.003
- Al Rahahleh, N., & Bhatti, I. (2022). Empirical comparison of Shariah-compliant vs conventional mutual fund performance. International Journal of Emerging Markets. https://doi.org/10.1108/IJOEM-05-2020-0565
- Ashraf, D. (2013). Performance evaluation of Islamic mutual funds relative to conventional funds: Empirical evidence from Saudi Arabia. International Journal of Islamic and Middle Eastern Finance and Management, 6(2), 105–121. https://doi.org/10.1108/17538391311329815
- Bank Negara (2018). Islamic funds: Gearing UP. http://www.mifc.com/
- Boo, Y. L., Ee, M. S., Li, B., & Rashid, M. (2017). Islamic or conventional mutual funds: Who has the upper hand? Evidence from Malaysia. Pacific-Basin Finance Journal, 42(April), 183–192. https://doi.org/10.1016/j.pacfin.2016.01.004
- Castro, E., Hassan, M. K., Rubio, J. F., & Halim, Z. A. (2020). Relative performance of religious and ethical investment funds. Journal of Islamic Accounting and Business Research, 11(6), 1227–1244. https://doi.org/10.1108/JIABR-04-2019-0084
- Chowdhury, M. I. H., Balli, F., & de Bruin, A. (2021). Islamic equity markets versus their conventional counterparts in the COVID‐19 age: Reaction, resilience, and recovery. International Review of Finance. 22(2), 315–324. https://doi.org/10.1111/irfi.12349
- Dezi, L., Battisti, E., Ferraris, A., & Papa, A. (2018). The link between mergers and acquisitions and innovation: A systematic literature review. Management Research Review, 41(6), 716–752. https://doi.org/10.1108/MRR-07-2017-0213
- Hassan, M. K., Chowdhury, M. I. H., Balli, F., & Hasan, R. (2021). A note on COVID-19 instigated maximum drawdown in Islamic markets versus conventional counterparts. Finance Research Letters, 46(Part B). https://doi.org/10.1016/j.frl.2021.102426
- Hassan, M. K., Khan, A. N. F., & Ngow, T. (2010). Is faith‐based investing rewarding? The case for Malaysian Islamic unit trust funds. Journal of Islamic Accounting and Business Research, 1(2), 148–171. http://dx.doi.org/10.1108/17590811011086732
- Hassan, M. K., Rabbani, M. R., & Abdulla, Y. (2021). Socioeconomic Impact of COVID-19 in MENA region and the role of Islamic finance. International Journal of Islamic Economics and Finance (IJIEF), 4(1), 51–78. https://doi.org/10.18196/ijief.v4i1.10466
- Ho, C. S. F., Abd Rahman, N. A., Yusuf, N. H. M., & Zamzamin, Z. (2014). Performance of global Islamic versus conventional share indices: International evidence. Pacific Basin Finance Journal, 28(C), 110–121. https://doi.org/10.1016/j.pacfin.2013.09.002
- IFSB. (2021). Islamic financial services industry stability report, 2021. IslamicFinancial services board. https://www.ifsb.org/sec03.php
- International Monetary Fund (2021). Temporary extension and modifications of access limits in the fund’s lending facilities. IMF 2020 https://www.imf.org/en/home
- Ishak, N., Shahar, H. K., & Chee Jiun, R. C. (2021). Cyclical industries’ stock performance reaction during COVID-19: A systematic literature review. Jurnal Ekonomi Malaysia, 55(1), 147–158. http://dx.doi.org/10.17576/JEM-2021-5501-11
- Jawadi, F., Jawadi, N., & Louhichi, W. (2014). Does Islamic finance outperform conventional finance? Further evidence from the recent financial crisis. Ipag Business School, Working Paper, 1–20.
- Jensen, M. C. (1968). The performance of mutual funds in the period 1945–1964. Journal of Finance, 48(1), 389–416. https://doi.org/10.1111/j.1540-6261.1968.tb00815.x
- Kamil, N. K. M., Bacha, O. I., & Masih, M. (2021). Is there a diversification “cost” of Shari’ah compliance? Empirical evidence from Malaysian equities. Economic Systems, 45(1), 100817. https://doi.org/10.1016/j.ecosys.2020.100817
- Kassim, S. H., & Kamil, S. (2012). Performance of Islamic unit trusts during the 2007 global financial crisis: Evidence from Malaysia. Asian Academy of Management Journal, 17(2), 59–78. http://web.usm.my/aamj/17-2-2012.html
- Lagorio, A., & Pinto, R. (2020). Food and grocery retail logistics issues: A systematic literature review. Research in Transportation Economics, 87(C), https://doi.org/10.1016/j.retrec.2020.100841
- Lai, M. M., & Lau, S. H. (2010). Evaluating mutual fund performance in an emerging Asian economy: The Malaysian experience. Journal of Asian Economics, 21(4), 378–390. https://doi.org/10.1016/j.asieco.2010.03.001
- Li, Z. S., & Hasson, F. (2020). Resilience, stress, and psychological well-being in nursing students: A systematic review. Nurse Education Today, 90(July), 104440. https://doi.org/10.1016/j.nedt.2020.104440
- Li, N., & Lin, C. Y. (2011). Understanding emerging market equity mutual funds: The case of China. Financial Service Review, 20(1), 1–19. link.gale.com/apps/doc/A262884419/AONE?u=googlescholar&sid=bookmark-AONE&xid=17794efe
- Markowitz, H. (1952). Portfolio Selection. The Journal of Finance, 7(1), 77–91. https://doi.org/10.2307/2975974
- Merdad, H., Hassan, M. K., & Alhenawi, Y. (2010). Islamic versus conventional mutual funds performance in Saudi Arabia: A case study. Journal of King Abdulaziz University: Islamic Economics, 23(2), 157–193 https://iei.kau.edu.sa/Files/121/Researches/58939_29217.pdf.
- Mirza, N., Rizvi, S. K. A., Saba, I., Naqvi, B., & Yarovaya, L. (2022). The resilience of Islamic equity funds during COVID-19: Evidence from risk adjusted performance, investment styles and volatility timing. International Review of Economics & Finance, 77(C), 276–295. https://doi.org/10.1016/j.iref.2021.09.019
- Moher, D., Liberati, A., Tetzlaff, J., & Altman, D. G., & The PRISMA Group. (2009). Perrefered reporting items for systematic review and meta-analyses: The PRISMA statement. Plos Med, 6(7), e1000097. https://doi.org/10.1371/journal.pmed.1000097
- Müller, F., Denk, A., Lubaway, E., Sälzer, C., Kozina, A., Perše, T. V., Perše, T. V., Rasmusson, M., Jugović, I., Nielsen, B. L., Rozman, M., Ojsteršek, A., & Jurko, S. (2020). Assessing social, emotional, and intercultural competences of students and school staff: A systematic literature review. Educational Research Review, 29(February). https://doi.org/10.1016/j.edurev.2019.100304
- Omri, A., Soussou, K., Ben, N., & Goucha, S. (2019). On the post-financial crisis performance of Islamic mutual funds: The case of Riyad funds. Applied Economics, 51(18), 1929–1946. https://doi.org/10.1080/00036846.2018.1529403
- Petticrew, M., & Roberts, H. (2008). Systematic Reviews in the Social Sciences: A Practical Guide. Blackwell Publishing.
- Reilly, F. K., & Brown, K. C. (2009). Analysis of investment and management of portfolios (9th ed.). Thomson-South Western.
- Securities Commission. (2020). 2020 In Review-Driving Sustainability. Quarterly Bulletin of Malaysian Islamic Capital Market, 15(2), 1–24. https://www.sc.com.my/api/documentms/download.ashx?id=2ba56424-f22d-4d52-95d4-9340c86c289f
- Shaffril, H. A. M., Krauss, S. E., & Samsuddin, S. F. (2018). A systematic review on Asian’s farmers’ adaptation practices towards climate change. Science of the Total Environment, 644(December), 683–695. https://doi.org/10.1016/j.scitotenv.2018.06.349
- Shaikh, S. A., Ismail, M. A., Ismail, A. G., Shahimi, S., & Shafiai, M. H. M. (2019). Comparative analysis of Shari’ah -compliant portfolios: Evidence from Pakistan. Journal of Islamic Accounting and Business Research, 10(3), 466–487. https://doi.org/10.1108/JIABR-10-2016-0121
- Sharpe, W. F. (1966). Mutual fund performance. Journal of Business, 39(S1), 119–138. https://doi.org/10.1086/294846
- Sherif, M. (2020). The impact of Coronavirus (COVID-19) outbreak on faith-based investments: An original analysis. Journal of Behavioural and Experimental Finance, 28(December), 100403. https://doi.org/10.1016/j.jbef.2020.100403
- Treynor, J. L. (1965). How to rate management of investment funds. Harvard Business Review, 44 (3), 63–75. https://doi.org/10.1002/9781119196679.ch10