
 ?Mathematical formulae have been encoded as MathML and are displayed in this HTML version using MathJax in order to improve their display. Uncheck the box to turn MathJax off. This feature requires Javascript. Click on a formula to zoom.
Abstract
While market volatility and volatility connectedness across different financial markets have been examined, the spillover effects across sectors have been under-examined. As such, this study aims to examine market volatility and the volatility patterns for 24 Vietnamese sectors. Our study uses the ARMA-GARCH estimation technique over the 2012–2021 period. The spillover effects between these sectors are then investigated using the vector autoregression (VAR) technique. Three key findings are as follows. First, the market volatility of Development Investment, Education, and Securities is most affected by the market volatility from the previous periods, whereas Construction is least affected. Second, the Vietnamese stock market exhibits a substantial inter-sector connectedness above 60 per cent from 2012 to 2021. However, the sectoral spillover effects increase to around 90 per cent during the Covid-19 pandemic. We found that Aquaculture, Building Materials, Food, and Plastic are the four primary risk transmitters at the sectoral level. Third, market volatility for Energy, Plastic, and Steel is unaffected by the pandemic. Meanwhile, Securities, Fertilizer, and Transportation exhibited a significant increase in market volatility during Covid-19. Based on these empirical results, policy implications have emerged for the Vietnamese government to support affected industries to recover and develop.
1. Introduction
Vietnam is classified as a developing nation. The Vietnamese economy is currently ranked 37th globally using the nominal gross domestic product (GDP) and 23rd using the purchasing power parity (PPP) adjusted GDP in 2020 (World Bank, 2021). Many investors have considered Vietnam with significant growth potential and decided to invest in Vietnam. Therefore, understanding the Vietnamese stock market and the sectors’ characteristics is important to estimate the risks and design a proper investment strategy. The Vietnamese stock market is considered one of the frontier markets. Therefore, the stock market is considered small, risky, and illiquid, which is easier to be manipulated than other stock markets. However, since the market is small and has a huge growth potential when the Vietnamese economy develops, it provides substantial profitable investment opportunities for investors. Therefore, understanding the market risk, especially the stocks’ volatility, can help investors mitigate the risk and manage their portfolios when they invest in the Vietnamese stock market.
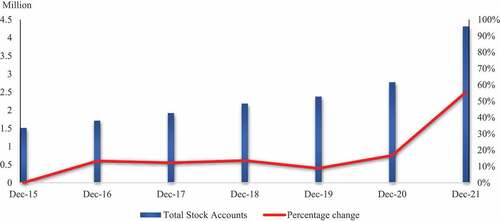
As a frontier market, the Vietnamese stock market has exhibited high volatility for most of the time since the market was established. Along with the economic growth and development, more and more investors participate in the Vietnamese stock market. However, the emergence of the Covid-19 pandemic has caused the global economy to suffer a significant economic downturn. The Vietnamese government has responded to the pandemic by enacting lockdowns, quarantines, and social distancing, forcing many Vietnamese people to stay home for several months. Also, the unemployment rate increased since many businesses have struggled to operate after being severely hit by the pandemic. Therefore, more people seek investment opportunities to generate income and profit during the pandemic, thus creating a significant number of new investors trading accounts joining the market during the Covid-19 period of 2020–2021. The participation of substantial individual investors has lifted the stock market liquidity to more than 10 trillion VND, approximately 2 billion USD, in December 2021. presents Vietnam’s total stock trading accounts from December 2015 to December 2021. The total accounts in 2020 increased by 17 per cent compared to 2019. In 2021, the increase reached 56 per cent, thus showing that investors are incredibly interested in investing in the stock market (The State Securities Commission of Vietnam, Citation2021).
Figure 1. Total stock trading accounts in Vietnam over the period from 2015 to 2021.
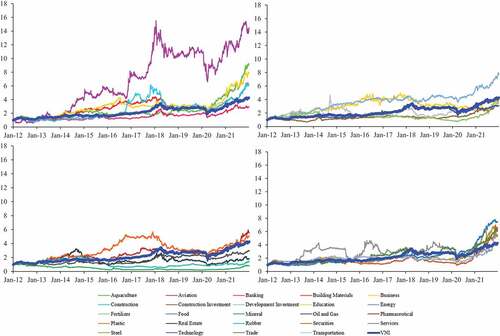
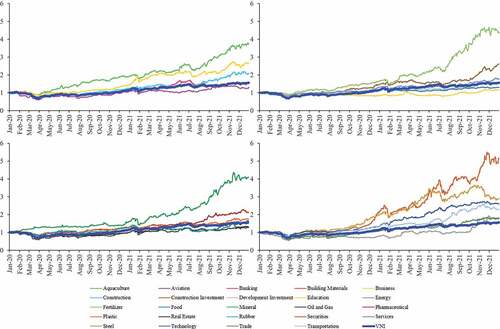
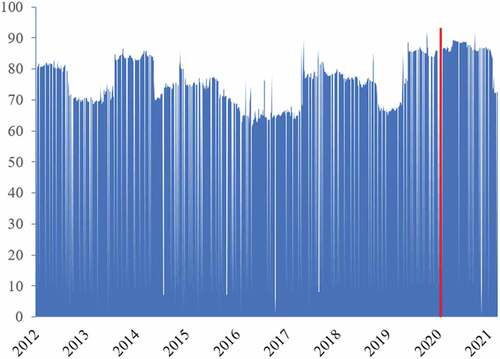
The Covid-19 pandemic has affected various Vietnamese stock sectors, and significant shocks as the pandemic usually amplify the market volatility across financial markets. illustrates the market price volatility in 24 Vietnamese stock sectors and compares them with the Vietnamese stock market index, the VN-Index (VNI), over the ten years of 2012–2021 () and the Covid-19 pandemic period of 2020–2021 (). The significant fluctuation trend of the sectoral market indices can be observed among all sectors. However, from 2012 to 2021, Aviation exhibits the most significant price volatility over the entire period. Aviation reached the highest price increase of around 1,550 per cent in January 2018. The level then significantly dropped by approximately 50 per cent from the peak to 660 per cent in March 2020 when Covid-19 emerged. The pandemic has caused extreme chaos among Vietnamese people and severely damaged the aviation sector by forcing the government to restrict flights and enact lockdowns. Also, the VN-Index and other sectors experienced a plunge in March 2020 to hit bottom and then gradually recovered (The State Securities Commission of Vietnam, Citation2021).
Figure 2. (a) The Vietnamese stock market index and 24 Vietnamese sectors indices volatility from 2012 to 2021. (b.) The Vietnamese stock market and 24 Vietnamese sectors indices volatility during the Covid-19 period of 2020–2021.
Besides, we argue that all stock sectors have inter-connectedness in which substantial volatility emerging in one sector may spread to other sectors (Zhang et al., Citation2020). This mechanism is generally considered volatility spillover/connectedness, a typical characteristic of financial crises and economic downturns (Laborda & Olmo, Citation2021). The Covid-19 pandemic in Vietnam might create substantial volatility spillover across all Vietnamese sectors. Therefore, analyzing the sectoral volatility connectedness during the Covid-19 pandemic plays an essential role in designing public policies by the government and policymakers and managing investment portfolios by practitioners and investors. However, the sectoral spillover effects during the Covid-19 pandemic appear to be ignored in the existing literature. Previous studies have concerned the sectoral volatility spillover within specific financial markets other than Vietnam during the pandemic period, such as in China (Shahzad et al., Citation2021; Su & Liu, Citation2021; Umar et al., Citation2021), the US (Laborda & Olmo, Citation2021; Yousaf et al., Citation2020a), Europe (Aslam et al., Citation2021; Mensi et al., Citation2022), Islamic markets (Yousaf & Yarovaya, Citation2022a), and the G7 countries (Zhang et al., Citation2021).
As such, the primary research objective of this paper is to examine the spillovers among equity sectors of Vietnamese stock markets in pre and post-COVID-19 periods. We analyze the market volatility and its patterns across 24 sectors in Vietnam during the ten years of 2012–2021 and identify the most vulnerable and resilient sectors to previous shocks using the ARMA-GARCH estimations. This research objective is examined on the ground of theoretical consideration of volatility spillover and empirical analyses discussed later in this study.
The contributions of this study are twofold. First, market volatility spillover has been widely investigated for a sample of the equity markets. However, market volatility spillovers across sectors appear to be under-examined in the existing literature, especially for emerging markets. Our literature review indicates that this is the first study to examine the market volatility spillovers across Vietnam sectors, especially focusing on the current Covid-19 pandemic. Second, our study identifies the risk-transmitted and risk-received sectors among these 24 Vietnamese sectors and understands their behaviours, particularly during events such as the current Covid-19 pandemic. Understanding these classifications and the changes in behaviour play an important role in policy implications.
The structure of this study is as follows. Section 2 discusses and synthesizes related academic papers on market volatility spillovers following this introduction. Section 3 presents the research methodology and data. Empirical results on market volatility, spillovers, and significant changes in market volatility pre- and post-breakpoints during the Covid-19 pandemic, including our robustness analysis, are presented and discussed in section 4 of the paper. Finally, section 5 offers concluding remarks.
2. Literature review
Volatility spillover has been widely examined in the existing literature. Volatility spillovers are generally understood as a phenomenon that one market’s volatility prompts the volatility in other markets (Yarovaya et al., Citation2016). The market volatility spillovers of various markets are widely examined in the existing literature (for example, see Forbes and Rigobon, Citation2002; French and Poterba, Citation1991; Goetzmann et al., Citation2005; Pukthuanthong and Roll, Citation2015; Solnik and Watewai, Citation2016). Spillovers from one market to another across assets or asset classes have also been widely investigated (for example, see Engle et al., Citation1990; Eun and Shim, Citation1989; King and Wadhwani, Citation1990, for the earliest studies of spillovers). In particular, empirical studies on this market volatility spillovers have been conducted for the US and other markets, Scandinavian markets, and European markets. Market volatility spillovers have also been examined for spot and futures markets, the energy markets, credit markets, commodity markets, bond markets, foreign exchange or cryptocurrency markets (see, Hoang & Baur, Citation2021; Yousaf & Ali, Citation2020; Yousaf et al., Citation2020a, Citation2020b, Citation2020c; Yousaf & Hassan, Citation2019; Yousaf & Yarovaya, Citation2022b).
Regarding sectoral volatility spillovers, Zhang et al. (Citation2020) argue that sectors in an economy are closely connected and that significant volatility occurring in one sector could also trigger the other sectors’ volatility. Such volatility spillovers are representatives of financial crises (Laborda & Olmo, Citation2021). As such, constructing appropriate methods to examine the volatility spillovers has largely drawn scholars’ attention. Su and Liu (Citation2021) have presented three main approaches to measuring volatility spillovers. The first approach includes using Granger causality to examine the mean spillover and returns volatility (Atukeren et al., Citation2021; Hong, Citation2001; Hong et al., Citation2009). The second approach focuses on the vector autoregression (VAR) family models to investigate the volatility spillovers across markets through the mechanism of network topology (Diebold & Yilmaz, Citation2009, Citation2012; Diebold & Yılmaz, Citation2014; Gabauer & Gupta, Citation2018; Laborda & Olmo, Citation2021; Su & Liu, Citation2021; Yousaf et al., Citation2022). The third approach uses the generalized autoregressive conditional heteroskedasticity (GARCH) models. The GARCH family models appear to be comprehensive as they are widely adopted to examine volatility spillovers among markets, sectors, and institutions (Bouri et al., Citation2021; Cheung & Ng, Citation1996; Gabauer, Citation2020; Hamao et al., Citation1990; Hassan & Malik, Citation2007; Yousaf et al., Citation2020b).
Besides, scholars have recently combined these three conventional approaches with a novel method known as wavelet transform to measure volatility spillovers. For example, Boubaker and Raza (Citation2017) combine a multivariate ARMA-GARCH model and wavelet multiresolution analysis to investigate the volatility spillovers between oil prices and BRICS stock markets. Ghosh and Chaudhuri (Citation2019) implement a comprehensive approach including the Granger causality test, Diebold-Yilmaz VAR model, GARCH family models, and wavelet decomposition to examine the temporal correlation, causal relationship, and spillovers among eight financial time series/indices, including CBOE Volatility Index (VIX), India VIX, Crude Oil, FX1, DJIA, Nifty IT, Metal and BSE Sensex.
The recent Covid-19 outbreak has been reported to have caused economic downturns in many countries, which may also trigger their stock markets’ volatility and volatility spillovers. Significantly, the stock markets have more robust responses to the pandemic than the real economy (Hasan et al., Citation2021). In addition, findings from Aslam et al. (Citation2021), Akinlaso et al. (Citation2021), Bissoondoyal-Bheenick et al. (Citation2021), and Mensi et al. (Citation2022) have confirmed a significant increase in stock markets’ volatility associated with the Covid-19 rapid outbreaks. As such, sectors in the stock markets might also have experienced a rise in volatility and volatility spillovers during the pandemic.
Su and Liu (Citation2021) adopt the VAR model developed by Diebold and Yilmaz (Citation2012) to examine the spillover network of financial shocks among ten Chinese sectors before and during the Covid-19 period. Their findings confirm a more vital connectedness among Chinese sectors since the Covid-19 outbreaks. Furthermore, these findings confirm the increased volatility spillovers among Chinese sectors in which consumer discretionary, industrials, and materials sectors become the primary risk transmitters. Also, Shahzad et al. (Citation2021) examined the volatility spillovers across ten Chinese sectors. They observed the asymmetric effect of positive and negative volatility patterns which are intense and time-varying during the Covid-19 period. Specifically, the negative volatility spillover patterns appear to outweigh the positive patterns. Laborda and Olmo (Citation2021) have found that the energy, banking & insurance, and biotechnology sectors are the main volatility transmitters for the US sectoral volatility spillovers. Similarly, Choi (Citation2022) has observed that the Covid-19 outbreak magnifies the volatility spillovers across eleven sectors in the US, in which the main volatility transmitters are the energy, consumer discretionary, and consumer staples sectors.
The literature on volatility spillovers in the context of Vietnam remains limited. Previous studies only confirm the significant role of foreign ownership in stabilizing stock return volatility in Vietnam (Vo, Citation2015) and improved corporate earnings quality (Vo et al., Citation2019) for listed firms in Vietnam. In particular, Vo (Citation2015) examines the effects of foreign ownership on the firm-level volatility of stock returns in Vietnam using a sample of listed firms on the Ho Chi Minh City stock exchange. The author concludes that a firm’s ownership by foreign investors decreases the firm’s stock price volatility in Vietnam’s stock market. In another attempt, Vo et al. (Citation2019) examine the nature of foreign stakeholders’ role in enhancing the quality of financial reported earnings. Their findings indicate that firms with greater foreign shareholdings are aligned with a higher quality of financial disclosure.
Our literature review indicates that no studies have examined the volatility spillovers across sectors in Vietnam, especially during the Covid-19 period. As the literature on volatility spillovers across sectors in Vietnam is still underdeveloped, we consider using a combination approach, including the Diebold-Yilmaz VAR model and the GARCH family models, to examine the volatility spillovers in Vietnam as essential. The current lack of evidence on this crucial topic of volatility spillover across sectors warrants our analysis in this study.
3. Data and research methodologies
3.1. Data and sampling
This study uses the daily closing prices of 24 Vietnamese sectors’ indices over ten years from 2012 to 2021. These sectors include Aquaculture, Aviation, Banking, Building Materials, Business, Construction, Construction Investment, Development Investment, Education, Energy, Fertilizer, Food, Mineral, Oil & Gas, Pharmaceutical, Plastic, Real Estate, Rubber, Securities, Services, Steel, Technology, Trade, and Transportation. Additionally, the sub-period, including the Covid-19 pandemic of 2020–2021, is also used to examine the effects of the pandemic on market volatility among the Vietnamese sectors.
3.2. Methodologies
3.2.1. The ARMA-GARCH approach to estimating volatility
We employ the ARMA-GARCH estimation to investigate the market volatility and the volatility patterns across 24 Vietnamese sectors. Noticeably, the GARCH model captures volatility clustering and heteroskedasticity. Zivot (Citation2009) argues that the GARCH model is more advantageous than the ARCH model in estimating the unstable magnitude residuals obtained from the ARMA model.
We also conduct the ARMA model to examine the market volatility (). The market return for each sector is estimated as follows.
where:Dit represents the closing price of index i at time t, Xit denotes the change in index i at time t.
The optimal lag length of AR (r) and MA (s) employed in the ARMA model are determined using the Bayesian Information Criterion (BIC) maximization.
where: denotes the backshift operator.
and
are the coefficients of the ARMA model’s auto-regressive (AR) and moving average (MA) parts.
represents the residual expected to be independently and identically distributed.
Next, we conduct the heteroskedasticity test for the dataset to confirm the ARCH effect using the Ljung-Box portmanteau (Q) test (Ljung & Box, Citation1978).
where: represents the degree of freedom to investigate the model stationarity.
is the estimated autocorrelation of lag
.
stands for the observation number.
The test’s null hypothesis (H0) is that the series follows a white noise process, implying no ARCH effects occurrence. However, when we reject the null hypothesis, the return series have ARCH effects. The test result warrants our next step to employ the ARMA(r,s)—GARCH model to extract the conditional variance (market volatility) of 24 Vietnamese sectors. The GARCH
equation is described as follows:
3.2.2. Estimating the market volatility spillover using the forecast error variance decomposition in a vector autoregression (VAR) model
After examining the market volatility of each sector, our next objective is to analyze the volatility transmission/spillover among 24 sectors in the Vietnamese stock market. Therefore, we adopt the connectedness/spillover network analysis approach by Diebold and Yilmaz (Citation2012, Citation2015) in our analysis of volatility spillover. Under this spillover network analysis approach, the association structure among all sectors can be identified deeper. Also, each sector’s directions of transmission structure and node weight can be identified simultaneously (Diebold & Yılmaz, Citation2014). The simplicity and informativeness of this connectedness network analysis approach perfectly fit our study’s objectives.
The spillover index is calculated based on the forecast error variance decomposition in the vector autoregression (VAR) model, which is constructed by Diebold and Yilmaz (Citation2012, Citation2015). The procedure for applying the model is as follows. First, the VAR model of order p is fitted to the time series of market volatility obtained from the ARMA-GARCH estimation. We conducted the augmented Dickey-Fuller (ADF) test to examine the stationarity of the market indices of 24 Vietnamese sectors. Our findings confirm that employing the VAR model for these market indices is appropriate.Footnote1 Second, we forecast the market volatility for all sectors for h periods ahead. Using data up to time t, we obtain the error variance decomposition of each forecast corresponding to the arising shocks from the same or other network components at time t. Third, based on the forecast error variance decomposition obtained from the previous step, we estimate the volatility connectedness index of each market index and the total connectedness/spillover index of the Vietnamese stock market.
We then calculate the total spillover/connectedness index for the entire Vietnamese stock market, which is a per cent of the total variation in the spillover network. The total spillover index (TSI) can be measured as:
where N denotes the number of time series and (for) denotes the pairwise directional connectedness/spillover
This paper examines the volatility spillover effects by employing the VAR model with a lag length of three, a forecast variance error of a 12-day-ahead period, and 200-day rolling-sample windows. These parameters for the VAR estimation are used in the Diebold and Yilmaz (Citation2015) study. The lag length of three in our model is selected based on the final prediction error (FPE) and Akaike’s information criterion (AIC). Moreover, we also conduct the robustness test for our model using several VAR lags (from lag 1 to lag 5), forecast horizons (5–10-15 days), and rolling-sample window lengths (250–500-750 days).
4. Empirical results
4.1. Estimating the market volatility using the ARMA-GARCH model
The market volatility patterns for 24 stock sectors in Vietnam are presented and discussed. presents the ARMA-GARCH estimation results for the entire period of 2012–2021. Results show that all 24 sectors have both ARCH and GARCH effects, which means that the market volatilities in the current period are affected by both the shocks and volatilities from the previous periods. Additionally, the variance constants are not significantly different from 0, implying that the market volatilities across all sectors are severely affected by the shocks and volatility from the previous periods.
Table 1. The market volatility of 24 Vietnamese sectors using ARMA-GARCH estimations, an entire period 2012–2021
The GARCH effects (β) across 24 sectors in Vietnam indicate each sector’s likability to being affected by the previous periods’ volatility. Development Investment is the most severely affected sector by its volatility from prior periods, as recorded with the highest β of 0.966, followed by Education (β of 0.928) and Securities (β of 0.914). In contrast, the volatility of Construction is least affected by the previous periods’ volatility (the lowest β of 0.719).
Furthermore, the absolute value of (α + β) shown in the last row of and indicates the speed of the mean-reversion process of each sector. We note that sectors with the absolute value of (α + β), smaller than 1 have the mean-reversion process. Additionally, the lower the absolute value of (α + β) is in each sector, the faster the mean reversion of that sector. As such, our findings from indicate that 23 Vietnamese sectors, except for Development Investment, exhibit a slow mean-reversion process. Meanwhile, the Development Investment sector witnessed no mean-reversion process because the absolute value of (α + β) is more significant than 1 (α + β = 1.0013). Securities have experienced the longest mean reversion (with the highest sum of (α + β) of 0.9989). In contrast, Pharmaceutical has the fastest mean reversion with the lowest absolute value (α + β) of 0.925. Besides, all 24 sectors recorded persistent volatility because the absolute value of (α + β) is approximately equal to 1.
Table 2. The market volatility of 24 Vietnamese sectors using ARMA-GARCH estimations, the COVID-19 pandemic 2020–2021
We then employ the same ARMA-GARCH estimation for the sub-period of 2020–2021 to examine the Vietnamese stock market volatility patterns during the Covid-19 pandemic. As presented in , our results confirm that the ARCH and GARCH effects across 24 Vietnamese sectors remain significant and persistent (at a 1 per cent significance level). Moreover, the market volatility is also confirmed to be substantially affected by the shocks from the previous periods during Covid-19.
Table 3. The market volatility spillovers 24 sectors in Vietnam
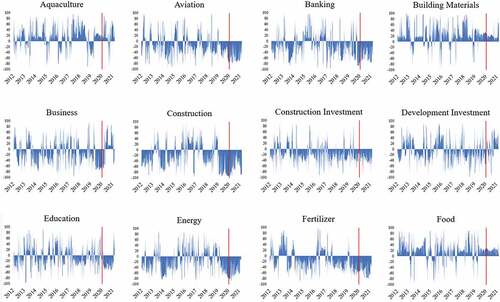
presents the market volatility patterns of 24 Vietnamese sectors from 2012 to 2021. We concentrate on each sector’s pattern over the period and the volatility changes across 24 sectors during the Covid-19. The volatility patterns indicate that Aviation, Construction, Mineral, Oil & Gas, Securities, and Services are the most volatile sectors in Vietnam over the entire period. In contrast, the 18 remaining sectors’ market volatility patterns are pretty stable. Interestingly, the Covid-19 pandemic has not severely impacted all 24 Vietnamese sectors at the beginning of 2020 because no significant volatility spikes are found during this period. The first wave of the Covid-19 pandemic occurs around 2,700, which is at the beginning of 2020. In general, several sectors recorded an increase in market volatility. However, this increase is insignificant and even lower than the previous period’s volatility spikes. Specifically, shows that Securities and Services exhibit the highest volatility of approximately 0.25 per cent per day during the Covid-19 pandemic. Meanwhile, other sectors show only a slight increase in their volatility during the pandemic.
Figure 3. Market volatility across 24 sectors in Vietnam, the entire period 2012–2021.
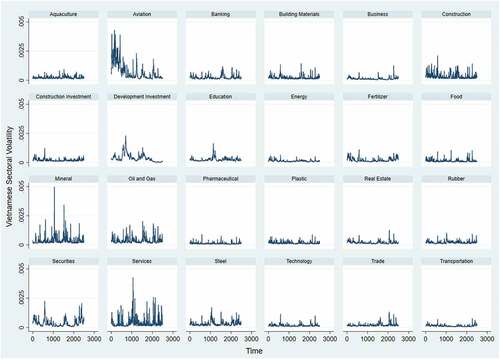
The reason behind this abnormal market behaviour can be explained by the nature of the Vietnamese stock market. Vietnam’s stock market is classified as a frontier market, which infers that the market is small, hard to access, and risky. As such, the whole stock market constantly witnesses high and persistent volatility, thus making the investors familiar with the shocks and are used to investing during high volatile periods. Therefore, the impacts of the Covid-19 pandemic shock on all 24 Vietnamese sectors are less severe, thus resulting in only a slight increase in market volatility compared to other markets such as the US or Australian stock markets.
4.2. The spillover effects across 24 Vietnamese sectors during the COVID-19 pandemic
The spillover effects across 24 sectors in Vietnam over the entire ten years research period of 2012–2021 using the vector autoregression (VAR) model are examined and presented in this section.
presents the connectedness/spillover network among 24 Vietnamese sectors. The total spillover index (TSI) indicates the average spillover effects across all Vietnamese sectors. The TSI of all 24 Vietnamese sectors is 76.4 per cent during the entire period, implying that the spillover effects across Vietnamese sectors are extreme and the inter-sector connectedness is substantial. This finding indicates that the market risk in terms of volatility among Vietnamese stocks is likely to spread among all sectors rapidly. Furthermore, the results of the net spillover effect of each sector show that Food and Building Materials play an essential role as the most significant risk transmitters across the Vietnamese stock market because of their most significant “NET” values of around 100 per cent in the volatility transmission network. Therefore, these two sectors are considered significant risk transmission sources, implying that whenever significant market volatility emerges in these sectors, the volatility will spread to other sectors quickly. In contrast, Real Estate and Securities are the two most significant risk absorbers (with the lowest “NET” values of −32.58 per cent and −30.47 per cent, respectively). Knowing each sector’s characteristics can help policymakers avoid market failure or mitigate the negative impacts on the financial market created by the major shocks.
shows total average spillover index (TSI) changes in trend over 2012–2021. The total connectedness index among 24 sectors in Vietnam is consistently high, which is always more than 60 per cent. However, the TSI increased to around 90 per cent after the first case of Covid-19 was recorded in Vietnam on 23 January 2020, thus indicating an extremely high market volatility spillover effects across 24 sectors during the pandemic period.
Figure 4. The total spillover effect of all sectors over the 2012–2021 period.
presents the spillover effects changes in each Vietnamese sector over the entire research period. Additionally, we use the vertical red line to mark the first recorded Covid-19 case in Vietnam on 23 January 2020 to compare the spillover effect between pre-pandemic and during the pandemic. Based on the illustrated patterns in , Aviation, Construction Investment, Pharmaceutical, Real Estate, Rubber, Securities, and Technology are the significant risk absorbers over the entire period. The persistent negative spillover trends most support this finding during the whole period. In contrast, Aquaculture, Building Materials, Food, and Plastic are the main risk transmitters with a consistently positive spillover trend over the 2012–2021 research period.
Figure 5. Spillover effects of 24 sectors in Vietnam over the 2012–2021 period.

We now analyze the impacts of the Covid-19 pandemic on the spillover effects across 24 sectors in Vietnam. The trend between pre-and during the pandemic is compared. The pandemic is found to create a paramount increase in the spillover effects across 24 Vietnamese sectors. This finding is supported by the rise to approximately 90 per cent in the TSI, as presented in .
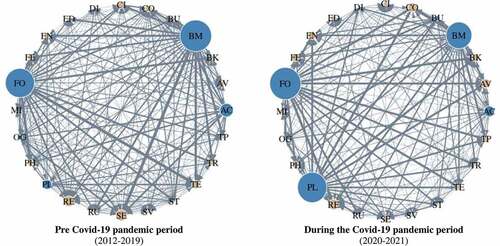
Furthermore, the pandemic has caused changes in the spillover network of many sectors. illustrates the role of 24 Vietnamese sectors in the spillover network and compares the differences between pre-and during the Covid-19 pandemic. Building Materials, Food, Aquaculture, and Plastic are always the four most significant risk transmitters both pre-pandemic and during the pandemic period, consistent with the findings in the spillover patterns presented in Figure . On the other hand, oil and Gas switched from the risk transmitter to the risk absorber after the emergence of the pandemic. Interestingly, all 19 remaining sectors are always the risk absorbers from 2012 to 2020. As such, we can conclude that across 24 Vietnamese sectors, the four most significant risk transmitters always spread the market risk in terms of volatility to the other twenty sectors, especially during the Covid-19 period when the spillover effects are amplified.
Figure 6. The comparison of the Vietnamese sectoral volatility spillover between the pre-and during the Covid-19 pandemic
4.3. A robustness analysis
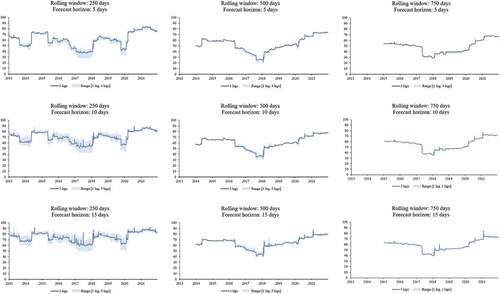
This section conducts a robustness analysis concerning market volatility spillovers across 24 Vietnamese sectors using various combinations of rolling windows, forecast horizons and lag lengths. Our analysis uses the rolling window of 200 days, a forecast horizon of 12 days, and the optimal lag of 3 days to input the VAR model to examine the sectoral spillover effects. However, different combinations of these parameters/inputs may result in different patterns. As such, we conduct the robustness test using different combinations of the rolling windows (250 days, 500 days, 750 days); the forecast horizon (5 days, ten days, 15 days), and lag lengths (1 day, two days, three days, four days, five days). illustrates the robustness analysis results. Our robustness analysis indicates that the trends and magnitudes of the market volatility spillover across 24 sectors in Vietnam, represented by the total spillover index (TSI), largely remain unchanged regardless of the combinations of different rolling windows, forecast horizons, and lag lengths.
Figure 7. Robustness test of the total volatility spillover of the Vietnamese stock market.
5. Concluding remarks
The market volatility patterns, characteristics, and spillover effects among stock markets have been extensively investigated. However, the volatility spillovers among various sectors of a country have largely been ignored in the existing literature, in particular for an emerging market such as Vietnam. As such, our study is conducted to examine market volatility across Vietnamese sectors during the 2012–2021 period, including the Covid-19 pandemic. Our analysis uses the ARMA-GARCH estimation technique to estimate market volatility and the vector autoregression (VAR) technique to examine the spillover effects between these sectors.
Our empirical results indicate that all 24 Vietnamese sectors are substantially affected by the shocks and volatilities from previous periods. Development Investment, followed by Education and Securities, are the most severely affected sector by the market volatility from prior periods. In contrast, Construction is the least affected sector by market volatility from previous periods. Also, Development Investment is found to have no mean-reversion. Pharmaceutical exhibits the fastest mean reversion, whereas Securities shows the most prolonged mean-reversion process. Furthermore, we found that Aviation, Construction, Mineral, Oil & Gas, Securities, and Services are the most volatile sectors in Vietnam over the entire research period. Noticeably, all Vietnamese sectors have not been severely impacted by the Covid-19 pandemic since the volatility spikes are not significant compared to the previous periods.
In addition, our findings indicate that the inter-sector connectedness across 24 sectors in Vietnam is consistently high, reaching above 60 per cent over 2012–2021. This finding means that the Vietnamese stock market risks will likely spread across all sectors rapidly whenever a major shock emerges. The substantial spillover effects among all sectors were found after the first case of Covid-19 was recorded in Vietnam on 23 January 2020. Additionally, we found that Aviation, Construction Investment, and Pharmaceutical are the most significant risk absorbers. Meanwhile, Aquaculture and Building Materials are the main risk transmitters during the research period.
Our study exhibits limitations. Studies in the future may need to identify the mechanism by which volatility spillovers occur across 24 Vietnamese sectors. Understanding this mechanism is very important for policy implications for the Vietnamese government and governments of other emerging markets to formulate and implement appropriate responses to market shocks from future events. In addition,
Disclosure statement
No potential conflict of interest was reported by the author(s).
Additional information
Funding
Notes
1. Empirical results of the stationarity test are available upon request.
References
- Akinlaso, M. I., Robbana, A., & Mohamed, N. (2021). Volatility transmission within financial markets during the COVID-19 pandemic: Are faith-based investors well off in tunisia? Journal of Islamic Accounting and Business Research, 13(1), 98–20. https://doi.org/10.1108/jiabr-12-2020-0388
- Aslam, F., Ferreira, P., Mughal, K. S., & Bashir, B. (2021). Intraday volatility spillovers among European financial markets during COVID-19. International Journal of Financial Studies, 9(1), 5. https://doi.org/10.3390/ijfs9010005
- Atukeren, E., Çevik, E. S., & Korkmaz, T. (2021). Volatility spillovers between WTI and Brent spot crude oil prices: An analysis of Granger causality in variance patterns over time. Research in International Business and Finance, 56, 101385. https://doi.org/10.1016/j.ribaf.2021.101385
- Bissoondoyal-Bheenick, E., Do, H., Hu, X., & Zhong, A. (2021). Learning from SARS: Return and volatility connectedness in COVID-19. Finance Research Letters, 41, 101796. https://doi.org/10.1016/j.frl.2020.101796
- Boubaker, H., & Raza, S. A. (2017). A wavelet analysis of mean and volatility spillovers between oil and BRICS stock markets. Energy Economics, 64, 105–117. https://doi.org/10.1016/j.eneco.2017.01.026
- Bouri, E., Gabauer, D., Gupta, R., & Tiwari, A. K. (2021). Volatility connectedness of major cryptocurrencies: The role of investor happiness. Journal of Behavioral and Experimental Finance, 30, 100463. https://doi.org/10.1016/j.jbef.2021.100463
- Cheung, Y. W., & Ng, L. K. (1996). A causality-in-variance test and its application to financial market prices. Journal of Econometrics, 72(1–2), 33–48. https://doi.org/10.1016/0304-4076(94)01714-X
- Choi, S. Y. (2022). Dynamic volatility spillovers between industries in the US stock market: Evidence from the COVID-19 pandemic and Black Monday. The North American Journal of Economics and Finance, 59, 101614. https://doi.org/10.1016/j.najef.2021.101614
- Diebold, F. X., & Yilmaz, K. (2009). Measuring financial asset return and volatility spillovers, with application to global equity markets. The Economic Journal, 119(534), 158–171. https://doi.org/10.1111/j.1468-0297.2008.02208.x
- Diebold, F. X., & Yilmaz, K. (2012). Better to give than to receive: Predictive directional measurement of volatility spillovers. International Journal of Forecasting, 28(1), 57–66. https://doi.org/10.1016/j.ijforecast.2011.02.006
- Diebold, F. X., & Yılmaz, K. (2014). On the network topology of variance decompositions: Measuring the connectedness of financial firms. Journal of Econometrics, 182(1), 119–134. https://doi.org/10.1016/j.jeconom.2014.04.012
- Diebold, F. X., & Yilmaz, K. (2015). Financial and macroeconomic connectedness: A network approach to measurement and monitoring. Oxford University Press.
- Engle, R. F., Ito, T., & Lin, W.-L. (1990). Meteor showers or heat waves? Heteroskedastic intra-daily volatility in the foreign exchange market. Econometrica, 58(3), 525–542. https://doi.org/10.2307/2938189
- Eun, C. S., & Shim, S. (1989). International transmission of stock market movements. The Journal of Financial and Quantitative Analysis, 24(2), 241. https://doi.org/10.2307/2330774
- Forbes, K. J., & Rigobon, R. (2002). No contagion, only interdependence: Measuring stock market comovements. The Journal of Finance, 57(5), 2223–2261. https://doi.org/10.1111/0022-1082.00494.
- French, K. R. & Poterba, J. M. (1991). Investor diversification and international equity markets. The American Economic Review, 81(2), 222–226. https://doi.org/10.3386/w3609.
- Gabauer, D. (2020). Volatility impulse response analysis for DCC‐GARCH models: The role of volatility transmission mechanisms. Journal of Forecasting, 39(5), 788–796. https://doi.org/10.1002/for.2648
- Gabauer, D., & Gupta, R. (2018). On the transmission mechanism of country-specific and international economic uncertainty spillovers: Evidence from a TVP-VAR connectedness decomposition approach. Economics Letters, 171, 63–71. https://doi.org/10.1016/j.econlet.2018.07.007
- Ghosh, I., & Chaudhuri, T. D. (2019). A wavelet approach towards examining dynamic association, causality and spillovers. International Journal of Data and Network Science, 3(1), 23–36. https://doi.org/10.5267/j.ijdns.2018.11.002
- Goetzmann, W. N., Li, L., & Rouwenhorst, K. G. (2005). Long-term global market correlations. The Journal of Business, 78(1), 1–38. https://doi.org/10.1086/426518
- Hamao, Y., Masulis, R. W., & Ng, V. (1990). Correlations in price changes and volatility across international stock markets. Review of Financial Studies, 3(2), 281–307. https://doi.org/10.1093/rfs/3.2.281
- Hasan, M., Mahi, M., Sarker, T., & Amin, M. (2021). Spillovers of the COVID-19 pandemic: Impact on global economic activity, the stock market, and the energy sector. Journal of Risk and Financial Management, 14(5), 200. https://doi.org/10.3390/jrfm14050200
- Hassan, S. A., & Malik, F. (2007). Multivariate GARCH modelling of sector volatility transmission. The Quarterly Review of Economics and Finance, 47(3), 470–480. https://doi.org/10.1016/j.qref.2006.05.006
- Hoang, L., & Baur, D. (2021). Spillovers and Asset allocation. Journal of Risk and Financial Management, 14(8), 345. https://doi.org/10.3390/jrfm14080345
- Hong, Y. (2001). A test for volatility spillover with application to exchange rates. Journal of Econometrics, 103(1–2), 183–224. https://doi.org/10.1016/S0304-4076(01)00043-4
- Hong, Y., Liu, Y., & Wang, S. (2009). Granger causality in risk and detection of extreme risk spillover between financial markets. Journal of Econometrics, 150(2), 271–287. https://doi.org/10.1016/j.jeconom.2008.12.013
- King, M. A., & Wadhwani, S. (1990). Transmission of volatility between stock markets. The Review of Financial Studies, 3(1), 5–33. https://doi.org/10.1093/rfs/3.1.5
- Laborda, R., & Olmo, J. (2021). Volatility spillover between economic sectors in financial crisis prediction: Evidence spanning the great financial crisis and COVID-19 pandemic. Research in International Business and Finance, 57, 101402. https://doi.org/10.1016/j.ribaf.2021.101402
- Ljung, G. M., & Box, G. E. P. (1978). On a measure of lack of fit in time series models. Biometrika, 65(2), 297–303. https://doi.org/10.1093/biomet/65.2.297
- Mensi, W., Yousaf, I., Vo, X. V., & Kang, S. H. (2022). Asymmetric spillover and network connectedness between gold, BRENT oil and EU subsector markets. Journal of International Financial Markets, Institutions and Money, 76, 101487. https://doi.org/10.1016/j.intfin.2021.101487
- Pukthuanthong, K., & Roll, R. (2014). Internationally correlated jumps. The Review of Asset Pricing Studies, 5(1), 92–111. https://doi.org/10.1093/rapstu/rau009
- Shahzad, S. J. H., Naeem, M. A., Peng, Z., & Bouri, E. (2021). Asymmetric volatility spillover among Chinese sectors during COVID-19. International Review of Financial Analysis, 75, 101754. https://doi.org/10.1016/j.irfa.2021.101754
- Solnik, B., & Watewai, T. (2016). International correlation asymmetries: Frequent-but-small and infrequent-but-large equity returns. The Review of Asset Pricing Studies, 6(2), 221–260. https://doi.org/10.1093/rapstu/raw005
- Su, X., & Liu, Z. (2021). Sector volatility spillover and economic policy uncertainty: Evidence from China’s stock market. Mathematics, 9(12), 1411. https://doi.org/10.3390/math9121411
- The State Securities Commission of Vietnam. 2021. Vietnam’s stock market performance, accessed on 25 September 2021.
- Umar, Z., Yousaf, I., & Aharon, D. Y. (2021). The relationship between yield curve components and equity sectorial indices: Evidence from China. Pacific-Basin Finance Journal, 68, 101591. https://doi.org/10.1016/j.pacfin.2021.101591
- Vo, X. V. (2015). Foreign ownership and stock return volatility – Evidence from Vietnam. Journal of Multinational Financial Management, 30, 101–109. https://doi.org/10.1016/j.mulfin.2015.03.004
- Vo, X. V., Chu, T. K. H., & McMillan, D. (2019). Do foreign shareholders improve corporate earnings quality in emerging markets? Evidence from Vietnam. Cogent Economics & Finance, 7(1), 1698940. https://doi.org/10.1080/23322039.2019.1698940
- Yarovaya, L., Brzeszczyński, J., & Lau, C. K. M. (2016). Intra- and inter-regional return and volatility spillovers across emerging and developed markets: Evidence from stock indices and stock index futures. International Review of Financial Analysis, 43, 96–114. https://doi.org/10.1016/j.irfa.2015.09.004
- Yousaf, I., & Ali, S. (2020). Discovering interlinkages between major cryptocurrencies using high-frequency data: New evidence from COVID-19 pandemic. Financial Innovation, 6(1), 1–18. https://doi.org/10.1186/s40854-020-00213-1
- Yousaf, I., Ali, S., & Wong, W. K. (2020a). An empirical analysis of the volatility spillover effect between world-leading and the Asian stock markets: Implications for portfolio management. Journal of Risk and Financial Management, 13(10), 226. https://doi.org/10.3390/jrfm13100226
- Yousaf, I., Ali, S., & Wong, W. K. (2020b). Return and volatility transmission between world-leading and latin American stock markets: Portfolio implications. Journal of Risk and Financial Management, 13(7), 148. https://doi.org/10.3390/jrfm13070148
- Yousaf, I., Ali, S., & Wong, W. K. (2020c). Return and volatility transmissions between metals and stocks: A study of the emerging asian markets by using the VAR-AGARCH approach. Asia-Pacific Journal of Operational Research, 39(4), 2040020. https://doi.org/10.1016/j.najef.2020.101248
- Yousaf, I., & Hassan, A. (2019). Linkages between crude oil and emerging Asian stock markets: New evidence from the Chinese stock market crash. Finance Research Letters, 31, 207–217. https://doi.org/10.1016/j.frl.2019.08.023
- Yousaf, I., Nekhili, R., & Gubareva, M. (2022). Linkages between DeFi assets and conventional currencies: Evidence from the COVID-19 pandemic. International Review of Financial Analysis, 81, 102082. https://doi.org/10.1016/j.irfa.2022.102082
- Yousaf, I., & Yarovaya, L. (2022a). Spillovers between the Islamic gold-backed cryptocurrencies and equity markets during the COVID-19: A sectorial analysis. Pacific-Basin Finance Journal, 71, 101705. https://doi.org/10.1016/j.pacfin.2021.101705
- Yousaf, I., & Yarovaya, L. (2022b). Static and dynamic connectedness between NFTs, Defi and other assets: Portfolio implication. Global Finance Journal, 53, 100719. https://doi.org/10.1016/j.gfj.2022.100719
- Zhang, P., Sha, Y., & Xu, Y. (2021). Stock market volatility spillovers in G7 and BRIC. Emerging Markets Finance and Trade, 57(7), 2107–2119. https://doi.org/10.1080/1540496X.2021.1908256
- Zhang, W., Zhuang, X., Wang, J., & Lu, Y. (2020). Connectedness and systemic risk spillovers analysis of Chinese sectors based on tail risk network. The North American Journal of Economics and Finance, 54, 101248. https://doi.org/10.1016/j.najef.2020.101248
- Zivot, E. (2009). Practical issues in the analysis of univariate GARCH models. In T. Mikosch, J.-P. Kreiß, R. A. Davis, & T. G. Andersen (Eds.), Handbook of financial time series (pp. 113–155). Springer.