
 ?Mathematical formulae have been encoded as MathML and are displayed in this HTML version using MathJax in order to improve their display. Uncheck the box to turn MathJax off. This feature requires Javascript. Click on a formula to zoom.
Abstract
Foreign direct investment (FDI) plays a vital role in boosting economic growth and providing more job opportunities. Hence, it is imperative to investigate the factors that can spur FDI inflows in the Southeast Asia region (ASEAN) and its three largest trading partners: China, Japan, and South Korea (ASEAN+3). Besides, whether corruption can boost or decrease FDI inflows, and whether larger environmental degradation triggers FDI inflows have been sparsely explored by previous studies. The panel Autoregressive Distributed Lag (ARDL) approach is employed to analyze the period from 1995 to 2020. The results show evidence of the grabbing hand hypothesis in ASEAN+3 as decreasing corruption can positively impact FDI inflows in the long run. However, the results support that increasing environmental degradation has spurred FDI in the region, suggesting reformulating investment promotion policies towards more environmentally friendly ones. These findings are important for policymakers to formulate the right policies for boosting FDI. Punishment for those who act in a corrupt manner may act as a deterrent to would-be offenders. Using more renewable energy could help to reduce environmental degradation and boost FDI simultaneously.
1. Introduction
Foreign direct investment (FDI) has become a vital driver of economic growth as it can lead to more efficient utilization of resources and improvements in productivity. FDI inflows, especially from developed countries, can help spur economic development in less-developed countries. Foreign capital can be a channel to transfer technology, provide more job opportunities, increase export revenues, and encourage healthy competition between local and international producers (Esquivias & Harianto, Citation2020). Due to the importance of FDI for economic growth, several studies have identified some factors that may boost foreign investment inflows, such as openness to trade, macroeconomic stability, market size, infrastructure development, financial openness, and other determinants (Canare, Citation2017).; Magbondé et al., Citation2022). A larger market size may pave the way for higher FDI (Sodik et al., Citation2019). High inflation levels can reduce FDI (Coban & Yussif, Citation2019) as it can signal poor macro-economic stability and high risk, promoting a lack of confidence for investors. Greater trade openness can also influence FDI (Zaman et al., Citation2018). This suggests that trade restrictions may act as a hindrance to boosting FDI inflows.
As corruption remains a considerable challenge for many countries, some studies have also considered the role played by corruption on FDI. There are mixed findings on the corruption—FDI nexus. Some scholars found that higher corruption can harm FDI inflows (B. A. Karim et al., Citation2018; Gasanova et al., Citation2017; Luu et al., Citation2018). Their findings supported the grabbing hand theory as foreign investors incur higher costs when facing high corruption levels. High corruption undermines efficiency in public services, perceived as hindering business, hampering the implementation of projects, and discouraging investors. However, other studies ascertained that corruption could increase FDI, supporting the helping hand theory (Moustafa, Citation2021; Quazi et al., Citation2014). This is because when there is a higher corruption rate, foreign investors can manoeuvre to avoid rules and regulations. Thus, bribery can facilitate the execution of business activities and accelerate the implementation of projects in favour of specific investors. While excessive procedures and regulations can deter foreign investors from financing projects in corrupt countries, high levels of lawbreaking can allow investors to circumvent laws and regulations. Environments in which excessive bureaucracy and business regulations can be bypassed through bribery may not necessarily discourage new investors. The empirical evidence is still divided since some studies confirm that corruption graces the wheels in FDI, while other studies support that corruption sands the wheels.
Although the Asian region has lessened corruption practices by improving transparency and institutions (Dogan & Wong, Citation2020; Esquivias et al., Citation2022), it still suffers from rampant corruption as noted by Azam and Hassan (Citation2013). The corruption perception index (See, Figure ) in the emerging ASEAN countries and China remains below 41. A scale of 0 (very corrupt) to 100 (very clean) indicates the perceived level of public sector corruption. Such an undesirable level of corruption control opens the question of whether corruption may harm foreign investors, or by contrast, it boosts FDI inflows.
Figure 1. Corruption perception index.
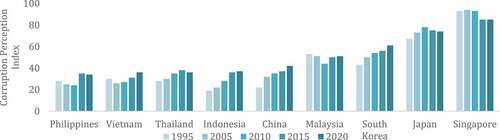
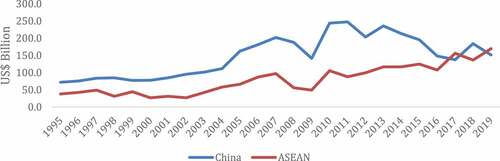
Some members of the Association of Southeast Asian countries (ASEAN) consisting of Malaysia, Indonesia, Thailand, the Philippines, and Vietnam have seen high levels of FDI coexist with high-medium levels of corruption. FDI inflows in the ASEAN soar from US$ 33.8 billion in 1995 to more than US$ 170 billion in 2020 (Figure ). Together with their three closest trading partners, namely Japan, Korea, and China (ASEAN+3 hereafter), FDI has become an important source of capital for the region. The ASEAN+3 countries aim to increase cooperation in trade and investment among the members. As a result of this cooperation, the ASEAN countries have received a total of USD 22.0 billion in 2020, accounting for 16.7% of the total FDI into the ASEAN+3 countries. China alone saw an increase in FDI of more than 200% from 1995 to 2019, reaching more than US$ 150 billion of FDI inflows in 2019. Figure shows FDI inflows for China and the ASEAN+3 countries. FDI inflows contribute to about 16.94% of total FDI in the world. Malaysia received the highest FDI inflows among developing ASEAN countries, followed by Thailand, Indonesia, and the Philippines. Overall, FDI inflows dropped between 1997 and 2000 due to the Asian financial crisis and during the Global Financial Crisis of 2008 to 2010.
Figure 2. FDI inflows in China and ASEAN 1995-2019 US$ Billion).
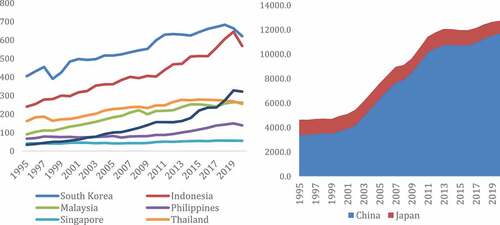
Similarly, large FDI inflows in the ASEAN+3 countries have been accompanied by increased CO2 emissions. Despite various efforts by the countries to achieve a clean environment, CO2 emissions are still rising. It has become increasingly challenging for the ASEAN countries to continue expanding their economies without harming the environment (Baek, Citation2016; Bakhsh et al., Citation2021). Figure shows total CO2 emissions in the ASEAN+3 countries. China, the second-biggest economy, is the largest emitter of CO2 emissions globally. China emitted 11.680.420 Mt in 2020, equivalent to 3.4 times more than 1995 CO2 emissions. Japan contributed the second-largest share of the total CO2 emissions in the ASEAN+3 countries at 1.061.000 Mt. Among ASEAN+3, only Japan lowered its CO2 emissions. Furthermore, from 1995 to 2019, the ASEAN countries (Singapore, Malaysia, Indonesia, Thailand, the Philippines, and Vietnam) experienced a combined increase of 250% in CO2 emissions. Emissions in the ASEAN were primarily contributed by burning fossil fuels, especially coal (Rahman et al., Citation2022). In China, coal constituted about 58% of total energy usage in 2019.
Figure 3. Total CO2 emission (Mtoe).
Thus, we aim to examine the impacts of corruption and CO2 emissions on FDI in the ASEAN+3 countries. More specifically, this study explores whether the effect of corruption on FDI in the ASEAN+3 region follows the grabbing hand (sands the wheels) or the helping hand (greases the wheels). Additionally, we question if higher CO2 emissions can cause larger FDI inflows. We test the research questions by applying the Autoregressive Distributed Lag (ARDL) panel for the ASEAN+3 countries, covering the period from 1995 to 2020. We employ the corruption perception index as a proxy for corruption and carbon dioxide emissions (CO2) as a proxy for environmental degradation. Additionally, we examine a potential relationship between inflation, trade openness, market size, infrastructure and FDI.
Several reasons can suggest the relevance of this study for the ASEAN+3 countries. First, the countries (most notably China) are shifting towards an economic growth model that relies more on investment and trade, suggesting that insights on determinants for FDI are of high relevance (Asongu et al., Citation2018). Second, the ASEAN+3 countries have expanded the number and scope of free trade agreements and promoted various investment facilitation schemes (Dogan & Wong, Citation2020; Handoyo et al., Citation2021). Third, an important pillar proposed by policymakers in the ASEAN+3 countries to attract more FDI is through infrastructure development, signalling that it is timely to assess the impact of such policies (Vidya & Taghizadeh-Hesary, Citation2021). Forth, increasing FDI may occur as a consequence of increasing environmental degradation (Baek, Citation2016; Opoku et al., Citation2022), suggesting the need to assess if FDI promotion policies may need a shift towards more environmentally friendly investments. Five, the abundant reserves of natural resources in the ASEAN region can result in opportunities for authorities to obtain illicit revenues (Masron & Subramaniam, Citation2018).
We start from the principle that corruption is a global phenomenon, with different manifestations, dimensions, and degrees affecting all countries. However, the relationship (magnitude and direction) between corruption and foreign investment decisions is open to the empirical field. It is still relevant to provide new evidence of either the helping hand or grabbing hand theory existing in the ASEAN+3 countries. The ASEAN+3 countries are the largest FDI recipients in Asia. The findings of this study are pivotal to guide policymakers to boost FDI inflows in the ASEAN+3 countries, which can influence the prospect of investment in the Asia region. To our knowledge, a research gap remains open in assessing the effects of corruption on FDI in the ASEAN region. Previous studies on emerging Asia countries mainly tested the Kuznets hypotheses or examined the role of corruption on CO2 (Azam & Khan, Citation2017; Bakhsh et al., Citation2021; Haldar & Sethi, Citation2021; Haseeb & Azam, Citation2021). Still, a few studies have placed their focus on the FDI-Corruption nexus.
Furthermore, in addressing various factors in FDI, few of the previous studies considered environmental degradation as a potential determinant of FDI. Thus, this study contributes to the body of literature by providing more recent current evidence. Environmental degradation will indicate whether the country has strict or lenient environmental regulations. Environmental regulations, such as carbon pricing and taxes, can increase costs for investors to invest in the country, and thus a lower level of FDI ensues (Belloumi & Alshehry, Citation2021). Some firms, especially in developed countries, may prefer to set up their operations in foreign countries to reduce the burden imposed by strict environmental regulations in their own countries. This suggests that less stringent rules on foreign countries may attract more capital. Therefore, including this factor may shed some light on formulating environmental policies to boost FDI without affecting the environment.
The rest of the paper is organized as follows. The second section consists of a literature review and theory development. The third section explains the methodology and data sources. The fourth section introduces the results, and the final section concludes with a summary and policy recommendations.
2. Literature review
2.1. Corruption boosting FDI
Several studies support the helping hand theory suggesting that high levels of corruption can increase FDI inflows (B. A. Karim et al., Citation2018; Belloumi & Alshehry, Citation2021; Jan et al., Citation2019; Krifa-Schneider et al., Citation2022; Moustafa, Citation2021; Onody et al., Citation2022). Helmy (Citation2013) investigated the impact of corruption on investment inflows in MENA countries from 2003 to 2009 using the panel Generalized Least Square (GLS) method. The results showed that corruption does not reduce but increases FDI inflows in MENA countries. Employing the GMM method for 53 countries in Africa, Quazi et al. (Citation2014) also pointed out a significant nexus between corruption and foreign direct investment, and thus this supported the helping hand hypothesis. Jan et al. (Citation2019) also maintained the conclusions of Quazi et al. (Citation2014) and Helmy (Citation2013) as they also identified a positive relationship between corruption and foreign capital in East Asian countries. In the Gulf Cooperation Council countries (GCC), Belloumi and Alshehry (Citation2021) noted that a greater level of corruption was found to bring more FDI into the region. However, other studies differ. Krifa-Schneider et al. (Citation2022) found mixed evidence observing 80 advanced and emerging economies. The study found that the FDI-corruption nexus follows a non-linear negative relationship. Advanced countries attract more FDI as corruption falls, while investors in emerging countries are more tolerant to higher levels of corruption. The economic level and financial development of countries played a crucial role in the FDI-corruption nexus, with emerging countries attracting higher FDI at higher levels of financial development.
In single country cases, Omodero (Citation2019) investigated the effect of corruption on foreign direct investment inflows in Nigeria (1996–2017), supporting the helping hand hypothesis that corruption can boost FDI inflows. Moustafa (Citation2021) focused on the case of Egypt from 1970 to 2019. The results of the Johansen co-integration and VECM methods disclosed that corruption could cause positive FDI inflows. Onody et al. (Citation2022) also supported the helping hand hypothesis, suggesting that corruption acts as grease for multinational corporations working in Brazil between 2012 and 2016. However, the evidence of a non-linear relationship between FDI and corruption suggests that only the Brazilian regions with medium levels of development and corruption attract FDI, suggesting that excessive levels of corruption and weak institutions can discourage the arrival of foreign firms.
2.2. Corruption reducing FDI
More often, studies support the grabbing hand theory, arguing that corruption increases the cost of investing, reducing profits, and thus investment inflows will drop (Alshehry, Citation2020; Gasanova et al., Citation2017; Luu et al., Citation2018; Nizam & Liaqat, Citation2022; Zander, Citation2021). Employing the panel OLS approach, Nizam and Liaqat (Citation2022) analyzed data from the BRIC countries between 1998 and 2017 and found that corruption reduce FDI inflows. Zander (Citation2021) concluded that higher corruption can reduce FDI inflows in the OECD countries, although arguing that both the origin and destination country of investment can intensify or lessen the effects of corruption on FDI. Castro and Nunes (Citation2013) examined the impact of corruption on FDI in 73 countries from 1998 to 2008 and found that controlling corruption is a successful driver for increasing FDI inflows. The strategy to reduce bribery and corruption practices is essential in the attraction of new foreign capital. Similar results were found by Luu et al. (Citation2018), who expanded the sample into 131 countries using the GMM method. Alshehry (Citation2020) explored the relationship between corruption and FDI inflows in the MENA countries and concluded that excessive levels of corruption in the MENA region decrease FDI inflows.
A significant association between corruption and FDI inflows in different countries suggested that corruption harms investment. Gasanova et al. (Citation2017) using a large panel of countries found similar results to those supported by Castro and Nunes (Citation2013), who found evidence of the helping hand theory. Castro and Nunes (Citation2013) observed the pattern of FDI inflows in countries with a low level of corruption, countries with a high level of corruption and countries with an intermediate level of corruption. The findings showed that countries with a low level of corruption experienced high FDI inflows. However, there is an exception for BRIC countries as they ascertained that these countries with a high level of corruption still experienced high FDI inflows.
A limited number of studies examined the impact of corruption on FDI inflows in the ASEAN countries. For example, B. A. Karim et al. (Citation2018) investigated the effect of corruption on FDI inflow in the ASEAN-5 countries from 1995 to 2014. The study employed the POLS method, and the results showed that corruption could reduce FDI inflows. With a combination of two methods, namely fixed effects and GLS, Kennedy (Citation2018), who investigated the impact of corruption on FDI inflows in Indonesia, also found the same results. Chandran et al. (Citation2021) investigated whether corruption can impact FDI inflows in Malaysia. The study employed the ARDL approach to analyze data from 1995 to 2016, and the results showed that corruption would increase FDI inflows. The ASEAN has been observed within the context of the Asia Pacific region, where the nexus between corruption and foreign investment inflows has shown that corruption could reduce investment inflows (Canare, Citation2017). The GMM method was employed to analyze 46 countries from 2006 to 2013. The overall results showed that corruption could reduce FDI inflows. However, the author failed to find significant evidence of the corruption—FDI nexus in low-income and middle-income countries. It seems convenient to re-study the link between corruption and FDI in a more homogeneous region like the ASEAN.
2.3. The nexus between FDI and CO2 emissions
The rapid growth of foreign investment in emerging countries has raised concerns about a race to the bottom phenomenon with respect to environmental sustainability. This concern stems from the possibility that investors in industries categorized as dirty tend to seek pollution havens from the emerging world. However, the possibility of the opposite of the pollution haven theory exists, since the growth of international funds may increase environmental standards, resulting in the well-known race-to-the-top phenomenon as noted in Dong et al. (Citation2012). Several studies have investigated the relationship between FDI and environmental degradation, such as Huang et al. (Citation2022), Bakhsh et al. (Citation2021), Demenaa and Afesorgborb (Citation2020), Esquivias et al. (Citation2022), Opoku et al. (Citation2022), and Demenaa and Afesorgborb (Citation2020) examined the impact of FDI on CO2 emissions by employing a meta-analysis. The study found that FDI can reduce environmental degradation. However, Huang et al. (Citation2022) obtained mixed findings between FDI and environmental degradation. This is because FDI inflows in less developed countries can increase CO2 emissions, but FDI in developed countries can reduce CO2 emissions. Huang et al. (Citation2022) employed the GMM method to analyze data from the G20 countries from 1996 to 2018. Bakhsh et al. (Citation2021) investigated the moderating role of institutional quality and technological innovation on the FDI-CO2 emissions nexus in 40 Asian countries. The study also employed the same method (GMM) to analyze data from 1996 to 2016, and the results suggested that institutional quality and technological innovation can reduce the deleterious impact of FDI on CO2 emissions. A number of studies had examined the pollution haven hypothesis in the ASEAN (i.e., Baek, Citation2016) testing the impact of FDI on CO2. However, little attention has been given to the opposite nexus, CO2 on FDI, as suggested by Opoku et al. (Citation2022).
Based on the previous studies, it can be observed that the results on the effect of CO2 and corruption on FDI are still mixed, and studies on the ASEAN+3 countries are still limited. Several studies covering the ASEAN included other determinants, such as market size, inflation and population (B. A. Karim et al., Citation2018; Dang et al., Citation2021; Esquivias et al., Citation2022). However, little literature included environmental degradation as a potential determinant of FDI. In addition, several studies investigated the impact of FDI on CO2 emissions, but not the other way around. Hence, it is of utmost importance to investigate the impacts of corruption and environmental degradation (CO2 emissions) on FDI in the ASEAN+3 countries.
2.3.1. Determinants other than corruption
Generally, previous studies on FDI determinants agreed that market size and inflation play an important role in determining FDI (Asongu et al., Citation2018; Chattopadhyay et al., Citation2022; Kumari & Sharma, Citation2017; Ngo et al., Citation2020; Suleiman et al., Citation2015). Suleiman et al. (Citation2015) investigated FDI determinants in the Southern African Customs Union (SACU) from 1990 to 2010. The study employed the POLS method, and the results showed that market size, natural resources and trade openness could boost FDI inflows in those countries. Kumari and Sharma (Citation2017) included interest rates and human capita but excluded natural resources in their model and analyzed data from developing countries for a period of 22 years ranging from 1990 to 2012. The study employed the fixed effects approach, and the findings revealed that market size, trade openness, interest rate and human capital could influence FDI.
Asongu et al. (Citation2018) investigated FDI determinants in several countries, such as Brazil, Russia, India, among other developing countries. The results were based on data on 2001 to 2011, showing that market size, infrastructure availability and trade openness can attract more investors into those countries. According to Chattopadhyay et al. (Citation2022), other than trade openness, human capital and joint economic size can have a significant impact on FDI in BRICS countries. The study employed several methods, namely GMM and panel ARDL to analyse data from 1990 to 2020.
Boğa (Citation2019) identified many determinants, including domestic credits and telecommunication infrastructure, and both were found to affect FDI in Sub-Saharan African countries. Their findings were based on data from 1975 to 2017, and the technique used was the PMG approach. Dang et al. (Citation2021) investigated FDI determinants, such as tax burden and institutional quality, in the ASEAN-7 countries. The results of their fixed-effects models showed that other than population growth, political institutions can also negatively affect FDI in those countries. In addition, inflation and tax burden can also significantly impact FDI. Ngo et al. (Citation2020) investigated FDI determinants in Vietnam using the GMM and PMG methods. Data ranging from 2000 to 2019 were analyzed, and the findings revealed that besides market size, macroeconomic policy, macroeconomic stability and labour force can also determine FDI in Vietnam.
Based on the previous studies, it can be observed that the results on the effect of corruption on FDI are still mixed, and studies on the ASEAN+3 countries are still limited. Several studies have embarked on a serious examination of corruption as an important factor in FDI inflows, and few of them investigated the impact of environmental degradation on FDI inflows. Hence, it is of utmost importance to investigate the impacts of corruption and environmental degradation (CO2 emissions) on FDI in the ASEAN+3 countries.
3. Theoretical framework
Regarding the determinants of FDI, a substantial number of previous studies have adopted the OLI model, such as Hasan et al. (Citation2017), Jaiblai and Shenai (Citation2019), and Asongu et al. (Citation2018). The theory introduced by Dunning (Citation1979, Citation2015) provides a theoretical framework for FDI determinants (i.e., ownership advantages, location advantages, and internalization advantages). Ownership advantages include the various proprietorship rights of a company, such as copyrights, trademarks, patents, and internal capabilities, which can provide competitive advantages. Another factor that can attract greater FDI is location advantages. Before investing, foreign companies will choose a suitable location to gain comparative advantages stemming from lower resource costs. Finally, internalization advantages are another factor that can influence where investors decide to invest. Their cost might be reduced if they operate from a distinct market location. They may need to work with local producers. FDI can also relate to three factors: market seeking, resource seeking, and efficiency-seeking. Multinational Corporations (MNCs) will find countries that have a large market size, good market growth and high income per capita. MNCs may also choose countries to invest in because of more abundant and cheap natural resources to reduce costs. Another important reason is that they seek efficiency to maximize their profits.
Other than that, different theoretical approaches have been proposed to study the mechanisms in which corruption influences FDI. Both theoretical and empirical work provides mixed conclusions. One side suggests that corruption can positively impact the inflow of foreign investment, arguing that unlawful practices can help overcome excessive bureaucracy and burdensome regulations by facilitating the inflow of investment (B. A. Karim et al., Citation2018; Quazi et al., Citation2014). For these scholars, dishonest dealings, fraud, bribery, or other corrupt practices function to “speed money” and lower transaction costs investment (Belloumi & Alshehry, Citation2021). The impact on investment inflows can also be positive in cases where palm-greasing increases the efficiency of public services, lowers process time and cost of transactions, or even influences policymakers to reverse or turn around unfavourable situations caused by existing regulations (Helmy, Citation2013). In line with Acemoglu and Verdier (Citation1998), corruption can produce a more optimal allocation of resources in conditions where there are market failures. Corruption is seen as greasing the wheels, better known as the helping hand theory. This is highly likely in emerging countries where there are high levels of bureaucracy and overregulation, at the same time as high economic growth and investment inflows.
On the other hand, corruption is seen as harming investment inflows. It leads to an increase in the cost of doing business, lowers the efficiency of resources, creates uncertainty, and causes suboptimal allocation of resources (Belloumi & Alshehry, Citation2021). Corruption lowers the capacity of productive investment and reduces profitability. It raises the cost of operating in foreign markets as investors need to pay additional fees to obtain permits, licenses, or run businesses (Alshehry, Citation2020; Gasanova et al., Citation2017). In a way, corruption turns into an additional tax that foreign investors need to pay, distorting markets (Luu et al., Citation2018). Similarly, a higher level of uncertainty introduced by a poor rule of law, weak institutions, and increased persistence of corruption, discourage investors (Alshehry, Citation2020; Azam et al., Citation2019). For these researchers, corruption sands the wheels, better known as the grabbing hand theory.
Other theoretical approaches consider political models, market models, and institutional approaches to assess the impact of corruption on FDI inflows as noted in Tag and Degirmen (Citation2022). To explain the effect of corruption on FDI, this study employs the grabbing hand and helping hand theory, aiming at providing new evidence of the corruption—FDI nexus in the context of the ASEAN+3 region.
4. Methodology
This study investigates the impacts of corruption and environmental degradation on FDI in ASEAN+3 countries, namely Malaysia, Thailand, Singapore, Vietnam, the Philippines, Indonesia, China, South Korea and Japan. This study employs the Autoregressive Distributed Lag (ARDL) from 1995 to 2020. Data on FDI, inflation, trade openness, environmental degradation, market size, infrastructure and corruption were extracted from the World Bank and countryeconomy.com. The model specification is as follows:
where lnFDI is the log of FDI inflows (% of GDP), lnGDP is the log of real gross domestic product (GDP) to represent market size, lnCPI is the log of consumer price index to represent inflation, lnCOR is the log of corruption perception index to represent corruption, lnCO2 is the log of total CO2 emissions to represent environmental degradation, lnINF is the log of mobile cellular subscriptions (per 100 people) to represent infrastructure, and lnTRADE is the log of trade (% of GDP). All of the variables are transformed into the logarithms to explain our results in a percentage form.
Based on EquationEquation 1(1)
(1) , GDP is expected to have a positive impact on FDI. Higher economic growth or a larger market size indicates great development with a higher return on investment that can spur more inflows of FDI into the nation. COR is also expected to have a positive impact on FDI. Corruption Perceptions Index denoted by COR refers to an index that countries score on the perceived levels of government corruption. The scores range from zero to 100, with zero indicating a high level of corruption and 100 indicating a low level. At a higher corruption perception index, the country is said to have better governance and fewer corruption cases as the government address the issue of corruption seriously. TRADE is also expected to have a positive relationship with FDI. Greater trade means sufficient supplies of raw materials and the opportunity to export their products abroad. This can convince foreign investors to invest in the country as they can gain higher profits from their investment. CO2 is could have a positive or a negative impact on FDI. Higher CO2 indirectly indicates less stringent environmental policies practices by the country, thus allowing foreign investors to increase their investment in the targeted economies without worrying about additional costs to reduce emissions from its production. On the other hand, high CO2 emissions can discourage investors who are environmentally concerned or investors who see high CO2 as a country without appropriate sustainable policies. CPI is expected to have a negative impact on FDI. It indicates that with a higher level of CPI, the country’s cost of production is more expensive, thus demotivating foreign investors to invest in the country. Lastly, INF is also expected to have a positive impact on FDI. Having better infrastructures is crucial in the eyes of investors in deciding whether to invest as it will affect their operation.
Based on the theories and previous studies, we develop a conceptual framework as shown in Figure . It is worth noting that the decision to invest in a specific destination can be influenced by many factors. According to Dunning (Citation2006, Citation2015), the determinants can be grouped into three areas; institutional and legal framework factors, business facilitation, and economic determinants. Institutional factors include pollical-economic stability, rule of law, standards, foreign policy, and other factors. Business facilitation often include incentives offered to investors, promotion activities, social capital, among others. Economic determinants capture the orientation-motivation of investors towards market factors, resources, efficiency, or strategic asset seeking. Market size, inflation, infrastructure, and environmental degradation can be considered as proxies for economic determinants, while corruption and trade openness ca approximate institutional and legal framework factors. As noted in Dunning (Citation2006) to undertake investment, ownership, location, and internationalization advantages must be met.
Figure 4. Conceptual framework.
4.1. Panel unit root tests
Before conducting a panel ARDL test, a panel unit root test must be performed. This study uses panel data that covers many years (T) and a small number of countries (N). Thus, a panel unit root test is important to check the stationarity of data. The unit root tests based on LLC and IPS are carried out as they can be used in the presence of heterogeneity and robustness in panel data analysis. The equation for the panel unit root tests is as follows:
whereby Y is the selected variable, i is country, t is year, is the individual fixed effect and is selected to cause the residuals to be uncorrelated over time. After the stationary of the variables is identified, the panel ARDL approach can be used.
4.2. Cointegration test
This study employs the panel cointegration test introduced by Pedroni (Citation1999) to examine the cointegrating relationship among the variable. This test is important to check the stability of the long-run relationship among the relevant panel regressors. There are four panel statistics, particularly panel v-statistic, panel rho-statistic, panel PP-statistic and panel ADF-Statistic, and three group panel statistics, namely group rho-statistic, group PP-statistic and group ADF-statistic, to examine whether there is cointegration. The equation is as follows:
4.3. Panel ARDL
Recently, studies in dynamic panel data analysis involving cross-sectional data and time-series data have become increasingly popular (Z.A. Karim et al., Citation2016). Hence this paper aims to empirically examine the impact of corruption and environmental degradation on FDI using the panel ARDL approach introduced by Pesaran et al. (Citation1999). In comparison with other methods, such as GMM, that require N to be larger than T, the panel ARDL approach is more suitable as it requires T to be larger than N. This study uses a 22-year period of data (T) and 9 countries (N). Data used in this study is a panel data set from the ASEAN+3 countries from 1995 to 2020. This study focuses on seven variables, namely corruption perception index, consumer price index, GDP, FDI, trade, infrastructure and CO2 emissions. The ARDL panel technique is chosen to examine the long-term and short-term correlations between the variables. The error correction model (ECM) identifies the short-term dynamics.
This method is one of the alternative methods to examine cointegration other than Johansen and Juselius (Citation1990) and the well-established Johansen (Citation1988). Nevertheless, the panel ARDL approach is selected over the panel Johansen cointegration approach due to several additional advantages. The common cointegration approach examines long-term correlations in the equation system in its context, but the ARDL panel approach uses the form of individual briefing equations. The panel ARDL approach can be used to estimate EquationEquation (1)(1)
(1) regardless of whether I (0), I (1), or a combination of I (0) and I (1). Furthermore, the panel ARDL model with various variables, as in EquationEquation (2)
(2)
(2) , can incorporate different lags, which is not feasible when using the conventional cointegration tests. Using the panel ARDL approach, long-term and short-term coefficients are simultaneously estimated (Alsaleh & Abdul-Rahim, Citation2019). Finally, the ARDL model can be employed with a limited sample size of data. In EquationEquation (2)
(2)
(2) , the well-known ARDL panel production function consists of short-run and long-run estimations that can be used for the boundary test method is shown as follows:
where i = 1, …, n indicates the country, t = 1, …, T indicates the time, k,l,m,n,o,p,q represents the optimum lag length and is the random term. The equation with the symbol ∑ represents the short-run estimation while the equation without it represents a long-run estimation. The panel ARDL approach cannot be used if N is larger than T. In this study T is larger than N, and thus it is suitable to estimate the impacts of corruption and environmental degradation on FDI. In EquationEquation (2)
(2)
(2) , the hypotheses follow the normally made about the parameters, errors, and regressors’ homogeneity. Table summarizes the variables used in this study. The panel cointegration test is conducted to confirm the existence of a long-run relationship between determinants (Othman et al., Citation2018). The hypothesis below is formed to examine the long-term cointegration correlation between the proposed variables.
Table 1. Selected variables
(There is no cointegration)
(There is cointegration)
The hypothesis that “there is no cointegration” can be examined and compared with the hypothesis that “there is cointegration” by applying the F-test. As noted above, the cointegration approach allows to include in the model either I(0), fully I(1), or a mixture of I(0) and I(1); the number of estimators; and either the model has a trend, intercept, or both. The test uses the panel ARDL bound test, which depends on whether the factors are purely I(0), purely I(1), or a combination of I(0) and I(1). If the F-statistic exceeds I(1), we reject the null hypothesis and conclude that there is a cointegration correlation. If the F-statistic is below I(0), we cannot reject the null hypothesis, and if the F-statistic falls between the I(0) and I(1), it is inconclusive. If there is a long-term correlation between the variables, the long-term and short-term coefficients in EquationEquations (3)(3)
(3) and (Equation4
(4)
(4) ) can be estimated simultaneously:
The error correction term (ECT) is written as shown in EquationEquation (4)(4)
(4) . The parameter
shows the coefficient of the ECT in EquationEquation (5)
(5)
(5) and can examine the speed of adjustment for the factors to achieve equilibrium. The additional symbol ∆ indicated in the 1st variation factor. Furthermore, the coefficient provides inputs observing the long-term correlation between the factors in EquationEquation (5)
(5)
(5) .
5. Findings
This study uses the panel ARDL approach proposed by Pesaran et al. (Citation1999) to estimate the impacts of corruption and environmental degradation on FDI. It is important to check the stationarity of the data on seven variables, namely corruption perception index, CO2 emissions, consumer price index, GDP, FDI and Trade. There are many approaches for unit root tests, but the LLC and IPS approaches are employed in this study, and the results are reported in Table . The findings of the test unit root tests reveal that all the variables are stationary at the first difference for both approaches. Therefore, it can be concluded that the variables are integrated in mixed order. Thus, the ARDL approach can be used in this study to examine the impacts of corruption and environmental degradation on FDI inflows.
Table 2. Panel unit root tests results
Table shows the results of the panel cointegration test with and without trends. The results show that out of seven statistics, four statistics are significant. Therefore, this can be concluded that there is a co-integrating relationship between the variables. Next, the panel ARDL test is conducted to investigate the short-run and long-run effects of corruption and environmental degradation on FDI.
Table 3. Panel co-integration results
Table shows the results of the long-run effects of market size, inflation, corruption, trade openness, and environmental degradation on FDI. Our primary research objective is to examine the relationship between corruption, environmental degradation and FDI.
Table 4. Long-run and short-run estimation results
The results show that corruption can have a significant effect on FDI. The coefficient of corruption is 0.5660, and it is significant at 1%, implying that a 1% rise in the corruption perception index can increase FDI inflows by 0.57%. This result supports the grabbing hand hypothesis. This suggests that a lower level of corruption can pave the way for investors to invest in the ASEAN+3 countries easily. Reduced corruption is commonly associated with improving the business environment by lowering the cost of doing business, reducing uncertainty, and allowing a more efficient allocation of resources (Belloumi & Alshehry, Citation2021). Lower corruption incidence thus encourages investment inflows. Our results are similar to the findings of Alshehry (Citation2020) in the MENA region, those of Luu et al. (Citation2018) who found that corruption discourages mergers and acquisitions (131 countries), and Gasanova et al. (Citation2017). Our results suggest that in the ASEAN+3 countries, corrupt practices sand the wheels of investment. Improvements in transparency, the rule of law, and efficient processing of permits can then help the ASEAN+3 region to attract larger amounts of FDI. Substantial effort in improving institutional quality has been made in the ASEAN, reflected in the improvement of investors regarding corruption (See, Figure ).
Regarding the link between CO2 emissions and FDI, our results show that environmental degradation positively impacts FDI in the long run. The coefficient of environmental degradation is 1.2716, and it is significant at 1%, indicating that a 1% increase in CO2 emissions may lead to a rise of 1.27% in FDI inflows in the ASEAN+3. This means that the rise in FDI in the ASEAN countries has been accompanied by increased CO2 emissions, suggesting that the region may lack strict environmental regulations. Figure depicts CO2 emissions in the ASEAN+3. China’s carbon dioxide emissions expanded at a compound annual growth rate (CAGR) of 4.8% from 1995 to 2020. CO2 emissions of the ASEAN countries also snowballed, as shown in the case of Vietnam (9%), Malaysia (4.1%), and Indonesia (3.4%).
Regarding the additional FDI determinants introduced in our model, the results indicate that market size can positively influence FDI inflows in the long run. This means that foreign investors are attracted to invest in countries with a large market size. The coefficient of market size is 1.6606, indicating that a 1% rise in market size can increase FDI inflows by 1.67%. Our findings are similar to the evidence provided by Asongu et al. (Citation2018) and Ngo et al. (Citation2020), suggesting that investors may be motivated by the seeking market hypothesis. MNCs may be attracted by the large market size of the ASEAN+3, the rapid good market growth (4.6% CAGR from 1995 to 2020), and the increasing income per capita.
The results also show that inflation can negatively impact FDI inflows. The coefficient of inflation is −2.9873, suggesting that a 1% rise in inflation can reduce FDI inflows by 2.99% in the long run. Our findings are similar to the results of Suleiman et al. (Citation2015) and Kumari and Sharma (Citation2017), signalling that high inflation (often a proxy for macro-economic stability and risk associated with capital invested) is a deterrent for foreign investors. Earlier studies in fast-growing developing countries (Asongu et al., Citation2018) found that inflation was positively associated with FDI as investors were probably less affected by price uncertainty (before 2011). However, we argue that as emerging ASEAN+3 countries had lowered their speed of growth in the last decade (after 2010), the role of price stability is more relevant for emerging countries.
Besides, trade openness can negatively impact FDI. The coefficient of trade openness is −0.9686, and it is significant at 1%, suggesting that a 1% increase in trade openness can cause FDI to decrease by 0.97% in the long run. Our findings are similar to the conclusion of Mudiyanselage et al. (Citation2021), which also reveals a negative relationship between trade openness and FDI inflows in Romania. However, our estimate is different from most previous findings, such as Zaman et al. (Citation2018), Seyoum et al. (Citation2013), and Asongu et al. (Citation2018). This means that an increase in trade openness in the ASEAN+3 countries is associated with decreasing FDI inflows. Several reasons can support these findings. First, foreign investors may be more interested in destinations aimed at export centres when they offer low costs. As the ASEAN+3 countries face increasingly high costs (most notably Japan and South Korea, and more recently China), this will reduce FDI inflows. Second, investment motivations in the ASEAN+3 region seem to be increasingly directed towards market seeking approach. Third, the ASEAN+3 expanded its trade as % of GDP at a 0.7% CAGR from 1995 to 2009. However, from 2010 to 2020, trade as % of GDP raised at −1.1%, pointing out a change in the region’s trade pattern.
Although previous studies (i.e., Boğa, Citation2019) have supported that better infrastructure can attract more investors in developing regions, our results do not provide significant support for previous studies. A possible explanation refers to the decreasing rate of expansion of infrastructure, which experienced rapid growth in the 1995–2010 period (CAGR of 25%), but then a slowdown in the 2011–2020 period (CAGR of 2.5%). The results suggest that the region may need new infrastructure ventures to attract FDI through competitive infrastructure. Our findings have important implications for regional infrastructure projects (i.e., China’s Belt and Road initiative). Meng et al. (Citation2022) supported that new infrastructure can potentially drive economic growth and serve as an agent of industrial upgrade in China (and Asia). However, the impacts are in the long run, suggesting that a new infrastructure model is required. Table also shows the results of the short-run effects of market size, inflation, environmental degradation, corruption, and trade openness on FDI. The results disclose that all independent variables do not significantly impact FDI in the short run. The coefficient of ECT is 0.5958 and significantly negative. This suggests the existence of a long-run relationship among the variables.
Table shows the results of the short-run effects of market size, inflation, environmental degradation, corruption, infrastructure, and trade openness on FDI in specific countries. Market size can have a positive impact on FDI inflows in Singapore only. This suggests that Singapore, the only developed country in ASEAN, has proven that its market size can attract more MNCs to invest in the country. The manufacturing sector contributes the largest share of its GDP. It has various policies to boost its economic growth, including bringing many foreign workers into the country. There are mixed findings on the relationship between corruption and FDI inflows in specific countries. The result in Vietnam supports the grabbing hand hypothesis, suggesting that a higher perception of the corruption index can reduce FDI inflows. Vietnam’s corruption perception index is lower than 50 and perceived as more corrupt, making it easy for foreign investors to invest in the country in the presence of high corruption. Despite its policy to reduce corruption, the corruption perceptions index decreased in 2020 from 37 to 36, suggesting that the practice of corruption is still rampant, paving the way for higher investment. In contrast, the Philippines, Japan, and South Korea support the helping hand hypothesis, indicating that a higher level of corruption can increase FDI inflows. Corruption likely rises in Japan and South Korea due to overregulation and stringent laws. The corruption index has deteriorated in recent years for Japan and the Philippines.
Table 5. Short-run country-specific results
There is a positive connection between trade openness and foreign direct investment in Vietnam, which experienced the most rapid expansion in trade among ASEAN countries. Vietnam’s cooperation with other economies in trade has significantly increased, suggesting that its policy on trade liberalization has successfully attracted more FDI inflows. On the contrary, there is a negative relationship between trade openness and foreign investment in Japan. When there is economic cooperation between ASEAN and the Plus Three countries, many investors are interested in investing in countries other than Japan, such as Singapore and China. Hence, FDI inflows in Japan are lower than outflows. The results also show a negative nexus between infrastructure and FDI in the cases of the Philippines, Singapore, Vietnam, and South Korea. Among the ASEAN+3 countries, environmental degradation has a negative relationship with FDI inflows only for the Philippines but a positive relationship with FDI inflows in Vietnam. This suggests that less stringent environmental regulations in Vietnam have led to an increase in FDI inflows in Vietnam. The country has just revised its law on environmental protection in January 2022, indicating more stringent regulations. Inflation is found to have no significant impact on FDI inflows in the ASEAN+3 countries.
6. Conclusions and policy recommendations
This study aims to examine the impacts of corruption and environmental degradation on FDI in the six largest economies of Southeast Asia (ASEAN—Vietnam, Indonesia, Malaysia, the Philippines, Singapore, Thailand) and their three largest trade partners (China, Japan, and South Korea). The panel ARDL is employed to analyze data ranging from 1995 to 2020. Specifically, we examine whether the effect of corruption on FDI inflows in the ASEAN+3 follows the grabbing hand or the helping hand theory. The grabbing hand theory predicts that corruption deters investment. The helping hand theory suggests that FDI may increase even when a country faces high levels of corruption. Additionally, we test the effect of environmental degradation on FDI.
Due to the mixed findings on corruption, we find evidence of the grabbing hand hypothesis as results disclose that a decrease in corruption can boost FDI inflows in the long run. Therefore, this study contributes to shedding light on the findings that there is a negative relationship between corruption and FDI. Therefore, it is imperative to improve institutional quality, transparency, the rule of law, and other anti-corruption practices in order to boost investment inflows in the ASEAN+3. Lower corruption may reduce the cost of doing business and lower uncertainty and risk. The results also show that FDI has been accompanied by an increase in CO2 emissions, suggesting that environmentally friendly investment should be promoted and that environmental regulations may be lacking. The ASEAN+3 may have been attracting investment that has implications for sustainability.
Furthermore, the results show that inflation significantly and negatively impacts FDI in the long run, suggesting that macro-economic stability is becoming increasingly important for the region. Investors seem to follow the market-seeking approach, as market size positively impacts FDI. Contrary to what is generally supported in the literature, trade openness has a negative effect on FDI, likely as the ASEAN+3 has decreased its share of trade to total GDP in the last decade. Similarly, we do not find empirical evidence of the role of infrastructure as a driver of FDI, likely as the ASEAN+3 needs more diverse investments in infrastructure.
The results in single countries are mixed in the short run, suggesting that further studies may look in-depth into specific cases in the ASEAN+3 countries. More notably, we found evidence of the grabbing hand hypothesis in Vietnam, and a helping hand hypothesis for Japan, South Korea, and the Philippines, indicating that corruption has a positive nexus with FDI inflows. Trade openness can positively impact FDI inflows in Vietnam but negatively impact FDI inflows in Japan. The Philippines, Singapore, Vietnam, and South Korea face a negative link between infrastructure improvement and FDI in the short run. However, those countries may see the opposite effect in the long run.
The findings of this study, especially on environmental degradation, can significantly contribute to the body of literature as little attention has been given in the previous studies. Additionally, the findings can help policymakers formulate appropriate policies to increase FDI and thus spur economic growth more sustainably. The results suggest that it is important to continue combating corruption in the region, and therefore monitoring and enforcement should be improved to ensure that corruption can be avoided. The effective mitigation of corruption at all levels can in the ASEAN+3 countries could encourage more foreign investment inflows. Deterrent mechanisms (i.e., punishment, incentives to whistle blowers, transparency, stringent accountability and scrutiny, among others) should be considered a warning to would-be offenders. Giving incentives to whistle-blowers can encourage more citizen participation to report on corruption. Mitigating corruption and fostering a compliance-friendly environment in the ASEAN+3 countries is important and needs to be sustained in order to boost the confidence of investors to continuously invest in the region. Due to the results revealing that environmental degradation can boost FDI, environmental regulations, such as carbon taxes and carbon pricing, might reduce FDI. The ASEAN+3 countries may consider supporting more renewable energy sources, such as hydro biofuel, among others, to eliminate the current nexus between environmental degradation and FDI. The ASEAN region should increase its target of 35% renewable energy by 2025 to 50% to reduce environmental degradation significantly.
Disclosure statement
No potential conflict of interest was reported by the author(s).
Additional information
Funding
References
- Acemoglu, D., & Verdier, T. (1998). Property rights, corruption and the allocation of talent: A general equilibrium approach. The Economic Journal, 108(450), 1381–19. https://doi.org/10.1111/1468-0297.00347
- Alsaleh, M., & Abdul-Rahim, A. S. (2019). Financial development and bioenergy consumption in the EU28 region: Evidence from panel auto-regressive distributed lag bound approach. Resources, 8(1), 44. https://doi.org/10.3390/resources8010044
- Alshehry, A. S. (2020). The impact of corruption on FDI in some MENA countries. International Journal of Applied Economics, Finance and Accounting, 7(1), 39–45. https://doi.org/10.33094/8.2017.2020.71.39.45
- Asongu, S., Akpan, U. S., & Isihak, S. R. (2018). Determinants of foreign direct investment in fast-growing economies: Evidence from the BRICS and MINT countries. Financial Innovation, 4(1), 1–17. https://doi.org/10.1186/s40854-018-0114-0
- Azam, M., & Hassan, S. (2013). Corruption, workers remittances, FDI and economic growth in five South and South East Asian countries: A panel data approach. Middle-East Journal of Scientific Research, 15(2), 184–190.
- Azam, M., & Khan, A. Q. (2017). Growth-corruption-health triaca and environmental degradation: Empirical evidence from Indonesia, Malaysia, and Thailand. Environmental Science and Pollution Research, 24(19), 16407–16417. https://doi.org/10.1007/s11356-017-9299-4
- Azam, M., Nawaz, M. A., & Riaz, M. (2019). Does corruption and terrorism affect foreign direct investment inflows into Pakistan. Journal of Managerial Sciences, 13(2), 85–97. https://www.qurtuba.edu.pk/jms/default_files/JMS/13_3/09.pdf
- Baek, J. (2016). A new look at the FDI–income–energy–environment nexus: Dynamic panel data analysis of ASEAN. Energy Policy, 91, 22–27. https://doi.org/10.1016/j.enpol.2015.12.045
- Bakhsh, S., Yin, H., & Shabir, M. (2021). Foreign investment and CO2 emissions: Do technological innovation and institutional quality matter? Evidence from system GMM approach. Environmental Science and Pollution Research, 28(15), 19424–19438. https://doi.org/10.1007/s11356-020-12237-2
- Belloumi, M., & Alshehry, A. S. (2021). The causal relationships between corruption, investments and economic growth in GCC countries. SAGE Open, 11(4), 21582440211054425. https://doi.org/10.1177/21582440211054425
- Boğa, S. (2019). Determinants of foreign direct investment: A panel data analysis for Sub-Saharan African countries. EMAJ: Emerging Markets Journal, 9(1), 80–87. https://doi.org/10.5195/emaj.2019.175
- Canare, T. (2017). The effect of corruption on foreign direct investment inflows: Evidence from a panel of Asia-Pacific countries. The changing face of corruption in the Asia Pacific (pp. 35–55). Elsevier. https://doi.org/10.1016/B978-0-08-101109-6.00003-4
- Castro, C., & Nunes, P. (2013). Does corruption inhibit foreign direct investment? Política. Revista de Ciencia Política, 51(1), 61–83. https://doi.org/10.5354/0716-1077.2013.27418
- Chandran, K., Possumah, B. T., & Akhir, N. H. (2021). Impact of corruption on Foreign Direct Investment (FDI) in Malaysia. Turkish Online Journal of Qualitative Inquiry (TOJQI), 12(10), 2178–2188. https://www.tojqi.net/index.php/journal/article/view/7787/5534
- Chattopadhyay, A. K., Rakshit, D., Chatterjee, P., & Paul, A. (2022). Trends and Determinants of FDI with Implications of COVID-19 in BRICS. Global Journal of Emerging Market Economies, 14(1), 43–59. https://doi.org/10.1177/097491012110670
- Coban, O., & Yussif, A. B. (2019). relationships between economic growth, foreign direct investment and inflation: ARDL models approach for the case of Ghana. Eurasian Research Journal, 1(2), 7–23. https://dergipark.org.tr/en/pub/erj/issue/47886/605465
- Dang, V. C., Nguyen, Q. K., & Borz, G. (2021). Determinants of FDI attractiveness: Evidence from ASEAN-7 countries. Cogent Social Sciences, 7(1), 2004676. https://doi.org/10.1080/23311886.2021.2004676
- Demenaa, B. A., & Afesorgborb, S. K. (2020). The effect of FDI on environmental emissions: Evidence from a meta-analysis. Energy Policy, 138(2020), 111192. https://doi.org/10.1016/j.enpol.2019.111192
- Dogan, E., & Wong, K. N. (2020). Sources and channels of international knowledge spillovers in ASEAN‐5: The role of institutional quality. Journal of International Development, 32(4), 470–486. https://doi.org/10.1002/jid.3464
- Dong, B., Gong, J., & Zhao, X. (2012). FDI and environmental regulation: Pollution haven or a race to the top? Journal of Regulatory Economics, 41(2), 216–237. https://doi.org/10.1007/s11149-011-9162-3
- Dunning, J. H. (1979). Explaining changing patterns of international production: In defence of the eclectic theory. Oxford Bulletin of Economics and Statistics, 41(4), 269–295. https://doi.org/10.1111/j.1468-0084.1979.mp41004003.x
- Dunning, J. H. (2006). Towards a paradigm of development: Implication for the determinants of international business activity. Transnational Corporations, 15(1), 173–227. https://unctad.org/system/files/official-document/iteiit20061_en.pdf#page=183
- Dunning, J. H. (2015). The eclectic paradigm as an envelope for economic and business theories of MNE activity. In P. J. Buckley, P. Ghauri (Eds.), International Business Strategy (1st Ed., pp. 60–84). Routledge. https://doi.org/10.4324/9781315848365
- Esquivias, M. A., & Harianto, S. K. (2020). Does competition and foreign investment spur industrial efficiency?: Firm-level evidence from Indonesia. Heliyon, 6(8), e04494. https://doi.org/10.1016/j.heliyon.2020.e04494
- Esquivias, M. A., Sugiharti, L., Rohmawati, H., Rojas, O., & Sethi, N. (2022). Nexus between technological innovation, renewable energy, and human capital on the environmental sustainability in emerging asian economies: A panel quantile regression approach. Energies, 15(7), 2451. https://doi.org/10.3390/en15072451
- Gasanova, A., Medvedev, A. N., & Komotskiy, E. I. (2017). The assessment of corruption impact on the inflow of foreign direct investment. AIP Conference Proceedings 1836, 020011. https://doi.org/10.1063/1.4981951
- Haldar, A., & Sethi, N. (2021). Effect of institutional quality and renewable energy consumption on CO2 emissions− an empirical investigation for developing countries. Environmental Science and Pollution Research, 28(12), 15485–15503. https://doi.org/10.1007/s11356-020-11532-2
- Handoyo, R. D., Sugiharti, L., & Esquivias, M. A. (2021). Trade creation and trade diversion effects: The case of the ASEAN plus six free trade area. Buletin Ekonomi Moneter Dan Perbankan, 24(1), 93–118. https://doi.org/10.21098/bemp.v24i1.1163
- Hasan, M., Rahman, M. N., & Iqbal, B. A. (2017). Corruption and FDI inflows: Evidence from India and China. Mediterranean Journal of Social Sciences, 8(4–1), 173–182. https://doi.org/10.2478/mjss-2018-0088
- Haseeb, M., & Azam, M. (2021). Dynamic nexus among tourism, corruption, democracy and environmental degradation: A panel data investigation. Environment, Development and Sustainability, 23(4), 5557–5575. https://doi.org/10.1007/s10668-020-00832-9
- Helmy, H. E. (2013). The impact of corruption on FDI: Is MENA an exception? International Review of Applied Economics, 27(4), 491–514. https://doi.org/10.1080/02692171.2012.752445
- Huang, Y., Chen, F., Wei, H., Xiang, J., Xu, Z., & Akram, R. (2022). The impacts of FDI inflows on carbon emissions: Economic development and regulatory quality as moderators. Frontiers in Energy Research, 9, 820596. https://doi.org/10.3389/fenrg.2021.820596
- Jaiblai, P., & Shenai, V. (2019b). The determinants of FDI in Sub-Saharan Economies: A study of data from 1990–2017. International Journal of Financial Studies, 7(3), 1–31. https://doi.org/10.3390/ijfs7030043
- Jan, M. S., Ali, S., & Ali, A. (2019). Does corruption affect foreign direct investment: Evidence from East Asian countries. Review of Economics and Development Studies, 5(3), 479–486. https://doi.org/10.26710/reads.v5i3.700
- Johansen, S. (1988). Statistical analysis of cointegration vectors. Journal of Economic Dynamics & Control, 12(2–3), 231–254. https://doi.org/10.1016/0165-1889(88)90041-3
- Johansen, S., & Juselius, K. (1990). Maximum likelihood estimation and inference on cointegration—with applications to the demand for money. Oxford Bulletin of Economics and Statistics, 52(2), 169–210. https://doi.org/10.1111/j.1468-0084.1990.mp52002003.x
- Karim, B. A., Karim, Z. A., & Nasharuddin, M. N. (2018). Corruption and Foreign Direct Investment (FDI) in ASEAN-5: A Panel Evidence. Economics and Finance in Indonesia, 64(2), 145–156. http://efi.ui.ac.id/index.php/efi/article/download/594/595
- Karim, Z. A., Ramli, N. H., & Khalid, B. (2016). Penentu aliran pelaburan portfolio asing di Malaysia: Suatu kajian panel ARDL. Jurnal Ekonomi Malaysia, 50(1), 3–14. https://doi.org/10.17576/JEM-2016-5001-01
- Kennedy, P. S. J. (2018). The effect of corrupt behavior on the flow of foreign direct investment to Indonesia. Asia Pasific Fraud Journal, 3(1), 153–162. http://repository.uki.ac.id/id/eprint/1406
- Krifa-Schneider, H., Matei, J., & Sattar, A. (2022). FDI, corruption and financial development around the world: A panel non-linear approach. Economic Modelling, 110(2022), 105809. https://doi.org/10.1016/j.econmod.2022.105809
- Kumari, R., & Sharma, A. K. (2017). Determinants of foreign direct investment in developing countries: A panel data study. International Journal of Emerging Markets, 12(4), 658–682. https://doi.org/10.1108/IJoEM-10-2014-0169
- Luu, H. N., Nguyen, N. M., Ho, H. H., & Nam, V. H. (2018). The effect of corruption on FDI and its modes of entry. Journal of Financial Economic Policy, 11(2), 232–250. https://doi.org/10.1108/JFEP-05-2018-0075
- Magbondé, G. K., Konté, M. A., & Shafiullah, M. (2022). Developing countries’ economic fundamentals and FDI inflows: The moderating role of institutions. Cogent Economics & Finance, 10(1), 2028976. https://doi.org/10.1080/23322039.2022.2028976
- Masron, T. A., & Subramaniam, Y. (2018). The environmental Kuznets curve in the presence of corruption in developing countries. Environmental Science and Pollution Research, 25(13), 12491–12506. https://doi.org/10.1007/s11356-018-1473-9
- Meng, J., Zhu, Y., & Han, Y. (2022). Can ‘new’infrastructure become an engine of growth for the Chinese economy? Journal of Chinese Economic and Business Studies, 1–22. https://doi.org/10.1080/14765284.2022.2036571
- Moustafa, E. (2021). The relationship between perceived corruption and FDI: A longitudinal study in the context of Egypt. Transnational Corporations, 28(2), 97–129. https://doi.org/10.18356/2076099x-28-2-4
- Ngo, M. N., Cao, H. H., Nguyen, L. N., & Nguyen, T. N. (2020). Determinants of foreign direct investment: Evidence from Vietnam. The Journal of Asian Finance, Economics and Business, 7(6), 173–183. https://doi.org/10.13106/jafeb.2020.vol7.no6.173
- Nizam, K., & Liaqat, O. (2022). Corruption economic growth and foreign direct investment in bric countries. Palarch’s Journal of Archaeology of Egypt/Egyptology, 19(3), 100–116.
- Omodero, C. O. (2019). Effect of corruption on foreign direct investment inflows in Nigeria. Studia Universitatis Vasile Goldiş, Arad-Seria Ştiinţe Economice, 29(2), 54–66. https://doi.org/10.2478/sues-2019-0008
- Onody, V. D. S. M., Carvalho, A. C. G. D., Polloni-Silva, E., Roiz, G. A., Mariano, E. B., Rebelatto, D. A. N., & Moralles, H. F. (2022). Corruption and FDI in Brazil: Contesting the “Sand” or “Grease” Hypotheses. Sustainability, 14(10), 6288. https://doi.org/10.3390/su14106288
- Opoku, E. E. O., Acheampong, A. O., Dzator, J., & Kufuor, N. K. (2022). Does environmental sustainability attract foreign investment? Evidence from developing countries. Business Strategy and the Environment. https://doi.org/10.1002/bse.3104
- Othman, A. H., Aziz, H. A., & Kassim, S. (2018). Identification of macroeconomic determinants for diversification and investment strategy for Islamic unit trust funds in Malaysia. Ijoem, 13(4), 653–675. https://doi.org/10.1108/IJoEM-03-2017-0074
- Pedroni, P. (1999). Critical Values for Cointegration Tests in Heterogeneous Panels with Multiple Regressors. Oxford Bull Econ & Stats, 61(s1), 653–670. https://doi.org/10.1111/1468-0084.0610s1653
- Pesaran, M. H., Shin, Y., & Smith, R. P. (1999). Pooled mean group estimation of dynamic heterogeneous panels. Journal of the American Statistical Association, 94(446), 621–634. https://doi.org/10.1080/01621459.1999.10474156
- Quazi, R., Vemuri, V., & Soliman, M. (2014). Impact of corruption on foreign direct investment in Africa. International Business Research, 7(4), 1–10. https://doi.org/10.5539/ibr.v7n4p1
- Rahman, A. R. A., Shaari, M. S., Masnan, F., & Esquivias, M. A. (2022). The impacts of energy use, tourism and foreign workers on CO2 emissions in Malaysia. Sustainability, 14(4), 2461. https://doi.org/10.3390/su14042461
- Rathnayaka Mudiyanselage, M. M., Epuran, G., & Tescașiu, B. (2021). Causal Links between Trade Openness and Foreign Direct Investment in Romania. Jrfm, 14(3), 90. https://doi.org/10.3390/jrfm14030090
- Seyoum, M., Wu, R., & Lin, J. (2013). Foreign direct investment and trade openness in sub-Saharan economies: A panel data granger causality analysis. South African Journal of Economics, 82(3), 402–421. https://doi.org/10.1111/saje.12022
- Sodik, J., Sarungu, J. J., Soesilo, A. M., & Rahayu, S. A. T. (2019). The determinants of foreign direct investment across provinces in Indonesia: The role of market size, resources, and competitiveness. Jurnal Ekonomi Malaysia, 53(3), 141–152. https://doi.org/10.17576/JEM-2019-5303-11
- Suleiman, N. N., Kaliappan, S. R., & Ismail, N. W. (2015). Determinants of foreign direct investment: Empirical evidence from Southern Africa Customs Union (SACU) countries. International Journal of Economics & Management, 9(1), 1–24. http://www.ijem.upm.edu.my/vol9no1/1.%20Determinants%20of%20Foreign%20Direct%20Investment.pdf
- Tag, M. N., & Degirmen, S. (2022). Economic freedom and foreign direct investment: Are they related? Economic Analysis and Policy, 73, 737–752. https://doi.org/10.1016/j.eap.2021.12.020
- Vidya, C. T., & Taghizadeh-Hesary, F. (2021). Does infrastructure facilitate trade connectivity? Evidence from the ASEAN. Asia Europe Journal, 19(1), 51–75. https://doi.org/10.1007/s10308-021-00614-6
- Zaman, Q. U., Donghui, Z., Yasin, G., Zaman, S., & Imran, M. (2018). Trade openness and FDI inflows: A comparative study of Asian countries. European Online Journal of Natural and Social Sciences, 7(2), 386–396. https://european-science.com/eojnss/article/view/5289
- Zander, T. (2021). Does corruption matter for FDI flows in the OECD? A gravity analysis. International Economics and Economic Policy, 18(2021), 347–377. https://doi.org/10.1007/s10368-021-00496-4