
 ?Mathematical formulae have been encoded as MathML and are displayed in this HTML version using MathJax in order to improve their display. Uncheck the box to turn MathJax off. This feature requires Javascript. Click on a formula to zoom.
Abstract
The Sar-Cov-2 pandemic that began in 2019 has significantly affected the global economy and, in particular, those of African countries. This paper analyzes possible intervention channels by African states to put their economies back on a sustainable growth path once the health crisis is under control. The paper proposes workable macroeconomic channels for these countries’ recovery from post-pandemic periods by using historical data to conduct empirical analyses. The paper employs World Bank data and ILOSTAT for 54 African countries within the period 1990–2018. We use a post-Keynesian framework and the difference and system generalized method-of-moments to show that wages drive African economic dynamics in the short run. This is particularly true for Sub-Saharan African countries. In addition, foreign output, proxied by European Union output, has a positive and significant impact on Sub-Saharan African economies in the short and long run. The results highlight strategic policy measures for recovering African economies, including improving wages and deepening international economic relations, particularly with the Eurozone countries.
PUBLIC INTEREST STATEMENT
The search for appropriate strategies by developing countries, specifically African countries, is not new. Political and military unrest, socio-economic inequalities, and lagging development are the aspects on which policymakers focus their attention. Still, beyond that, Africa is a continent in full mutation with very encouraging economic growth prospects. In this context, the Sar-Cov-2 pandemic that started in 2019 constitutes a factor that slows down the efforts made in the past few years. This research analyzes and proposes possible intervention channels for African states to put their economies back on a sustainable growth trajectory once the health crisis is under control. We show that wages drive African economic dynamics in the short run and that foreign production, represented by European Union production, has a positive and significant impact on sub-Saharan African economies in the short and long run. Our results point to strategic measures for recovering African economies, including improving wages and deepening international economic relations, particularly with eurozone countries.
1. Introduction
On Wednesday, 19 March 2020, as the Covid 19 pandemic took a deplorable toll on human life in Asia and began on the European continent, the World Health Organization (WHO) sounded the alarm on the death of the first person from the coronavirus in Sub-Saharan Africa. The WHO then called on authorities to prepare for the worst and most significant economic downturn (Havrlant et al., Citation2021; Maliszewska et al., Citation2020). Therefore, it appeared necessary to implement the required measures. On the one hand, Governments implemented sanitary measures to avoid a hecatomb. On the other hand, Governments implemented economic measures (social measures such as offering free treatments to affected citizens and cash transfers) to help the most vulnerable populations survive the time of the State of Emergency decreed everywhere on the continent (Addison et al., Citation2020; Dang et al., Citation2021; Sodokin, Citation2021). Despite global efforts in the same direction, economic activity still seemed at a standstill worldwide, with much uncertainty about the future (Altig et al., Citation2020). In this regard, the challenge has been to find the funding necessary to strengthen health care structures and secure the income required for people to survive (K. Liu, Citation2021). These measures are, in our view, very positive and commendable on the part of African governments to counter the short-term cycle of the pandemic. In practice, pandemic funds have been set up throughout Africa. Beyond the measures favoring vulnerable populations, companies should also benefit from tax cuts, tax exemption for donations, and suspension of tax audits.
The States have gradually begun to control the health crisis with the vast vaccination campaigns underway, which involve an increase in public debt and questions related to recovery strategies for sustainable economic resilience for African countries. However, economic growth forecasts remain less optimistic for African countries, especially Sub-Saharan Africa (SSA). The first estimates for April 2021 gave a growth rate of 3.4% in SSA countries against 6% worldwide (International Monetary Fond, Citation2021a). The International Monetary Fund predicts a recovery for all SSA countries after 2022, and only then could the production level in these countries return to the 2022 level (International Monetary Fond, Citation2021a).
This health crisis raises questions about public strategies for recovering African economies, particularly SSA countries. The question then arises of identifying possible macroeconomic channels for transmitting public plans for economic recovery. The International Monetary Fund proposes such avenues as changes in employment, credit, digital transformation, broad and equitable sharing of gains, and strengthening social security systems (International Monetary Fond, Citation2021b). In summary, the recovery from such a crisis period, whose economic effects are similar to that of the 2008 crisis, calls for targeted and effective intervention in terms of attractiveness, securing national and international private investment, and promoting employment and wage. These interventions make sense because of their relative importance to the different components of aggregate demand (Lavoie & Stockhammer, Citation2013; Palley, Citation2017).
Based on the above developments on recent issues (International Monetary Fond, Citation2021a, Citation2021b) and previous works (Bhaduri & Marglin, Citation1990; Lavoie & Stockhammer, Citation2013; Oyvat et al., Citation2018), the main question in this paper is what main macroeconomic channels for relaunching growth dynamics in Africa in this period of a health crisis are? Specifically, the study seeks to answer two under-addressed questions in the literature. It first looks at whether African economies are wage-led or profit-led to help to identify which pro-labor or pro-capital growth strategy should be prioritized now and through the post-pandemic period. Secondly, we look at how demand from China, the EU, or the US influences the output level in Africa. To answer these questions, we need a framework in which the overall impact of wage/profit share changes on growth determines whether a regime is profit-led or wage-led. A popular approach to identifying these regimes has been considering the functional income distribution in the literature. This distributional pattern shows how the output is divided between the factors of production, especially capital and labor. Despite the vast existing theoretical literature and some empirical works that have been done (Bhaduri & Marglin, Citation1990; Dünhaupt, Citation2013; Oyvat et al., Citation2018), no specific studies have been carried out on African countries. Our paper tries to fill this gap while proposing workable solutions for these countries to recover from post-pandemic periods by using historical data to conduct empirical analyses. On this note, we have organized the remainder of the paper into four sections: Section 2 provides a brief review of the literature; section 3 introduces a simple income distribution model; section 4 presents the econometric method, the data and discusses the regression results; and finally, section 5 concludes.
2. A brief review of the literature
The current health crisis has undoubtedly brought back into the discussion the need for policies to stimulate economic growth after almost all countries recorded very low or even negative growth rates in 2020 (International Monetary Fond, Citation2021a, Citation2021b). The question of the response of growth stimulus mechanisms themselves is not new. Harrod (Citation1939), Domar (Citation1946, Citation1947), and Kaldor (Citation1955) focused attention on the role of income distribution in the economic growth mechanism. These authors explain a link between the decline in wage share and the prevalence of financial crises in developed and developing countries. These authors emphasize the relationship between income distribution between wages and profits and economic growth (Piketty, Citation2014). Formally the effect of income distribution on demand has been modeled by Dutt (Citation1984), Taylor (Citation1985), Blecker (Citation1989), and extended by Bhaduri and Marglin (Citation1990) and Palley (Citation2017). These authors show whether European governments can generate higher growth while maintaining a more equitable income distribution using wage- or profit-based demand regimes. They investigate whether a coordinated wage policy, used at a multi-country level, could be a solution for Europe in keeping wages under control better than the European wage restraint strategy (Bhaduri & Marglin, Citation1990). The analysis also focuses on the medium- to long-term links between distribution and economic growth. As a result, various interventions can be used to influence income distribution when referring to long-run correlations. These include strengthening unions, improving unemployment benefits, and promoting financial regulation. The authors show that the wage share is not an instrument but an aggregation of all these interventions (Lavoie & Stockhammer, Citation2013).
From an econometric point of view, several studies have analyzed the relationship between demand components and economic growth. Barbosa-Filho and Taylor (Citation2006) and Carvalho and Rezai (Citation2016), using VAR and TVAR (threshold vector autoregressive) models, respectively, find that profit is the engine of the United States of America economy. Bowles and Boyer (Citation1995) tested the impact of wages on each component of Gross Domestic Product at the level of five (developed) countries. They found that profit is the engine of economic growth.
Baccaro and Pontusson (Citation2016) develop an analytical approach of comparative political economy to show from data from the United Kingdom, Sweden, Germany, and Italy that economic growth is driven by the different components of aggregate demand: exports and household consumption. In the same dynamic, D. Liu (Citation2020) has shown in a non-linear model with regional disparities that economic growth in Eastern China is slightly driven by profits, while wages drive the Chinese hinterland.
Several other authors have tried to show that the effect of domestic demand through wage dynamics could be transitory (Blanchard & Quah, Citation1989; Fazzari et al., Citation2020; Yılmaz, Citation2015). Even in this hypothetical case where multiple equilibrium points can be found at lower or higher levels, Nikiforos and Foley (Citation2012) show that the United States of America’s economy depends on the level of the wage share, and wages drive capacity utilization. Yılmaz (Citation2015) shows from Turkish data that the economic growth regime can be caused by wages or profits depending on whether the economic dynamics are sensitive to the combined effect of consumption and investment or export and import. Gurara and Ncube (Citation2013) have shown in a global vector autoregression model (GVAR) that African economies experience a significant spillover effect from the growth of the Eurozone and BRIC economies.
Finally, according to the local and international component of demand and their impact on economic growth, these issues are still to be addressed for African economies in a robust analysis and according to the new macroeconomic environment with the health crisis. For instance, a few studies on South Africa found that historically South African economic growth is profit-driven and argue that an increase in wages could adversely affect economic growth (Malikane & Chitambara, Citation2017; Onaran & Galanis, Citation2012). The main goal of this paper is to overcome this challenge in a simple wage, profit, and foreign output-driven growth model.
3. A simple model of wage/profit share and foreign output as drivers for economic growth
We follow the previous works (Bhaduri & Marglin, Citation1990; Naastepad, Citation2006; Oyvat et al., Citation2018) to establish the relationship between profit share , wage share, foreign output, and a country’s domestic total output
. Bhaduri and Marglin’s (Citation1990) modeling framework provides practical tools based on distributive scrap and the principle of effective demand deriving different demand and growth regimes. Bhaduri and Marglin’s (Citation1990) model includes several approaches to the analysis of economic growth, including the profit-oriented methods of the new growth theory (Aghion & Howitt, Citation2009; Barro & Sala-i-Martin, Citation2004; Lucas, Citation1988; Romer, Citation1986), and from the classical Marxian model to the neo-Kaleckian model of wage-driven demand and growth (Kaldor, Citation1957, Citation1961; Kalecki, Citation1939, Citation1969; Robinson, Citation1956, Citation1962), with an intermediate regime of wage-driven demand and profit-driven growth (Hein, Citation2017). The difference between the Bhaduri and Marglin (Citation1990) model and growth theories based on supply-side neoclassical assumptions is the conception of the economy in terms of dynamics based on technical progress and factor growth (Hartwig, Citation2014). The Bhaduri and Marglin (Citation1990) model is, therefore, a post-Keynesian model that allows us to study and discusses the conditions that would drive the African post-pandemic economic recovery.
We begin with the expression of the production in an open economy:
Where: is the private consumption,
the private investment,
the government expenditures on goods and services,
the export, and
the import. We follow the literature to outline and describe plausible determinants that control the right-hand side (see López-Gallardo and Reyes-Ortiz, Citation2011; Oyvat et al., Citation2018).
Below, we will discuss the impact of changes in on each demand component in detail. To begin with, let us rewrite Equationequation (1)
(1)
(1) in the following way:
For simplicity, government expenditures are omitted since is part of
as we will soon elaborate, and
is exogenous to
, i.e.,
do not influence G. From (2), we expect
to have adverse effects and positive effects on
and
.
Workers and capitalists earn wages and profits in the economy, respectively. Both factors share the total income . Suppose we define total wage as the compensation of workers
, a fraction of total income, and total profit as the residual. In that case, the total wage equals total income minus total profit. In other words, total income is the sum of total profits
and total wage payments
. Based on these details, we can express them as:
Following (3), the Keynesian consumption function can be written as:
Where: is the autonomous consumption and
and
the marginal propensities to consume by capitalists and workers, respectively. The impact of
on
is negative in practice since a higher profit share diminishes the wage share, and a lower wage share implies less desire for consumption. This is verified in the literature (Alarco, Citation2016; Obst et al., Citation2017) and is consistent with Keynes (Citation1936), who considers that workers tend to spend more on consumption than capitalists on investment.
Investment and other functions are defined following Blecker, (Citation1989) and Naastepad (Citation2006). The private investment function is in the form:
Investment has a positive response to all the variables except interest rate. Greater total demand would increase capacity utilization and stimulate investment. Similarly, higher profit shares would have a direct positive effect on investments. The improving business confidence, as well as credit to the private sector, would also encourage investment. By contrast, investment is inversely related to interest rates for two main reasons. Firstly, if interest rates rise, the opportunity cost of investment rises. This means that an increase in interest rates increases the return on funds deposited in an interest-bearing account or makes a loan, reducing investment attractiveness relative to lending. Hence, investment decisions may be postponed until interest rates return to lower levels. Secondly, if interest rates rise, firms may anticipate that consumers will reduce their spending, and the benefit of investing will be lost. Funding to expand requires that consumers at least maintain their current spending. Therefore, a predicted fall will likely discourage firms from investing and force them to postpone their investment decisions.
In the next step, we express export as a function of foreign demand, profit share, and exchange rate:
An increase in is equivalent to domestic currency depreciation, therefore
. A higher wage share resulting from a rise in wage reduces the international competitiveness of domestic firms by increasing the unit cost of labor relative to the unit cost of labor in the trading partner countries. Conversely, profit share would favor domestic export, i.e.
(Hein, Citation2017; Onaran & Obst, Citation2016).
Lastly, we similarly define import as export, except that import depends on domestic output rather than foreign output, in which case:
Imports price increases following currency depreciation which means demand for foreign goods decreases. A higher profit share implies a lower wage share, and this also causes a decline in demand for foreign products
From the equations above, we can derive the impact of profit share on the percentage change in output as:
Let’s assume the term (the change in aggregate demand concerning total output) is less than unity, and the Keynesian stability condition holds, i.e.,
. This means that the sign of
will only depends on the numerator. The growth regime in the economy will be wage-driven if
. To estimate the value of
, there are usually two possible ways. The first method is the structural approach used to estimate the individual components of
using separate econometric equations for C, I, X, and M. In this approach, the sign of
is then obtained by summing the various partial derivatives for consumption, investment, export, and import. Wage-divers hold if:
In other words, wage-driven growth implies that the rising profit share’s negative impact through the gap in marginal propensities to consume is larger than its positive effect through investment, exports, and imports. The regime will be profit-driven otherwise. The second method, or the aggregative approach, estimates the following reduced form of the output equation:
In this case, the derivative or
is calculated directly by regressing output Y on the profit or wage share and other control variables, including various lags (Blecker, 2016). Wage-driver holds if:
It is worth noting that both structural and aggregative approaches only aim to estimate the slope of the demand relationship in (2) without considering possible simultaneity bias. Wage share is often endogenous to growth to obtain demand from a simultaneous equation (AD = AS). To address the endogeneity bias, Equationequation (10)(10)
(10) is usually estimated using a systems approach such as the cycle model developed by Barbosa-Filho and Taylor (Citation2006) or the well-known dynamic panel GMM-SYS (see Arellano & Bond, Citation1991; Arellano & Bover, Citation1995; Holtz-Eakin et al., Citation1988; Roodman, Citation2009).
Using one of these methods, we can prove that African economies are wage-led. According to Keynes (Citation1936), poor populations spend a higher share of their income on consumption, a proposition supported empirically in recent literature (Alarco, Citation2016; Obst et al., Citation2017; Onaran & Obst, Citation2016). We also know that the necessary condition in (9) for wage-ledness is:
Condition (12) explicitly shows that the propensity to consume is more significant for workers than capitalists, suggesting that African economic growth is more likely to be wage-led. This is because, on the one hand, Africa is a worker-abundant continent. On the other hand, it is a region where one in three people still live below the global poverty line, i.e., around 70% of the world’s poorest people (Hamel et al., Citation2019; Kharas et al., Citation2018).
4. Method, data variables, and descriptive analysis
Econometrics Models and estimation methods
We use the difference and system generalized method-of-moments (GMM-SYS) estimators to test our hypothesis. The GMM-SYS can be attributed to many scholars (Arellano & Bond, Citation1991; Arellano & Bover, Citation1995; Blundell & Bond, Citation1998; Holtz-Eakin et al., Citation1988). The GMM-SYS is designed for panel data analyses with “small T, large N,” i.e., a few periods and many individuals (T < N). It is suitable to analyze independent variables that are not strictly exogenous or, for instance, independent variables correlated with past and current realizations of the error. We begin with a data-generating process without strictly exogenous variables; an autoregressive specification of the form:
Following Roodman (Citation2009), we can also express the increased level equation as:
Based on Arellano and Bond (Citation1991), we assume the disturbance terms have finite moments so that
. We assume an absence of serial correlation but not necessarily independence over time. With these assumptions, values of
lagged two periods or more will be valid instruments in the equations in the first differences, in which case at least
. The first difference transformation removes the individual effect, therefore:
We aim to find the optimal estimator for first. Arellano and Bond suggest that the condition
should be satisfied. All
may imply an unstable dynamic, accelerating divergence away from equilibrium values (Arellano & Bond, Citation1991; Blundell & Bond, Citation1998). These hints are crucial conditions in addressing potential biases in our estimations.
Following Roodman’s (Citation2009) approach, We begin with the classical OLS estimator applied to Equationequation (12.1)(12)
(12) and then modify it step by step to address the abovementioned concerns, ending with our estimators of interest. Notably, two different estimators will help create a range for a credible
. The first is the pooled OLS estimator
, and the second is the within-group fixed effects (FE) estimator
. Thus, we are looking for an estimator that satisfies previous conditions
and additionally
where:
and
For different reasons, OLS and FE estimators cannot be used a priori for inference. The problem with Equationequation (12.1)(12)
(12) after running regression using OLS is that
is correlated with the fixed effects in the error term, which, according to Nickell (Citation1981), will give rise to the “dynamic panel bias” issue. So the next attempt is to deal with the fixed effects by drawing them out of the error term. This is done by entering dummies for each unit and running the regression. But again, the within-group fixed effects estimator will not eliminate the dynamic panel bias (Bond & Windmeijer, Citation2002; Nickell, Citation1981). Furthermore, the least squares dummy variables (LSDV) suggested by Kiviet (Citation1995) do not solve the problem because the approach fails to work for unbalanced data and addresses the potential endogeneity of other regressors.
We first transform Equationequation (12.1)(12)
(12) into (13) to work around the endogeneity problem. By doing so, the fixed effects are gone. But despite removing them, the lagged dependent variable will still be potentially endogenous due to the term
in
which it is correlated with
in
. Similarly, any predetermined variables in
that are not strictly exogenous become potentially endogenous because they too may be related to
.
We can address the above situations by finding valid instrumental variables (IVs) within or outside and inserting them back into the model. As we previously elaborated, we are using the GMM-SYS, which will circumvent the finite sample bias, allowing the stationarity assumption on the initial conditions of the data generating process. In this case, the moment conditions and those specified in Equationequation (12)(12)
(12) are
. We use lagged first differences of the dependent variable to construct the orthogonality conditions for Equationequation (12.1)
(12)
(12) error term in levels. To deal with the issue of the “too many instruments,” We follow Roodman (Citation2009) by presenting results with a collapsed instrument matrix with Stata command xtabond2. The command automatically generates statistics for the Arellano and Bond (Citation1991) first/second-order autocorrelation and the Sargan and Hansen tests for over-identification restrictions.
(2) Data, variables, and descriptive analysis
The sample is selected following the condition T < N, with T = 29 years (1990–2018) and N = 54 countries (all African countries except the Sahrawi Arab Democratic Republic, see Appendix). The definition of variables (Table ) and the choice of proxies are based on data availability. The variables, expected signs, and correlation matrix of the summary statistics are described in Table , Table , and Table .
Table 1. Aggregate factors and their determinants
Table 2. Variables and expected sign
Table 3. Descriptive statistics
Table 4. Correlation matrix
Output (Y) is proxied by the nominal GDP to suit the context of the study. It is known that central banks or governments have resorted to expansionary fiscal policies to stimulate their economies since the Sars-Cov-2 has been declared pandemic (Szmigiera, Citation2021). As a result, many countries have inflated their nominal GDP through stimulus. Targeting nominal GDP instead of real value, which considers inflation, has been debated since the 2008 financial crisis. In a policy note by Hallett et al. (Citation2015) from the Policy Department of the European Parliament, it is argued that targeting nominal GDP has several advantages. First, nominal GDP is a real-time indicator; thus; (i) it allows to target output fluctuations since variation in nominal GDP directly is equivalent to the sum of nominal and real changes in overall economic activity; (ii) the level of nominal GDP is also the relevant indicator for assessing debt sustainability; and finally, (iii) nominal GDP is a less volatile aggregate, unlike the consumer price index which is highly sensitive to the impact of exogenous factors such as oil prices, entirely outside the control of a central bank. A critical lesson from the subprimes and the COVID shock is that policies focusing on real GDP can disrupt spending, worsen unemployment, and slow recovery. In evaluating stability and welfare performance drawn on the New Keynesian model with unemployment, analyses regarding nominal GDP targeting have also appeared in recent studies (Bhandari & Frankel, Citation2017; Billi, Citation2020).
Next, we have proxied foreign demand (YF) by either EU’s GDP (YEU), China’s GDP (YCHN), or US GDP (YUS), as these three economies remain the world’s top heavyweights in terms of demand for consumption, especially for African countries.
Wage share (ω) is the GDP paid in wages, salaries, and benefits or the part of national income allocated to labor compensation (ILO, OECD Citation2015). Due to the lack of data on labor compensation, we have proxied wage share by “wage and salaried workers, total (% of total employment).” The “wage and salaried workers, total (% of total employment) is defined as the fraction of workers who hold paid employment jobs, where the incumbents have explicit (written or oral) or implicit employment contracts that give them a basic remuneration (ILOSTAT, Citation2021). All things being equal, a change in this indicator drives wage share in the same direction. This can be understood following the expression of wage share as:
Here, the total wage is obtained by multiplying individual wages
by the number of wage and salaried workers in the economy
. By deriving
concerning
, holding
, and
constant, we have
. This means that the wage share will increase (respectively decrease) when the number or the fraction of wage and salaried workers increases (respectively decreases).
Recent works have documented that since the 80s, wage share in national income has fallen worldwide (Rodriguez and Jayadev, Citation2010; Dünhaupt, Citation2013). It’s then argued that this decline may be due to technological change that increased the productivity of capital and high-skilled labor and globalization and the role of neoliberalism, financialization, and the reduction in workers’ bargaining power. The latter argument seems to be consistent with the choice of our proxy, whereby job losses, especially in advanced countries due to globalization, have pushed wage share downward in those economies. By contrast, large-scale offshoring of routine tasks from developed to developing countries has likely created reverse effects, allowing these countries to see a rise in wage and salaried employment. This appears to be true in Africa (see Figure below).
Figure 1. Average wage share, all Africa (%) Source: authors.
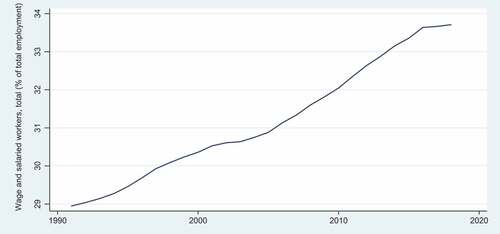
The figure shows that, on average, Africa has seen a steep increase in the fraction of workers who hold paid employment jobs during the last three decades. This development opposes wage share trends, which have declined globally within the same period (Rodriguez and Jayadev, Citation2010; Dünhaupt, Citation2013). Since workers, especially in the least developed countries (LDCs), are more inclined to spend on consumption and not on investment, it is expected that the rise in wage and salaried employment in Africa will increase effective demand.
We introduce the remaining variables as controls in the regressions. For private credit (Cr), we use domestic credit by banks (% of GDP) to the private sector. This proxy refers to financial resources provided to the private sector by depository corporations (except central banks). Credit drives investment which in turn has the same effect on output. Finally, we consider the model’s interest rate (R) and government spending (G) exogenous. Government revenue, in our case, is composed of tax revenue (H) and other local taxes (O). Since they are exogenous, changes in H and O are not explained by changes in Y or any of its components, thus the expected negative impact. As described in Equationequation (5)(5)
(5) , the adverse effects of interest rate (R) will be transferred to output through investment. Here, the interest rate is captured by adjusting the lending interest rate for inflation. A high rate means demand for credit is high, then money will, all other things being equal, move from consumption to savings.
Conversely, demand will move from savings to investment and consumption when the interest rate is low. Other variables, including profit share and business confidence, are dropped due to missing data. The correlation matrix is resumed in Table and indicates a perfect positive linear correlation between the variables.
Graphs (1) and (2) of Figure provide a clear view of the disparities in the development of wage share among African countries. A first note as we look at (1) is that, despite the upward trends which reflect the overall tendency shown in Figure , the performance of the majority still lies under the mean value. This may be why the average performance remains low (see Figure ). Graph (2) shows a strikingly high distance from the mean as we single out two countries with the lowest and highest shares (respectively, Chad and Libya). These remarks may explain the significant standard deviation value in wage share (Table ).
Figure 2. Wage share in Africa: trends and disparities (%) Source: authors.
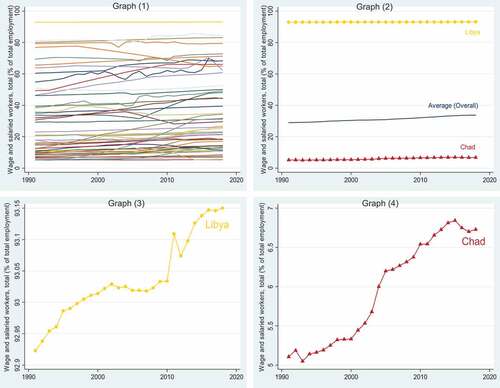
Plot separately (Graphs 3 and 4); the two extreme entities of the panel (Libya and Chad) also follow the upward trend observed in Figure . We suspect the very high rate in Libya to be related to the absence or the low practice of capitalism, while the shallow rate in Chad may be due to corruption and poor distribution of national income. However, the growing share in these two countries and many others on the continent indicate that the demand for consumption may be rising too; and this will similarly affect their domestic outputs.
(3) Regression results and discussion
For the empirical analysis, the dependent variable is the nominal GDP characterized by the macroeconomic aggregate factors as in Equationequation (2)(2)
(2) , but in the presence of the government.
Following the logic in Equationequation (10)(10)
(10) , we further reduce Equationequation (17)
(17)
(17) to the form:
Based on (13) and (18), our benchmark level equation in the econometric form can be expressed as:
By keeping the key and control variables as earlier mentioned, the regression model proposed in Equationequation (10)(10)
(10) can be written as:
4.0.1. Result 1: Benchmark models
In the benchmark models (Table and Table ), it can be noticed that the coefficients are positive and less than unity, respectively. The estimates in [1] are obtained in both cases by projecting
on its first lag
. In [2], the regression is run using the level equation for which year dummies are also controlled. Similarly, the same projection is made to obtain [3] and [4] but by adding the second and the third lags of the dependent variable, respectively (see eq. 1’). We have created four potential ranges for the estimator
based on these results. The first range (without control) is not used in the following steps, but the second (0.816; 0.923), the third (0.911; 0.954), and the fourth (0.888; 0.997) have guided the choice of credible coefficients.
Table 5. Pooled OLS model
Table 6. Within-group FE model
4.0.2. Result 2: GMM-SYS models
The model with instrumental variables is formulated to cope with the endogeneity problem as follows:
The definition of the variables is summarized in Table .
Table 7. Variables definition
With the GMM-SYS overall (Table ), some crucial remarks emerged. First, all the coefficients are displayed with an expected sign for all the variables of interest. Next, the necessary tests were performed, including the Arellano-Bond test for AR (1) and AR (2) in first differences; the Sargan and Hansen tests of over-identification restrictions, and the number of instruments that is less than the number of groups, implying that the models do not suffer from misspecifications. Thirdly, the estimator values indicate that the accurate coefficients appear in the last two columns. We have both one-step
and two-step
. These observations, especially the positive and highly significant sign on ω, suggest that wages drive the dynamics of African economies. The result seems to be valid only when the pairing involves the EU.
Table 8. GMM-SYS, overall (YF = YEU)
Assuming households, firms, and governments are indebted, the results suggest that higher wages could translate into dynamic demand and growth. According to Keynes (Citation1936), poor populations spend a higher share of their income on consumption, a proposition supported empirically in recent literature (Alarco, Citation2016; Obst et al., Citation2017; Onaran & Obst, Citation2016). By estimating the impact of wage share on different countries, the authors found that a higher wage share increases consumption.
The results are not significant when matched with the Gross Domestic Production of the United States (Table ) and China (Table ). These two countries have been trying to accelerate their economic relationship in recent years with African countries before the beginning of the Sars-Cov-2 pandemic. These results suggest, in our view, that there are still opportunities for African countries to seek productivity gains in the US and China through aggressive and pragmatic economic diplomacy for now and in the post-pandemic period.
Table 9. GMM-SYS, overall (YF = YCHN)
Table 10. GMM-SYS, overall (YF = YUS)
4.0.3. Result 3. Robustness check: GMM-SYS models with restrictions
4.0.3.1. Considering the regional context of SSA
Despite the restrictions, signs of the estimates remain unchanged (Table ). Specification tests and the number of reported IVs indicate that the models are well-specified. As before, it can be noted that the good range of estimators is in the last two columns. The coefficient on ω is still positive and significant in the credible range. The meaningful positive sign of the wage share suggests that African countries have had labor-dependent growth dynamics historically. Some authors argue (Lavoie & Stockhammer, Citation2013; D. Liu, Citation2020) that if the labor share increases in an economy where labor is a competitive advantage, the economy’s growth will gain due to solid demand.
Table 11. GMM-SYS, Sub-Saharan Africa (YF = YEU)
The last but crucial remark is that the positive impact of the variable Log(YEU) is now significant. This result suggests that in addition to positive wage dynamics, the other source of available demand, exports of goods and services, would help accelerate the recovery process for African countries. In the same perspective, Awokuse (Citation2008) finds that real GDP growth is determined by international trade and labor for Latin American countries. Bekaert et al. (Citation2020) also suggest that aggregate demand may be, among other factors, one of the most critical drivers for economic recovery in the United States of America context.
In Tables , Log(YCHN) and Log(YUS) are still positive and negative but non-significant. This restriction could not apply to non-SSA (see appendix for non-SSA countries) countries as the criteria of small T Large N (T < N) would have been violated.
Table 12. GMM-SYS, Sub-Saharan Africa (YF = YCHN)
Table 13. GMM-SYS, Sub-Saharan Africa (YF = YUS)
4.0.3.2. Considering time dimension
The other possible restrictive approach we considered was to look at the time dimension taking as reference the year 2008, where the most notable financial shock occurred throughout the studied period. But, compared with the previous results, these models have performed very poorly when paired with the EU (Table ).
Table 14. GMM-SYS, pre/post-2008 crisis periods
The first observation is that the estimates remain positive despite a change in magnitude before and after the crisis. Second, the effects of wage share have decreased while EU GDPs have risen in the post-crisis period. The other remark is that only the estimate of EU GDP is statistically significant in the pre-crisis period for a two-step regression. But how valid are these results? The specification tests show that the estimates may be biased. The first two column outputs suggest that the estimator belongs to the good range. However, we failed to reject the Arellano-Bond AR (1)’s no autocorrelation null hypothesis and to accept the IVs’ Hansen validity assumption. In the last two columns, the estimator
is not only out of range but also greater than one. These findings suggest that the 2008 financial shock has negatively impacted African economies despite their strong trade connection with the EU countries, as shown in previous results.
There are several plausible reasons why the crisis does not seem to directly explain the level of output in Africa. First, the financial networks in most African economies are weakly webbed domestically and with global partners. This situation makes African countries less vulnerable to international financial shocks. Second, Africa’s bank account penetration rate is relatively low compared to Europe. The effect is also similar since banking is a component of the financial system. Only a tiny part of the population depends on it to carry out their economic activities.
Furthermore, the informal sector is predominant in Africa. The International Labor Organization (ILO) report estimates that around 80% to 94% of Africa’s active population is in the informal sector (Kiaga and Leung, Citation2020). Although the informal contribution is computed in national accounts, it is often poorly reported. The fraction of the informally employed is less dependent on or has no connection with banks or the financial sector. All these factors explain the apparent resilience of the continent in times of financial crises.
On the other hand, it is unlikely that African countries will face the same fate with the COVID-19 shock, a combination of health and economic crises. Contrary to the 2008 financial shock, the impacts on the real economy are felt. Economies on the continent have been harshly hit by unprecedented surging commodities and consumables prices caused by the disruption in the global supply chains. Restrictive measures such as border closure and lockdowns have also halted daily activities and prevented people from carrying out production or doing business. Such situations have prompted many governments to resort to welfare policies such as cash transfers to the people, the release of emergency food stocks, and rethink their trade strategies and development plans for an effective recovery. In the trade sector, recall that African countries enjoy export tariff cuts and free access to some significant economies around the world, such as the African Growth and Opportunity Act (AGOA) in the US and Everything But Arms (EBA) in Europe, among others). The previous results show that prolonged travel and trade bans in Europe can cause further losses for African economies.
4.0.4. Result 4: Long-run effects
The long-run coefficients are only estimated for the significant short-run parameters. For the parameter, the LRE is given by:
The coefficient recalls the persistence of the lag effect. Since
is the portion of the short-run adjustment translated to the following year, the closer
to 1, the higher the persistence in the dependent variable (Bruno et al., Citation2016). Estimation results for ω and Log(YEU) are reported in Table below.
Table 15. Long-run coefficients
We checked whether the relationship holds in the long run. The coefficients are obtained for the factors that significantly impact the output in different contexts. Only ω has the expected sign in the overall model, while both ω and YEU’s estimates have the predicted sign when the sample is restricted to SSA only. The results in Table suggest that the EU’s GDP level has a long-term positive and significant impact on SSA economies. Following these findings, we can further shed light on circumstances that can make a growth regime more viable based on some preconditions (Figure ).
Figure 3. Changes in income distribution and State policy tools for regimes viability.
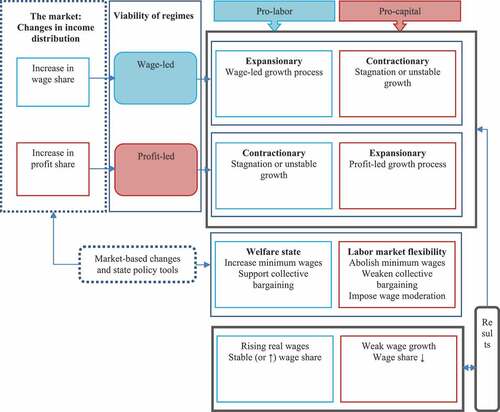
A wage-led regime will be more viable for countries seeing a consistent increase in wage share, and policymakers in such countries should pursue pro-labor strategies. Those strategies may include increasing the minimum wage or government support for collective bargaining. These interventions can result in rising wages, spur consumption and contribute to expansionary wage-led growth. Benin is a recent case where the government and labor union representatives agreed in late April 2022 to raise the minimum wage by 30%.
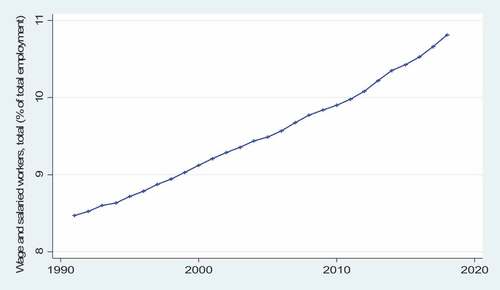
The steady rise in wage share, as shown above, and the move by the Benin government to increase the minimum wage is the sustainable approach for a wage-led regime, as in Lavoie and Stockhammer (Citation2013), which is also consistent with our findings. Similar interventions should be encouraged in many other African countries in this recovery period from the pandemic to boost demand for consumption, which can incentivize domestic firms to scale up their activities and increase production capacity. Countries that proceed otherwise, i.e., by weakening wages or suppressing collective bargaining, can stagnate or have unstable growth (Figure ). Note that wage weakening is currently observed in many countries due to inflation, but policymakers can take appropriate decisions to reverse the situation.
Figure 4. Trend in wage share, Benin (%) Source: authors.
5. Conclusion and Policy Implications
This paper examined the possible macroeconomic channels of transmission of post-pandemic recovery strategies for African economies as governments began to handle this health crisis. Our findings indicate that employment favors higher aggregate demand, suggesting that African countries would be better off pursuing pro-labor distributional policies and improving wages. In other words, the results show that enhanced wages have a significant and positive effect on increasing gross domestic production, pointing to the way forward for policy strategies for recovering African economies. Our results show that to boost consumption and build resilience to future crises, it is still crucial for these countries to create effective social protection systems around wage distribution and social transfers. Most importantly, these results suggest that macroeconomic performance can be improved through negotiations and social agreements to protect wages, profits, and jobs, even if these effects on output are likely transitory. The results also suggest that African economies, particularly Sub-Saharan Africa, have a dynamic determined by foreign trade relations with Eurozone countries. Therefore, it is reasonable to conclude that for African countries, public policies should be based on strategies to strengthen external trade relations with Eurozone countries in terms of economic recovery policy strategies in this time and the post-pandemic period.
Disclosure statement
No potential conflict of interest was reported by the author(s).
Additional information
Notes on contributors
Koffi Sodokin
Mr. Koffi Sodokin is an Associate Professor at the Faculty of Economics and Management of the University of Lome. He has over ten years of experience teaching and supervising MSc students. His research focuses on money, finance, macroeconomics, and microeconomics of development. Mr. Mawuli K. Couchoro is a Full Professor and the Dean of the Faculty of Economics and Management at the University of Lome. He has over 15 years of teaching and research experience and supervision of Ph.D. and MSc students. His research interests include money, finance, macroeconomics, and microeconomics of development. Mr. Kokou W. Tozo is a Postdoctoral Fellow at the Peking University’s Institute of New Structural Economics (INSE) in Beijing, China. He has over five years of experience in field research focused on African and Asian developing countries. His research area includes Development Economics, International Economics, Applied Econometrics and New Structural Economics.
References
- Addison, T., Sen, K., & Tarp, F. (2020). COVID-19: Macroeconomic dimensions in the developing world. WIDER Working Papers.No. 2020/74. World Institute for Development Economics Research (UNU-WIDER), United Nations University. https://doi.org/10.35188/UNU-WIDER/2020/831-3
- Aghion, P., & Howitt, P. (2009). The Economics of Growth. Cambridge. MIT Press.
- Alarco, G. (2016). Factor income distribution and growth regimes in Latin America, 1950–2012. International Labour Review, 155(1), 73–34. https://doi.org/10.1111/ilr.12006
- Altig, D., Baker, S., Barrero, J. M., Bloom, N., Bunn, P., Chen, S., Davis, S. J., Leather, J., Meyer, B., Mihaylov, E., Mizen, P., Parker, N., Renault, T., Smietanka, P., & Thwaites, G. (2020). Economic uncertainty before and during the COVID-19 pandemic. Journal of Public Economics, 191, 104274 doi: https://doi.org/10.1016/j.jpubeco.2020.104274
- Arellano, M., & Bond, S. (1991). Some Tests of Specification for Panel Data: Monte Carlo Evidence and an Application to Employment Equations. The Review of Economic Studies, 58(2), 277. https://doi.org/10.2307/2297968
- Arellano, M., & Bover, O. (1995). Another look at the instrumental variable estimation of error-components models. Journal of Econometrics, 68(1), 29–51. https://doi.org/10.1016/0304-4076(94)01642-D
- Awokuse, T. O. (2008). Trade openness and economic growth: Is growth export-led or import-led?. Applied Economics, 40(2), 161–173. https://doi.org/10.1080/00036840600749490
- Baccaro, L., & Pontusson, J. (2016). Rethinking Comparative Political Economy: The Growth Model Perspective. Politics & Society, 44(2), 175–207. https://doi.org/10.1177/0032329216638053
- Barbosa-Filho, N., & Taylor, L. (2006). Distributive and demand cycles in the US economy – A structuralist Goodwin model. Metroeconomica, 57(3), 389–411. https://doi.org/10.1111/j.1467-999X.2006.00250.x
- Barro, R. J., & Sala-i-Martin, X. (2004). Economic Growth (2nd edn ed.). MIT Press.
- Bekaert, G., Engstrom, E., & Ermolov, A. (2020). Aggregate Demand and Aggregate Supply Effects of COVID-19: A Real-time Analysis. http://dx.doi.org/10.2139/ssrn.3611399
- Bhaduri, A., & Marglin, S. (1990). Unemployment and the real wage: The economic basis for contesting political ideologies. Cambridge Journal of Economics, 14(4), 375–393. doi:10.1093/oxfordjournals.cje.a035141
- Bhandari, P., & Frankel, J. (2017). Nominal GDP targeting for developing countries. Research in Economics, 71(3), 491–506. https://doi.org/10.1016/j.rie.2017.06.001
- Billi, R. M. (2020). Unemployment fluctuations and nominal GDP targeting. Economics Letters, 188, 108970. https://doi.org/10.1016/j.econlet.2020.108970
- Blanchard, O. J., & Quah, D. (1989). The Dynamic Effects of Aggregate Demand and Supply Disturbances. American Economic Review, 79(4), 653–673. https://www.jstor.org/stable/1827924
- Blecker, R. A. (1989). International competition, income distribution and economic growth. Cambridge Journal of Economics, 13(3), 395–412. https://www.jstor.org/stable/23598124
- Blundell, R., & Bond, S. (1998). Initial conditions and moment restrictions in dynamic panel data models. Journal of Econometrics, 87(1), 115–143. https://doi.org/10.1016/S0304-4076(98)00009-8
- Bond, S., & Windmeijer, F. (2002). Projection estimators for autoregressive panel data models. The Econometrics Journal, 5(2), 457–479. https://doi.org/10.1111/1368-423X.t01-1-00093
- Bowles, S., & Boyer, R. (1995). Wages, aggregate demand, and employment in an open economy: An empirical investigation. In G. Epstein & H. Gintis (Eds.), Macroeconomic Policy after the Conservative Era: Studies in Investment, Saving and Finance (pp. 143–171). Cambridge University Press.
- Bruno, G. S. F., Choudhry Tanveer, M., Marelli, E., & Signorelli, M. (2016). The short- and long-run impacts of financial crises on youth unemployment in OECD countries. Applied Economics, 49(34), 3372–3394. https://doi.org/10.1080/00036846.2016.1259753
- Carvalho, L., & Rezai, A. (2016). Personal income inequality and aggregate demand. Cambridge Journal of Economics, 40(2), 491–505. https://doi.org/10.1093/cje/beu085
- Dang, H.-A., Lanjouw, P., & Vrijburg, E. (2021). Poverty in India in the face of Covid-19: Diagnosis and prospects. Review of Development Economics, 25(4), 1816–1837. https://doi.org/10.1111/rode.12833
- Domar, E. D. (1946). Capital Expansion, Rate of Growth, and Employment. Econometrica, 14(2), 137–147. doi:10.2307/1905364
- Domar, E. D. (1947). Expansion and Employment. The American Economic Review, 37(1), 34–55. https://www.jstor.org/stable/1802857
- Dünhaupt, P. (2013). The effect of financialization on labor’s share of income. Institute for International Political Economy Berlin Working Paper 17/2013. https://www.econstor.eu/handle/10419/68475
- Dutt, A. K. (1984). Stagnation, income distribution and monopoly power. Cambridge Journal of Economics, 8(1), 25–40. https://doi.org/10.1093/oxfordjournals.cje.a035533
- Fazzari, S. M., Ferri, P., & Variato, A. M. G. (2020). Demand-led growth and accommodating supply. Cambridge Journal of Economics, 44(3), 583–605. https://doi.org/10.1093/cje/bez055
- Gurara, D. Z., & Ncube, M. (2013). Global economic spillovers to Africa: A GVAR approach. Working Paper 183, Tunis, Tunisia: African Development Bank Group. https://www.afdb.org/fileadmin/uploads/afdb/Documents/Publications/Working_Paper_183_-_Global_Economic_Spillovers_to_Africa-_A_GVAR_Approach.pdf
- Hallett, A., Lechthaler, W., Reicher, C., Tesfaselassie, M., Blot, C., Creel, J. & Ragot, X. (2015). Is nominal gdp targeting a suitable tool for ecb monetary policy? European Parliament: Policy Department A :Economic and Scientific Policy. https://www.europarl.europa.eu/cmsdata/105463/IPOL_IDA(2015)563459_EN.pdf
- Hamel, K., Tong, B., & Hofer, M. (2019). Poverty in Africa Is Now Falling-but Not Fast Enough. Future Development. https://www.brookings.edu/blog/future-development/2019/03/28/poverty-in-africa-is-now-falling-but-not-fast-enough/
- Harrod, R. F. (1939). An Essay in Dynamic Theory. The Economic Journal, 49(193), 14–33. doi:10.2307/2225181
- Hartwig, J. (2014). Testing the Bhaduri–Marglin model with OECD panel data. International Review of Applied Economics, 28(4), 419–435. https://doi.org/10.1080/02692171.2014.896881
- Havrlant, D., Darandary, A., & Muhsen, A. (2021). Early estimates of the impact of the COVID-19 pandemic on GDP: A case study of Saudi Arabia. Applied Economics, 53(12), 1317–1325. https://doi.org/10.1080/00036846.2020.1828809
- Hein, E. (2017). The Bhaduri/Marglin post-Kaleckian model in the history of distribution and growth theories – An assessment by means of model closures. Review of Keynesian Economics, 5(2), 218–238. https://doi.org/10.4337/roke.2017.02.05
- Holtz-Eakin, D., Newey, W., & Rosen, H. S. (1988). Estimating Vector Autoregressions with Panel Data. Econometrica, 56(6), 1371. https://doi.org/10.2307/1913103
- ILO, OECD. (2015). The Labour Share in G20 Economies. Technical Report February. International Labour Organization & Organization for Economic Cooperation and Development.
- ILOSTAT. (2021). ILOSTAT Database. http://doi.org/10.23728/b2share.801f11c8d95c4e96a90d3095720110cd
- International Monetary Fond. (2021a). Regional economic outlook. Sub-Saharan Africa: Navigating a long pandemic. World economic and financial surveys. International Monetary Fund. https://www.imf.org/en/Publications/REO/SSA
- International Monetary Fond. (2021b). World Economic Outlook Update: Fault Lines Widen in the Global Recovery. World economic and financial surveys. International Monetary Fund. https://www.imf.org/en/Publications/REO/SSA
- Kaldor, N. (1955). Alternative Theories of Distribution. The Review of Economic Studies, 23(2), 83–100. https://doi.org/10.2307/1913103
- Kaldor, N. (1957). A model of economic growth. In N. Kaldor (Ed.), The Economic Journal (reprinted in ed., Vol. 67, pp. 591–624). Collected Economic Essays, Volume 2, Essays on Economic Stability and Growth. Duckworth.
- Kaldor, N. (1961). Capital accumulation and economic growth. In F. A. Lutz & D. C. Hague (Eds.), The Theory of Capital, London: Macmillan (reprinted in N. Kaldor, Collected Economic Essays (Vol. 5, pp. 177–222). Duckworth. Further Essays on Economic Theory
- Kalecki, M. (1939). Essays in the Theory of Economic Fluctuations. George Allen and Unwin.
- Kalecki, M. (1969). Studies in the Theory of the Business Cycle (pp. 1933–1939). Basil Blackwell.
- Keynes, J.M. (1936). The general theory of employment interest and money. London: MacMillan
- Kharas, H., Hamel, K., & Hofer, M. (2018). Rethinking global poverty reduction in 2019. Future Development. https://www.brookings.edu/blog/future-development/2018/12/13/rethinking-global-poverty-reduction-in-2019/
- Kiaga, A., & Leung, V. (2020). The Transition from the Informal to the Formal Economy in Africa. In Global Employment Policy Review, Background Paper No (Vol. 2). ILO. https://www.ilo.org/wcmsp5/groups/public/---ed_emp/documents/publication/wcms_792078.pdf
- Kiviet, J. F. (1995). On bias, inconsistency, and efficiency of various estimators in dynamic panel data models. Journal of Econometrics, 68(1), 53–78. https://doi.org/10.1016/0304-4076(94)01643-E
- Lavoie, M., & Stockhammer, E. (2013). Wage-led growth: Concept, theories and policies. In M. Lavoie & E. Stockhammer. (Eds.), Wage-led Growth. Advances in Labour Studies (pp. 13–39). Palgrave Macmillan. https://doi.org/10.1057/9781137357939_2
- Liu, D. (2020). Is China’s economic growth profit-led or wage-led? A reestimation incorporating investment nonlinearity, sectoral change, and regional disparity. Journal of Post Keynesian Economics, 44(1), 143–172. https://doi.org/10.1080/01603477.2020.1848436
- Liu, K. (2021). COVID-19 and the Chinese economy: Impacts, policy responses and implications. International Review of Applied Economics, 35(2), 308–330. https://doi.org/10.1080/02692171.2021.1876641
- Lopez-Gallardo, J., & Reyes-Ortiz, L. (2011). Effective Demand in the Recent Evolution of the US Economy. Levy Economics Institute Working Paper No. 673. https://doi.org/10.2139/ssrn.1864149
- Lucas, R. E. (1988). On the mechanics of economic development. Journal of Monetary Economics, 22(1), 3–42. https://doi.org/10.1016/0304-3932(88)90168-7
- Malikane, C., & Chitambara, P. (2017). Foreign direct investment, democracy and economic growth in Southern Africa. African Development Review, 29(1), 92–102. https://doi.org/10.1111/1467-8268.12242.
- Maliszewska, M., Mattoo, A., & Van Der Mensbrugghe, D. (2020). The potential impact of COVID19 on GDP and trade: A preliminary assessment. In World Bank Policy Research Working Paper. (Vol. 9211, pp. 26). The World Bank. https://ssrn.com/abstract=3573211
- Naastepad, C. W. M. (2006). Technology, demand and distribution: A cumulative growth model with an application to the Dutch productivity growth slowdown. Cambridge Journal of Economics, 30, 403–434. https://doi.org/10.1093/cje/bei063
- Nickell, S. (1981). Biases in Dynamic Models with Fixed Effects. Econometrica, 49(6), 1417. https://doi.org/10.2307/1911408
- Nikiforos, M., & Foley, D. K. (2012). Distribution and capacity utilization: Conceptual issues and empirical evidence. Metroeconomica, 63(1), 200–229. https://doi.org/10.1111/j.1467-999X.2011.04145.x
- Obst, T., Onaran, Ö., & Nikolaidi, M. (2017). The effect of income distribution and fiscal policy on growth, investment, and budget balance, FMM Working Paper 10-2017, IMK at the Hans Boeckler Foundation, Macroeconomic Policy Institute. https://www.econstor.eu/handle/10419/181468
- OECD, I.L.O. (2015). Report prepared for the G20 Employment Working Group Antalya, Turkey. https://www.oecd.org/g20/topics/employment-and-social-policy/The-Labour-Share-in-G20-Economies.pdf
- Onaran, Ö., & Galanis, G. (2012). Is aggregate demand wage-led or profit-led? National and global effects, Greenwich Papers in Political Economy (Vol. 15289). University of Greenwich, Greenwich Political Economy Research Centre. https://www.ilo.org/wcmsp5/groups/public/—ed_protect/—protrav/—travail/documents/publication/wcms_192121.pdf
- Onaran, Ö., & Obst, T. (2016). Wage-led growth in the EU15 member-states: The effects of income distribution on growth, investment, trade balance and inflation. Cambridge Journal of Economics, 40(6), 1517–1551. https://doi.org/10.1093/cje/bew009
- Oyvat, C., Öztunalı, O., & Elgin, C. (2018). Wage-led vs. profit-led growth: A comprehensive empirical analysis, Greenwich Papers in Political Economy (pp. 65). University of Greenwich.
- Palley, T. I. (2017). Wage- vs. profit-led growth: The role of the distribution of wages in determining regime character. Cambridge Journal of Economics, 41(1), 49–61. https://doi.org/10.1093/cje/bew004
- Piketty, T. (2014). Capital in the Twenty-First Century: A multidimensional approach to the history of capital and social classes. British Journal of Sociology, 65(4), 736–747. doi:10.1111/1468-4446.12115
- Robinson, J. (1956). The Accumulation of Capital. Macmillan.
- Robinson, J. (1962). Essays in the Theory of Economic Growth. Macmillan.
- Rodriguez, F., & Jayadev, A. (2010). The Declining Labor Share of Income. UNDP Human Development Research Paper. https://ideas.repec.org/p/hdr/papers/hdrp-2010-36.html
- Romer, P. M. (1986). Increasing returns and long-run growth. Journal of Political Economy, 94(5), 1002–1037. doi:10.1086/261420
- Roodman, D. (2009). How to do Xtabond2: An Introduction to Difference and System GMM in Stata. The Stata Journal: Promoting Communications on Statistics and Stata, 9(1), 86–136. https://doi.org/10.1177/1536867X0900900106
- Sodokin, K. (2021). Comparative analysis, cash transfers, household investment and inequality reduction in Togo. Applied Economics, 53(23), 2598–2614. https://doi.org/10.1080/00036846.2020.1863324
- Szmigiera, M. (2021). Impact of the coronavirus pandemic on the global economy - Statistics & Facts. Statista Research Department. https://www.statista.com/topics/6139/covid-19-impact-on-the-globaleconomy
- Taylor, L. (1985). A Stagnationist Model of Economic Growth. Cambridge Journal of Economics, 9, 383–403. https://doi.org/10.1093/oxfordjournals.cje.a035588
- Yılmaz, E. (2015). Wage or Profit-Led Growth? The Case of Turkey. Journal of Economic Issues, 49(3), 814–834. https://doi.org/10.1080/00213624.2015.1072429
Appendix 1:
Selected African countries
Appendix 2:
GMM-SYS, overall (YF = YEU)
Table
Appendix 3:
GMM-SYS, overall (YF = YCHN)
Table
Appendix 4:
GMM-SYS, overall (YF = YUS)
Table
Appendix 5:
GMM-SYS, Sub-Saharan Africa (YF = YEU)
Table
Appendix 6:
GMM-SYS, Sub-Saharan Africa (YF = YCHN)
Table
Appendix 7:
GMM-SYS, Sub-Saharan Africa (YF = YUS)
Table
Appendix 8:
GMM-SYS, pre/post-2008 crisis periods
Table
