
 ?Mathematical formulae have been encoded as MathML and are displayed in this HTML version using MathJax in order to improve their display. Uncheck the box to turn MathJax off. This feature requires Javascript. Click on a formula to zoom.
Abstract
Using the panel data vector autoregression (PVAR) model, this study examines the correlation between the stock market, gold price and USD exchange rate in the context of the COVID-19 pandemic in 55 Asian and 32 European countries from 11 March 2021 to 29 October 2021. The results of Granger causality test show that in Asian countries, there is a bidirectional causality between stock market and gold price. In addition, there is a unidirectional relationship between the stock market and the USD exchange rate, while the gold price and the USD exchange rate are completely independent of each other. Meanwhile, in European countries, stock market, gold price and USD exchange rate have a causal relationship at 1% significant level. The results of the impulse-response function analysis show that, in Asia, the stock market has a negative impact on the gold price and a positive effect on the USD exchange rate. In Europe, the stock market has a negative impact on the other two markets in the short term. The variance decomposition results suggest that, in Europe, the stock market return explains 2.5% for the gold price shock and 6.2% for the USD exchange rate shock from the tenth period. Meanwhile, these figures in the Asian countries are 1.6% and 3.2%, respectively.
1. Introduction
COVID-19, which first appeared in Wuhan, China, in early December 2019, was declared a global pandemic by the World Health Organization (WHO) on 11 March 2020 (WHO, Citation2020). Up to now, the pandemic has spread worldwide and as of 3 December 2021, there have been 263,563,622 cases of COVID-19, with 5,232,562 deaths (WHO, Citation2020). The unprecedented scale and nature of the COVID-19 pandemic crisis have created major uncertainties in the economy (Altig et al., Citation2020). Typically, its impact on the financial market in general and the global stock market, in particular, can be mentioned (Ashraf, Citation2020; Al Awadhi et al., Citation2020; Okorie & Lin, Citation2021). The stock market is considered to offer a diverse selection of investment products to investors, allowing them to diversify their portfolios and reduce risks. It gives investors an idea of what they expect for the future (Wagner, Citation2020). However, when the pandemic hit, most stock markets around the globe plunged, and international financial institutions cut growth forecasts for 2020 and beyond (Boone et al., Citation2020). Studies by Al Awadhi et al. (Citation2020), Yilmazkuday (Citation2021), Hatmanu and Cautisanu (Citation2021), and Li et al. (Citation2021) show that COVID-19 has a negative effect on stock price indexes. Liu et al. (Citation2021) even point out that an increase in the number of COVID-19 cases increases the risk of a stock market crash.
Meanwhile, the gold market’s response to the COVID-19 pandemic is in stark contrast to the stock market. For example, in the first quarter of 2020, stock market indexes in China and Japan fell about 15% and 25%, respectively, whereas international gold prices increased by almost 6% (Yousaf et al., Citation2021). Yousef and Shehadeh (Citation2020) indicate that COVID-19 has a positive impact on the volatility of gold prices. Gold prices tend to increase as the number of cases and deaths from COVID-19 increases, according to Atri et al. (Citation2021). In fact, when the fear of the COVID-19 epidemic spread, investors begin to divest from the stock market and seek a safe haven, the gold market. According to Husnul et al. (Citation2017), gold is used as an alternative investment because it tends to be risk-free and unaffected by inflationary pressures. Gold is one of the precious metals that is considered a safe asset for long-term storage because of its good durability (Robiyanto et al., Citation2017) and is an effective tool to diversify and reduce risks for an investment portfolio (Tuna, Citation2019). In this study, we are going to test whether gold is still a safe haven for investors during the COVID-19 pandemic or not.
A part of the financial market that is also affected by the COVID-19 pandemic is the foreign exchange market, typically the US dollar (Sui & Sun, Citation2016). The United States is a country heavily affected by COVID-19 when there are more than 48.7 million cases and more than 700,000 deaths (WHO, Citation2020). The USD exchange rate also fluctuates because of that. As the world’s leading foreign currency in terms of foreign exchange reserves and trade, having the greatest influence on the world, fluctuations in the US dollar exchange rate have a significant impact on the economies in the world (Siddiqui, Citation2020). Research by Wen and Cheng (Citation2018) shows that the US dollar is a safe haven for emerging stocks, but its superiority in hedging has weakened during the global financial crisis.
In this article, we use the panel data vector autoregression (PVAR) model to study the dynamic correlation between the stock market, the gold market and the US dollar exchange rate in the context of the COVID-19 pandemic, as a reference basis for investors and policymakers to make informed financial decisions. The remainder of the article is organized into the following sections. Section 2 studies the theoretical basis and overview of previous studies. Section 3 describes the data and variables. Section 4 explains the methodology. Section 5 summarizes and analyzes the empirical results of this study. Section 6 presents the conclusion and policy implications.
2. Literature review
The relationship between stock prices and exchange rates has been verified in many previous empirical studies. The traditional approach according to Dornbusch and Fischer (Citation1980) held that the relationship between stock prices and exchange rates is positive. The portfolio approach in Branson (Citation1983) demonstrated that exchange rates and stock prices have a negative relationship. The third approach considered the exchange rate as an asset in the asset market. Gavin (Citation1989) argued that the exchange rate and stock price have a weak or no relationship at all. Kim (Citation2003) and Ibrahim and Aziz (Citation2003) argued that stock prices have a negative relationship with the exchange rate. Tsai (Citation2012) used data on exchange rates and stock prices of six Asian countries from 1992 to 2009 to examine the relationship between these two variables. The study showed that an increase in stock prices will decrease the exchange rate. Research by Srinivasan and Karthigai (Citation2014) revealed that gold prices and stock prices tend to have a long-term relationship with the exchange rate in India. In contrast, Zhao (Citation2010) and Suriani et al. (Citation2015) found that there is no relationship between exchange rate and stock price. Lou and Luo (Citation2018) analyzed the causal relationship between stock indexes and exchange rates in G7 countries using the Granger causality test. The results also showed that there is no significant relationship between stock price indexes and exchange rates in these countries.
When examining the impact of gold prices on stock markets and exchange rates, the results are different. Jain and Biswal (Citation2016) showed that decrease in gold prices and crude oil prices causes fall in the value of the Indian Rupee and the benchmark stock index. Research by Arfaoui and Ben (Citation2017) indicated that gold price changes are related to stock market changes, and there is a negative relationship between US dollar exchange rate and stock market. In Pakistan, Akbar et al. (Citation2019) confirmed that stock prices and rupee value go down during recessions but gold prices rise and vice versa. Hence, gold is considered not only as a safe haven but also as an alternative investment during times of adverse volatility in the stock and foreign exchange markets of Pakistan. Also, conducting a study in the Pakistani market, Ali et al. (Citation2020) found that the exchange rate and gold price volatility have a negative impact on the daily stock market performance. Alshammari et al. (Citation2020) examined the impacts of exchange rate, oil price and gold price on the Kuwaiti stock market from 2 January 1996 to 28 September 2017 by using a wavelet analysis. The findings presented a positive relationship between the stock market and the exchange rate in all frequencies, while the price of gold has only a short-term negative relationship with the stock market during crisis period. Thus, empirical studies have revealed that the relationship between the stock market, gold price and exchange rate is still controversial and the research results are still inconsistent.
The outbreak of the COVID-19 pandemic quickly spread to most countries worldwide. When there is no vaccine to prevent the disease, one of the effective measures that countries apply to limit the impact of the pandemic is to close and ask people to stay at home. In order to have money, many investors begin to liquidate their assets, including stocks and foreign currencies. This has had a significant impact on financial markets. Ashraf (Citation2020) showed that stock market returns decreased when the number of confirmed cases increased. Research also suggested that the stock market reacts strongly in the early days of confirmed cases and then between 40 and 60 days after the announcement of the first cases. The stock market’s response also varies over time depending on the severity of the outbreak. Al Awadhi et al. (Citation2020) revealed that an increase in COVID-19 cases and deaths has a negative impact on stock market returns. Also, studying in the Chinese market, Liu et al. (Citation2021) pointed out that COVID-19 has a negative but insignificant impact on the stock market of this country. However, according to Okorie and Lin (Citation2021), the pandemic only has an impact on the stock market in the short term. Syahri and Robiyanto (Citation2020) confirmed a positive dynamic correlation between the stock price index and gold price and a negative dynamic correlation between the stock price index and exchange rate. Contrary to the above results, Samadi et al. (Citation2021) showed that under stable conditions, there is no significant co-movement between the exchange rate and gold price. However, under unstable economic conditions, such as during the COVID-19 pandemic, investors must be cautious because the results of this study show a significant co-movement between the two markets in the short, medium and long term. In China, Kumar and Robiyanto (Citation2021) found that the gold price almost has a significant influence on the remaining two markets, especially in times of financial crises such as the COVID-19 epidemic. In contrast, the dollar index has almost no impact on the price of gold or stocks in most cases. Chaudhry et al. (Citation2021) highlighted that the pandemic has a negative impact on the stock market, and during the pandemic, the gold price fluctuations have an effect on Pakistani stock market. The study also found no evidence of a relationship between the USD exchange rate and the stock market during the study period.
In summary, there are many empirical studies on the relationship between stock prices, gold prices and exchange rate with many different approaches. However, the results found in each research are controversial. Table in Appendix summarizes the studies reviewed above. Most of the studies are conducted within one or a few countries, which means the research scope is still quite narrow. No studies have been conducted by continent, or by comparison, on the relationship between variables in different markets. This is a research gap that we want to exploit in this paper.
In this research, we try to expand the scope of the study, explore the dynamic correlation of stock prices, gold prices and USD exchange rate under the impact of the COVID-19 pandemic in Asian and European countries. These are two continents hardest hit by the COVID-19 pandemic according to the WHO. In which, Europe is a long-standing developed stock market with 16 of the 32 studied countries in the group of developed market. Meanwhile, of the 23 Asian countries in the study, only 3 are in the developed market group, and the rest are in emerging or frontier markets. Will the response of research variables under the impact of the COVID-19 pandemic be the same? That is the problem that we are interested in and seek to explain. A significant contribution of the study is the application of PVAR model with GMM estimation—considered superior to other static table estimation methods because it can analyze the dynamic and static relationship between variables (Canova & Ciccarelli, Citation2013). This method is rarely used in previous studies on the relationship between stock market, gold price and exchange rate.
3. Data and variables
The study used data from 23 Asian countries and 32 European countries form 11 March 2020 (WHO first announced the global epidemic) to 29 October 2021. Variables entering the model of study are specifically described in Table :
Table 1. Variable description and source of data
4. Methodology
In this study, we use the PVAR model, which does not distinguish between exogenous and endogenous variables but instead considers all variables to be endogenous. Furthermore, each variable in PVAR depends on its past data and on all other variables, which show concurrency and equality between variables. So this is a suitable model for this research. The PVAR model to study the dynamic correlation between stock prices, gold prices and US dollar exchange rates in the context of the COVID-19 epidemic impact on Asian and European markets is as follows:
in which:
= (
is a 1 × 3 vector of endogenous variables;
is a 1 × 3 vector of lagged endogenous variables;
,
are the (kxk) vectors of the estimated coefficients;
k is the optimal lag;
are the (1xl) the exogenous vectors, including the Total COVID-19 confirmed cases (TC), the Total COVID-19 deaths (TD), the COVID-19 daily new cases (NC), Daily new COVID-19 deaths (ND), the Daily growth in total confirmed cases (DGTCC), the Daily growth in total cases of death (DGTDC);
are the matrices (lxk) of the estimated coefficients;
is the dependent variable fixed effect vector;
is a vector of idiosyncratic errors.
5. Research results
To compare the dynamic correlation between the stock market, gold prices and the USD exchange rates between the European and Asian markets in the context of the COVID-19 epidemic, we evaluated the Equationequations (1)(1)
(1) on the European and Asian data sets, respectively.
5.1. Descriptive statistics and preliminary tests
Table presents the descriptive statistics. The average values of the variables that represent the European COVID-19 including DGTCC, DGTDC, NC, ND, TC and TD are all higher than Asian countries. The average stock market return of European countries is 0.0906%, which is 0.0132% higher than Asia, while the European gold price is 8.615 (logarithm), lower than Asia, which is 11.047 (logarithm).
Table 2. Descriptive statistics of variables in the model
The PVAR model requires the data series to be stationary. We use the Augmented Dickey Fuller (ADF) test to check for the unit root in each variable. The results of unit root test are presented in Table . The results of ADF test reveal that all the variables are stationary at levels except ND, TC and TD of Europe, which are stationary at first differences. Therefore, we can perform the PVAR model.
Table 3. ADF unit root test results
5.2. Empirical results
5.2.1. Optimal lag selection
Before performing PVAR regression, it is necessary to determine the optimal lag to use in the equations. The results in Table and Table present that all criteria, including LR (sequential modified LR test statistic), FPE (Final prediction error), AIC (Akaike Information Criterion), SC (Schwarz Information Criterion) and HQ (Hannan-Quinn Information Criterion) suggest that a number of three lags will be chosen which will make it possible to apply the estimated PVAR model.
Table 4. Testing optimal lag selection of PVAR model for Asia
Table 5. Testing optimal lag selection of PVAR model for Europe
5.3. Stability condition test
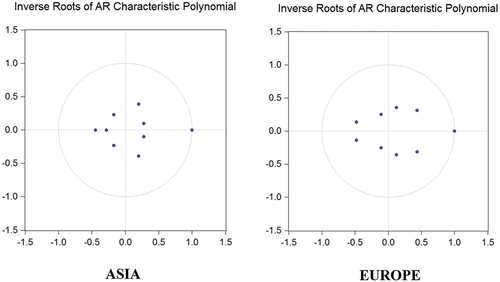
In the next step, we need to check the stability of PVAR model. Figure presents the Inverse Roots of AR Characteristic Polynomial for PVAR model in Asia and Europe. We can see that no root lies outside the unit circle, that is, both estimated PVAR model for Asia and Europe satisfy the stability condition.
Figure 1. Inverse roots of AR characteristic polynomial.
5.4. Granger causality test
The results of Granger causality test are shown in Table . We find that in Asian countries, there exists a bidirectional relationship between SMR and GP. This implies that the volatility of Asian stock market will involve in the gold price and vice versa. In addition, there is a unidirectional relationship between SMR and ER, while GP and ER are independent of each other. These results are consistent with Kumar and Robiyanto (Citation2021). Thus, the results may be inferred that in Asian markets, investors can use the stock market to forecast changes in gold and foreign exchange markets to make investment decisions. In addition, investors in the Asian market can invest freely in gold and foreign exchange markets without worrying about the interaction of the two markets. In European countries, SMR, GP, and ER are causally related at the significant level of 1%. This finding is consistent with Arfaoui and Ben (Citation2017), Alshammari et al. (Citation2020), and Syahri and Robiyanto (Citation2020). Thus, in Europe, the stock market, gold price and foreign exchange have a close relationship with each other. A change in one market will affect the volatility of the other two. Investors tend to change their portfolios if there is a market uncertainty, such as the COVID-19 pandemic. When the economy shows signs of worsening and the stock market plunges, it is time for investors to withdraw their capital in this market and switch to holding gold and cash (of which a large part is in USD). As the market recovers, investors are willing to take more risks, there is a shift in investors’ asset holdings from safe assets like gold to riskier assets like stocks. Therefore, investors in the European market will be more cautious in choosing the market to invest in.
Table 6. Results of Granger causality test
5.5. Result of impulse-response function (IRF)
We analyze the impulse-response function to consider the interaction mechanism between the variables in the estimated model.
Figure shows the responses of GP and ER after shocked by SMR in Asian countries. Results indicate that GP responds negatively to SMR at −0.00046% at the first phase and keeps negative in the subsequent forecast periods. ER, on the other hand, responds negatively to an SMR shock in the first phase at −0.115%, positively in the second phase at 0.001% and then negatively in the third phase at −0.036%. The response value reaches a peak in the fourth phase and gradually converging to 0 after the fifth phase. These results imply that in Asian countries, when the stock market declines, investors will tend to sell stocks and even foreign currencies to switch to invest in gold—an asset that is considered a safe haven for investors when the market has many uncertainties.
Figure 2. Impulse-response function in Asia.
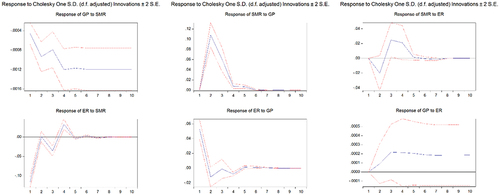
When there is a GP shock, SMR responds positively at 0.133% in the second period and keeps positive in the next six periods before stopping completely. This result is consistent with Syahri and Robiyanto (Citation2020), Kumar and Robiyanto (Citation2021). It can be seen that, during the pandemic period, the prospect of economic recovery is still difficult to predict and there are many risk factors that create growth drivers for assets that are considered safe havens such as gold. However, investor sentiment improves and stabilizes over time, allowing the stock market to gradually recover. When hopes of economic recovery are accompanied by concerns about high inflation, the USD depreciates, explaining the ER’s six-day negative response to the GP shock.
Figure describes the responses of GP and ER after an SMR shock in European countries. When there is an SMR shock, GP responds negatively at the first phase at −0.00042%, and keeps negative in the subsequent forecast periods. This could be understood that, in Europe, when there is a shock in the stock market, investors tend to invest in the gold market, causing the two markets to move in opposite directions. This response lasts for about a week before remaining stable. The finding strengthens the results of Alshammari et al. (Citation2020), Akbar et al. (Citation2019) which suggested that gold is a safe haven for stocks.
Figure 3. Impulse-response function in Europe.
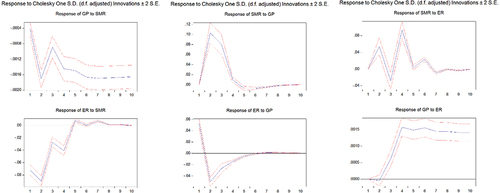
ER’s response to SMR shock in Europe is almost entirely different from that of Asian countries. When there is an SMR shock, ER has a negative reaction in the first four phases. From the fifth to the seventh phase, it reacts positively to the SMR shock, and stops responding at the eighth phase. These results are consistent with Branson (Citation1983), Ibrahim and Aziz (Citation2003), Tsai (Citation2012), and Arfaoui and Ben (Citation2017). As stock markets tend to decline, European investors will turn to holding safer assets, including gold and foreign currencies like USD. It can be seen that USD is also considered a safe haven for European investors but not for Asian investors. Portfolio changes occurred immediately after the stock market shock but lasted only about a week, suggesting that the relationship between SMR and GP or between SMR and ER is only short term.
The responses of SMR and ER are completely opposite when shocked by GP. SMR’s response value is 0.103% on the second day and declines for two subsequent days. In the fifth phase, it responds negatively at −0.007% and lasts until the eighth day. Meanwhile, in the first day, ER responds positively at 0.053% and declines rapidly at the second day. The negative response lasts for six days and gradually converges to 0 afterward. This result shows similarities in investors’ decision to invest in Asian and European markets.
When there is an ER shock, the SMR responds positively at 0.054% and remains for 7 periods. This result is contrary to most of the previous empirical studies on the relationship between stocks and exchange rates but is consistent with Dornbusch and Fischer (Citation1980). This study argues that once the local currency is undervalued, it makes domestic enterprises more competitive. International trade increases because domestic goods are cheaper than foreign goods. This causes the stock prices of these businesses to increase. GP responds to ER shock more slowly at the third phase before showing a clear positive response with 0.00061% and 0.00157% in the fourth phase onwards. This result is consistent with Samadi et al. (Citation2021), implying that investors should be cautious when investing in these two markets in the long term because of the co-movement between the two markets in long-term
5.6. Variance decomposition results
After analysis of the impulse-response function, we analyze the variance decomposition results to see how SMR, ER, and GP would be explained by each other. The results of variance decomposition are shown in Table .
Table 7. Variance decomposition analysis
The results of variance decomposition of SMR in Asia show that over a 20-day horizon, SMR was 98.8% explained by its own shock, GP accounts for only about 1.09, and 0.1% of the shock explained by ER. During the whole 20-day horizon, the shock explained by changes in SMR and ER on GP is only approximately 1% and 0.02%, respectively. Furthermore, ER accounts for just 3.48% of the shock explained by SMR and 0.68% of the shock explained by GP, respectively. In European countries, the relationship between the three variables is stronger. The shock in the SMR variable has been explained 97% by itself, 1.15% by GP and 0.88% by ER since the tenth day onwards. SMR accounts for 3.8% of the GP shock, whereas 94% of GP shock is explained by the GP itself and 2.2% by ER. Finally, ER is just explained 6.2% and 2.4% by SMR and GP, respectively.
5.7. Robustness test
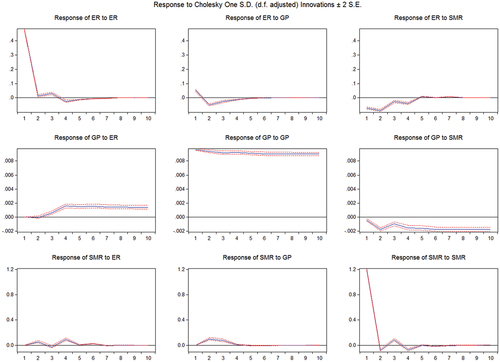
Finally, we do a robustness test to validate the results presented above. Here, we change the order of endogenous variables in the models with different paths and check the results of the impulse-response function in each order. Figure and Figure show that in the PVAR model of Asian countries, the responses of the two variables to a shock of the third variable are similar to the results in Figure —where we consider SMR to be the most endogenous variable. The robustness test results for the European countries’ model which presented in Figure and Figure also give similar results, demonstrating the robustness of our findings.
Figure 4. Ordering of Asian countries’ PVAR: GP, SMR, ER.
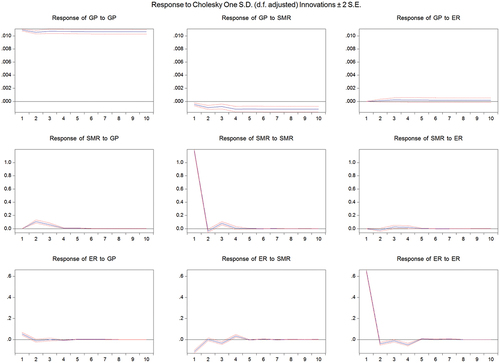
Figure 5. Ordering of Asian countries’ PVAR: ER, GP, SMR.
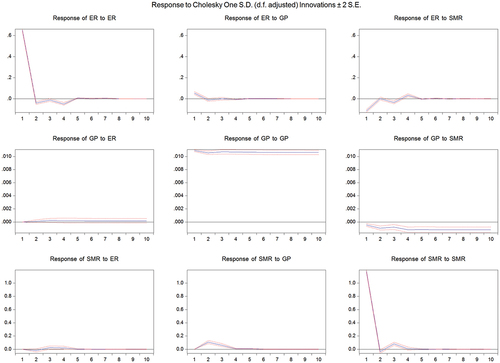
Figure 6. Ordering of European countries’ PVAR: GP, SMR, ER.
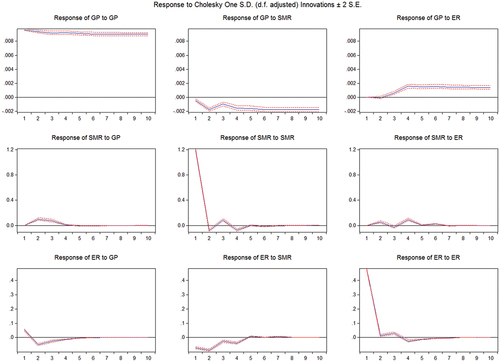
Figure 7. Ordering of European countries’ PVAR: ER, GP, SMR.
6. Conclusion and implications
The study used the PVAR model to explore the correlation between the stock exchanges, gold prices and US dollar exchange rates in Asian and European countries during the COVID-19 pandemic. Granger causality test indicated that in Asian countries, there exists a bidirectional causal relationship between the stock market and the gold price. In addition, the relationship between the stock market and the exchange rate is unidirectional, while the gold price and the USD exchange rate are completely independent. In European countries, there í a causal relationship between the gold price and the USD exchange rates at the significant level of 1%. Analysis of impulse-response function suggested that in Asia, the stock market has a negative effect on gold and a positive effect on the USD exchange rate. In Europe, the stock market has a negative impact on the other two remaining markets in the short term. This means, during the COVID-19 pandemic, when there is a stock market shock, Asian investors tend to hold gold as a safe haven asset, while in Europe, the investor’s option will be gold and foreign currencies, including USD. Europe’s gold price responds to the stock market shock in a period of seven days, longer than Asia’s which only lasts for four days. The variance decomposition results also suggested that, in Europe, SMR explains 2.5% for the GP shock and 6.2% for the ER shock from the tenth period. Meanwhile, these figures in the Asian countries are 1.6% and 3.2%, respectively. These results are consistent with the impulse-response function analyzed above.
The research results have important implications for investors. In volatile market situations, such as during the COVID-19 pandemic, investors can minimize portfolio risk by properly distributing their money to different assets such as stocks, gold, and foreign currencies. Even if their portfolio does not contain such assets, they should closely monitor the information of the markets in order to make the most profitable investment decisions.
Besides the findings presented above, this study also has some limitations. The article only focuses on researching and comparing the relationship between the stock market, gold price and exchange rate in Asia and Europe, while the remaining continents also need to be studied to get an overview about this relationship from a worldwide perspective. This topic is left for further research.
Disclosure statement
No potential conflict of interest was reported by the author(s).
Additional information
Funding
References
- Akbar, M., Iqbal, F., & Noor, F. (2019). Bayesian analysis of dynamic linkages among gold price, stock prices, exchange rate and interest rate in Pakistan. Resources Policy, 621, 154–18. https://doi.org/10.1016/j.resourpol.2019.03.003
- Al Awadhi, A. M., Alsaifi, K., Al‐Awadhi, A., & Alhammadi, S. (2020). Death and contagious infectious diseases: Impact of the COVID‐19 virus on stock market returns. Journal of Behavioral and Experimental Finance, 27(September), 100326. https://doi.org/10.1016/j.jbef.2020.100326
- Ali, R., Mangla, I. U., Rehman, R. U., Xue, W., Naseem, M. A., & Ahmad, M. I. (2020). Exchange rate, gold price, and stock market nexus: A quantile regression approach. Risks, 8(3), 86. https://doi.org/10.3390/risks8030086
- Alshammari, A. A., Altarturi, B., Saiti, B., & Munassar, L. (2020). The impact of exchange rate, oil price and gold price on the Kuwaiti stock market: A wavelet analysis. The European Journal of Comparative Economics, 17(1), 31–54. http://dx.doi.org/10.1824/-2979/202001-31-54
- Altig, D., Baker, S., Barrero, J. M., Bloom, N., Bunn, P., Chen, S., Davis, S. J., Leather, J., Meyer, B., Mihaylov, E., Mizen, P., Parker, N., Renault, T., Smietanka, P., & Thwaites, G. (2020). Economic uncertainty before and during the COVID-19 pandemic. Journal of Public Economics, 191(November), 104274. https://doi.org/10.1016/j.jpubeco.2020.104274
- Arfaoui, M., & Ben, R. A. (2017). Oil, gold, US dollar and stock market interdependencies: A global analytical insight. European Journal of Management and Business Economics, 26(3), 278–293. https://doi.org/10.1108/EJMBE-10-2017-016
- Ashraf, B. N. (2020). Stock markets’ reaction to COVID‐19: Cases or fatalities? Research in International Business and Finance, 54(December), 101249. https://doi.org/10.1016/j.ribaf.2020.101249
- Atri, H., Kouki, S., & Imen Gallali, M. (2021). The impact of COVID-19 news, panic and media coverage on the oil and gold prices: An ARDL approach. Resources Policy, 72(August), 102061. https://doi.org/10.1016/j.resourpol.2021.102061
- Boone, L., Haugh, D., Pain, N., & Salins, V. (2020). Tackling the fallout from COVID-19. Economics in the Time of COVID-19, 37. https://www.econbiz.de/Record/tackling-the-fallout-from-covid-19-boone-laurence/10012202156
- Branson, W. (1983). A model of exchange-rate determination with policy reaction: Evidence from monthly data. National Bureau of Economic Research. https://www.nber.org/papers/w1135
- Canova, F., & Ciccarelli, M. (2013). Panel vector autoregressive models: A survey☆ the views expressed in this article are those of the authors and do not necessarily reflect those of the ECB or the eurosystem. Emerald Group Publishing Limited.
- Chaudhry, N. I., Asad, H., Abdulghaffar, M., & Amir, M. (2021). Contagion effect of COVID-19 on stock market returns: Role of gold prices, real estate prices, and US dollar exchange rate. Pakistan Journal of Commerce and Social Sciences (PJCSS), 15(3), 614–635. https://www.econstor.eu/handle/10419/246074
- Dornbusch, R., & Fischer, S. (1980). Exchange rates and the current account. The American Economic Review, 70(5), 960–971. https://www.jstor.org/stable/1805775
- Gavin, M. (1989). The stock market and exchange rate dynamics. Journal of International Money and Finance, 8(2), 181–200. https://doi.org/10.1016/0261-5606(89)90022-3
- Hatmanu, M., & Cautisanu, C. (2021). The impact of COVID-19 pandemic on stock market: Evidence from Romania. International Journal of Environmental Research and Public Health, 18(17), 9315. https://doi.org/10.3390/ijerph18179315
- Husnul, H. M., Hidayat, R. R., & Sulasmiyati, S. (2017). Analisis pengaruh inflasi, kurs (IDR/USD), produk domestik bruto dan harga emas dunia terhadap indeks harga saham gabungan (studi pada Indonesia periode 2008-2016). Jurnal Administrasi Bisnis, 53(1), 66–74. http://repository.ub.ac.id/id/eprint/7574
- Ibrahim, M. H., & Aziz, H. (2003). Macroeconomic variables and the Malaysian equity market: A view through rolling subsamples. Journal of Economic Studies, 30(1), 6–27. https://doi.org/10.1108/01443580310455241
- Jain, A., & Biswal, P. C. (2016). Dynamic linkages among oil price, gold price, exchange rate, and stock market in India. Resources Policy, 49(September), 179–185. https://doi.org/10.1016/j.resourpol.2016.06.001
- Kim, K. H. (2003). Dollar exchange rate and stock price: Evidence from multivariate cointegration and error correction model. Review of Financial Economics, 12(3), 301–313. https://doi.org/10.1016/S1058-3300(03)00026-0
- Kumar, J. J. A., & Robiyanto, R. (2021). The impact of gold price and US dollar index: The volatile case of Shanghai stock exchange and Bombay stock exchange during the crisis of COVID-19. Jurnal Keuangan Dan Perbankan, 25(3), 508–531. https://doi.org/10.26905/jkdp.v25i3.5142
- Liu, Z., Huynh, T. L. D., & Dai, P. F. (2021). The impact of COVID-19 on the stock market crash risk in China. Research in International Business and Finance, 57(October), 101419. https://doi.org/10.1016/j.ribaf.2021.101419
- Li, Y., Zhuang, X., Wang, J., & Dong, Z. (2021). Analysis of the impact of COVID-19 pandemic on G20 stock markets. The North American Journal of Economics and Finance, 58(November), 101530. https://doi.org/10.1016/j.najef.2021.101530
- Lou, T., & Luo, W. (2018). Revisiting quantile granger causality between the stock price indices and exchange rates for G7 countries. Asian Economic and Financial Review, 8(1), 9–21. https://doi.org/10.18488/journal.aefr.2018.81.9.21
- Okorie, D. I., & Lin, B. (2021). Stock markets and the COVID-19 fractal contagion effects. Finance Research Letters, 38(January), 101640. https://doi.org/10.1016/j.frl.2020.101640
- Robiyanto, R., Wahyudi, S., & Pangestuti, I. R. D. (2017). The volatility – Variability hypotheses testing and hedging effectiveness of precious metals for the Indonesian and Malaysian capital markets. Gadjah Mada International Journal of Business, 19(2), 167–192. https://doi.org/10.22146/gamaijb.26260
- Samadi, A. H., Owjimehr, S., & Halafi, Z. N. (2021). The cross-impact between financial markets, COVID-19 pandemic, and economic sanctions: The case of Iran. Journal of Policy Modeling, 43(1), 34–55. https://doi.org/10.1016/j.jpolmod.2020.08.001
- Siddiqui, K. (2020). The US dollar and the world economy. http://hdl.handle.net/11159/3746
- Srinivasan, P., & Karthigai, P. (2014). Gold price, stock price and exchange rate nexus: The case of India. The IUP Journal of Financial Risk Management, 11(3), 1–12. https://ssrn.com/abstract=2556151
- Sui, L., & Sun, L. (2016). Spillover effects between exchange rates and stock prices: Evidence from BRICS around the recent global financial crisis. Research in International Business and Finance, 36(January), 459–471. https://doi.org/10.1016/j.ribaf.2015.10.011
- Suriani, S., Kumar, M. D., Jamil, F., & Muneer, S. (2015). Impact of exchange rate on stock market. International Journal of Economics and Financial Issues, 5(1), 385–388. https://dergipark.org.tr/en/pub/ijefi/issue/31972/352308?publisher=http-www-cag-edu-tr-ilhan-ozturk
- Syahri, A., & Robiyanto, R. (2020). The correlation of gold, exchange rate, and stock market on Covid-19 pandemic period. Jurnal Keuangan Dan Perbankan, 24(3), 350–362. https://doi.org/10.26905/jkdp.v24i3.4621
- Tsai, I. C. (2012). The relationship between stock price index and exchange rate in Asian markets: A quantile regression approach. Journal of International Financial Markets, Institutions and Money, 22(3), 609–621. https://doi.org/10.1016/j.intfin.2012.04.005
- Tuna, G. (2019). Interaction between precious metals price and Islamic stock markets. International Journal of Islamic and Middle Eastern Finance and Management, 12(1), 96–114. https://doi.org/10.1108/IMEFM-06-2017-0143
- Wagner, A. F. (2020). What the stock market tells us about the post-COVID-19 world. Nature Human Behaviour, 4(5), 440. https://doi.org/10.1038/s41562-020-0869-y
- Wen, X., & Cheng, H. (2018). Which is the safe haven for emerging stock markets, gold or the US dollar? Emerging Markets Review, 35(June), 69–90. https://doi.org/10.1016/j.ememar.2017.12.006
- WHO. 2020. COVID-19 Dashboard. World Health Organization. December 3, 2021. https://covid19.who.int/
- Xu, L., Chen, J., Zhang, X., & Zhao, J. (2021). COVID-19, public attention and the stock market. Accounting & Finance, 61(3), 4741–4756. https://doi.org/10.1111/acfi.12734
- Yilmazkuday, H. (2021). COVID-19 effects on the S&P 500 index. Applied Economics Letters, 1–7. https://doi.org/10.1080/13504851.2021.1971607
- Yousaf, I., Bouri, E., Ali, S., & Azoury, N. (2021). Gold against Asian stock markets during the COVID-19 outbreak. Journal of Risk and Financial Management, 14(4), 186. https://doi.org/10.3390/jrfm14040186
- Yousef, I., & Shehadeh, E. (2020). The impact of COVID-19 on gold price volatility. International Journal of Economics and Business Administration, 8(4), 353–364. https://doi.org/10.35808/ijeba/592
- Zhao, H. (2010). Dynamic relationship between exchange rate and stock price: Evidence from China. Research in International Business and Finance, 24(2), 103–112. https://doi.org/10.1016/j.ribaf.2009.09.001
Appendix
Table A1. Review of selected studies on the relationship between stock market, gold price and exchange rate