
 ?Mathematical formulae have been encoded as MathML and are displayed in this HTML version using MathJax in order to improve their display. Uncheck the box to turn MathJax off. This feature requires Javascript. Click on a formula to zoom.
Abstract
This study analyzes the trilateral relationship between macroeconomic variables of oil prices, stock market index, and exchange rate to demonstrate their behavior and inter-relationship in the economic setup of Pakistan. The investigated period includes daily time series data ranging from 4 January 2016 to 30 April 2021. The study consists of three sub-periods: the pre-COVID-19 period ranging from 4 January 2016 to 31 December 2019, COVID-19 period ranging from 1 January 2020 to 30 April 2021, and overall period ranging from 4 January 2016 to 30 April 2021 by using a Vector Autoregressive (VAR) model. The results illustrate that oil prices changes, and stock index have an insignificant direct relationship both in pre-COVID-19 and overall sub-periods of study while a positive and statistically significant relationship during the COVID-19 period. This research also suggests that stock index has a direct and statistically significant but negative impact on the exchange rate in all sub-periods of study. This research also gives practical implications for forex investors and traders to analyze the inflating and deflating stock market patterns for future investment opportunities. However, most of the previous studies emphasized on the direct influence of exchange rate on the stock market and no effort is made on vice versa association. Furthermore, this research presents a practical relevance for the stock market investors that health uncertainty regime affected the insignificant association between oil price and stock market indices and this relation turns out to be significant during the crisis regime.
1. Introduction
COVID-19-related virus propagation serves as the foundation for looking at the consequences of its adverse impact on macroeconomic indicators as well as financial markets (Managi et al., Citation2022; Zeinedini et al., Citation2022; Zhang et al., Citation2022). Those economies that are dependent upon the revenues generated by exporting oil are experiencing a steady downturn in their financial market (Kumeka et al., Citation2022). This is owing to the fatal 2019 epidemic, the plunging oil prices (OPs) as an extremely unpredictable commodity, and the depreciation of exchange rates (ERs; Fayyad & Daly, Citation2011). The time period of COVID-19 is very much imperative for reviewing the influence of OP volatility on stock market indices and the exchange rate because of two reasons. Firstly, the 2019 epidemic has caused adverse reactions in several developing nations’ financial markets including Pakistan (Shear & Ashraf, Citation2022), and also the price variations in numerous economic factors (Tuna & Tuna, Citation2022). Secondly, there are various other disruptions like political instability, which has motivated the researchers to investigate the impact of OP volatility on the stock market indices and exchange rate fluctuations in the presence of health-related uncertainty coupled with political instabilities.
Oil is an important factor for the economic performance of a developing country like Pakistan, which is already trying to fulfill the energy shortage by relying on imported oil. However, to deal with rising COVID-19-related death and confirmed cases, most of the developed countries, i.e., USA, Germany, Australia, New Zealand, and so on, and developing economies like Pakistan, India, and so on, impose a restriction on public gathering, inter-country travel, and indoor dining activities by large food chains (Ashraf, Citation2020; Izzeldin et al., Citation2021; Liu et al., Citation2021). This has not only disrupted the financial system of the developing economies and caused losses in tax-based revenue collection and private businesses (Li et al., Citation2022) but has also reduced the demand for petroleum-based products and oil (Adedeji et al., Citation2021). In the meanwhile, the failed negotiations between Russian authorities and OPEC to reduce the production of oil in Russia have caused the OP reduction (Gharib et al., Citation2021). The result is an oversupply of oil at a time of lower oil demand (Ali et al., Citation2022), plus an additional drop in OP during the health crisis period (Sharif et al., Citation2020). Such a situation has placed economies all around the globe in peril, causing a destabilizing economic pandemic and destroying yesterday’s economic rewards in a quite shorter amount of time. The fluctuations in OPs due to COVID-19 have motivated the investigation of OP’s influence on the stock market indices and exchange rate during the health crisis regime. However, limited effort has been made whether stock market indices may act as a mediating factor for the transition of shocks from OP towards the ER during three periods: Pre-COVID era, during COVID-era, and complete period. Moreover, the possibility of stock market indices as a transmission channel between exchange rate and OP volatility is explained below.
The positive shocks in OPs put downward pressure on the local currency rate of oil-importing countries. On the other hand, rising OPs are considered beneficial for an oil-exporting country. As a result of the occurrence of OP +ve shocks, stock market indices of oil-importing economies may experience a decrease in stock market prices due to inflated producer prices and a declining local currency (appreciating US dollar rate). Conversely, according to the “goods and market concept”, a local currency deflation boosts exporters’ profitability by lowering expenditures and increasing revenue (Dornbusch & Fischer, Citation1980). Nevertheless, the depreciation of the local Rupees (currency of Pakistan) reduces the profitability of import-oriented businesses because of an increase in expense, cost of materials, and reduction in product/service demand (Basher et al., Citation2016; Kumar, Citation2019; Lin & Su, Citation2020; Youssef & Mokni, Citation2020). Moreover, most of the exporters of oil-importing countries may sell goods or services during the times of local currency depreciation to oil-exporting nations and this would increase the foreign exchange inflows. Pakistan is an import-oriented economy but also exports a huge amount of agricultural and textile-related products to European Union and the USA. Therefore, there may be a possibility that OP fluctuation directly or inversely affected the stock market indices in Pakistan (Sheikh et al., Citation2020).
The appreciating OPs during the COVID-19 may also be an indication of demand for oil due to the overall economic expansion, industrial production, and ease in boundary restriction (Kocaarslan & Soytas, Citation2019a, Citation2019b). Therefore, investors of the KSE-100 index may respond positively to OP shocks. According to the stock-oriented approach, a positive shock in stock market indices may attract foreign direct investment in the Karachi stock market, which would lead to more local currency demand (Reddy & Sebastin, Citation2008). Moreover, an increase in stock market indices also causes the local investor to bring their investment back into their country because of high returns and attractive investment horizons. This puts upward pressure on the local currency rate. Therefore, OP positive and negative shocks may affect the stock market indices, which in turn may affect the local currency appreciation or depreciation. There may be a possibility that OP shocks may not directly affect the local exchange rate but stock market indices may act as a mediating mechanism for transmitting the shocks from OP toward the exchange rate. However, previous research mostly explained the direct effect of OP shocks on either local exchange rate or stock market indices. This research article departed from mainstream research in the below-mentioned possible ways.
Firstly, this research article examines the impact of OP fluctuations on the stock market indices during the health-related turbulent and non-turbulent environments. Furthermore, the whole sample period is also selected for analyzing the general response of investors to OP change, whereas most of the prevalent studies on the OP and stock market are generally executed in turbulent-free regimes (Ivanovski & Hailemariam, Citation2021; Jiang et al., Citation2021; Mensi et al., Citation2018; Olayeni et al., Citation2020; Wang & Zhao, Citation2021) and no effort has been made to determine how a specific regime influenced the mediation of stock market indices in between local currency and OP fluctuations. Furthermore, we also examined the role of stock market indices as a transmission channel for transmitting the shocks from OPs to the exchange rate. However, previously, most studies examined the direct influence of OP on the stock market (SM) without analyzing any transmission channel (Adjasi, Citation2009; Al-hajj et al., Citation2018; Bagchi, Citation2017; Basher & Sadorsky, Citation2006; Benkraiem et al., Citation2018; Das & Kannadhasan, Citation2020; Fayyad & Daly, Citation2011; Ghulam et al., Citation2018; Hadhri, Citation2021; He et al., Citation2021; Lv et al., Citation2020; Sheikh et al., Citation2020). The goods and market approach postulated the change in currency fluctuation because of OP volatility. However, the stock-oriented approach provided a legitimate framework that positive changes (appreciation) in stock market indices are the root causes of higher demand (appreciation) in local currency. Therefore, a possibility exists that OPs may not influence the exchange rate directly but stock market indices may play a role in driving the appreciation pressures on local currency. Furthermore, most of the studies on the response of stock market to OPs and exchange rate response to stock market and OPs presented inconsistent results and were outside the context of Pakistan.
2. Literature Review
Sufficient literature is available on the interactions among exchange rates (ERs), OPs, and SM returns. However, the literature investigating the SM transmission channel interrelationship among all the above three variables simultaneously in the settings of COVID-19 pandemic is insufficient. This literature analyzes the interrelationship among these three variables in the economic setup of Pakistan.
2.1. Studies on relationship between oil prices and stock market
The relationship between OPs and stock index (SI) can be established by the equity pricing model or cash flow hypothesis which exerts that an asset is valued based on its cash flows (expected) after discounting at a suitable discount rate. Theoretically, four types of relationships, i.e., positive, negative, time-dependent, and no relation, are possible between OPs and SI. The argument for a negative relationship states that a rise in energy prices (e.g., OP) leads to an increase in input production cost for most companies. This phenomenon hits the profitability and, resultantly, cash flows (expected) leading to a fall in the market value of an asset (e.g., a stock). It is imperative to note that the relationship and its significance are highly dependent on the energy status of a country (i.e., a net importer or exporter of crude oil) and the proportion of input energy costs. The theoretical argument for a positive relationship poses that rising OPs are perceived as rising demand for economic activity and it may boost stock prices. The asymmetric behavior of OPs and equity market prices make their relationship as a function of time. Le and Chang (Citation2015) explored the relationship between oil-importing, oil-exporting, and oil-refining economies and reported that the impact of changes in the OPs on stock prices is influenced by fundamental economic characteristics and is time-dependent. Finally, the no-relation argument emphasizes that the share of energy input costs is not large enough to affect the demand for oil and, resultantly, stock prices especially energy stocks.
Zaighum et al. (Citation2021) employed an asymmetrical quantile-based autoregressive distributed lag (ARDL) framework by Cho et al. (Citation2015) for examining the quantile-dependent non-linear nexus between the world’s Islamic stock indices and energy prices. Findings suggested the practical implications for longer-term investors that they should invest in Islamic stock market indices at the times of increasing OPs and stock market bullish behavior. Ji et al. (Citation2020) investigated the differential impact of supply-side and demand-side shocks in OPs on the currency rates of export-oriented and import-oriented economies by using the structural VAR framework. Findings suggested that supply-side OP shocks lead to the depreciating trend in the exchange rate of the export-oriented economy. However, the prevalence of the transmission of OP shocks toward the exchange rate has become more powerful after the financial crisis of 2008. Iqbal et al. (Citation2022) investigated whether the sustainable investment stock market indices are affected by different categories of international risk factors like unpredictability in the economy, fluctuations in the stock market, health-related uncertainty factors, and the US treasury market fluctuations by employing the connectedness time and frequency methodology of Diebold and Yilmaz (Citation2012).
The relationship between OPs and SI has been extensively tested, but there is no consensus on the direction of causality and sign of correlation. Basher and Sadorsky (Citation2006) explored the interrelationship between OP and SI returns in a set of emerging economies using daily data series using an international multi-factor asset pricing model. Their results suggested that OP risk affects SI returns. Shahrestani and Rafei (Citation2020) analyzed the impact of OPs on the stock market in the oil-producing Iranian economy using Markov switching vector autoregressive (VAR) model based on two regimes using monthly data series. They estimated the regimedependent impulse response function (IRF) and concluded that OP shocks exhibited both the positive and negative impact on stock exchange in both the regimes.
Cunado and Perez de Gracia (Citation2014) analyzed the impact of OPs on SI returns in 12 European countries using VAR and Vector Error Correction Model (VECM) models, with monthly data series for the period of 1973–2012. They concluded that OPs significantly and negatively affect SI return and supply shock has greater impact than demand shock on OPs. Similarly, Bai and Koong (Citation2018) assessed the relationship between OPs, ERs, and SI returns in China and USA using dynamic IRF and diagonal BEKK-GARCH model for the period 1991–2015 with monthly data series. They reported that positive oil supply shocks significantly and negatively affected both the Chinese stock market and trade-weighted US dollar index.
Comparatively, Aggarwal and Manish (Citation2020) studied the impact of OPs on the Indian stock market using the ARDL model with monthly data series and concluded that OPs significantly and positively affect the SI returns both in the short and long run. Tawfeeq et al. (Citation2019) explored the linkage between crude OPs and SI for seven Middle Eastern countries using VAR and VECM models and daily data series. They highlighted that there is a positive relationship between OPs and SI value for three countries and there exists a short-run causality for two countries running from OPs to the stock market. Furthermore, a study by Alamgir and Amin (Citation2021) analyzed the interaction between OPs and the stock market in four South Asian countries (i.e., Pakistan, India, Bangladesh, and Sri Lanka) using the Nonlinear Autoregressive Distributed Lag (NARDL) model with monthly data set for the period of 1997–2018. The concluded the positive association between OP and SI along with an asymmetric reaction of SI to shocks in OPs. However, Ceylan et al. (Citation2020) investigated the relationship between OPs and stock prices for seven developing countries using the time-varying homogenous panel smooth transition VECM with monthly data set. They concluded that over the long term, causality runs from OPs to stock prices. In the short term, however, changes in OPs have a neutral effect on stock prices. In view of current literature, the first hypothesis is formulated as follows:
H1a: Oil prices have a direct impact on stock index
2.2. Studies on relationship between stock market and exchange rate
Building upon the portfolio balance approach, the stock market mechanism determines the exchange rate. As the nominal interest rate in the economy rises, it attracts foreign capital provided there exists free capital mobility. The capital inflow increases stock market activity by investing in domestic stocks. Resultantly, demand for domestic currency rises and, hence, it appreciates in value. Alternatively, in financial crises or a pandemic, flight for safety behavior leads to capital outflow and reduces market activity. This behavior also increases the supply of domestic currency in the local market and, hence, its value depreciates. So, as per portfolio balance approach, both positive and negative association between equity market (SI) and ER is possible. This theory also specifies that causality runs from the stock market to exchange rate. The literature on the association between stock prices (SI) and macroeconomic variables is vast and provides conflicting evidence. The following subsections summarize the relevant literature for an association between SI and macroeconomic variables including exchange rate. However, most of the researches explained the direct impact of SM on ER (Anisak & Mohamad, Citation2019; Areli Bermudez Delgado et al., Citation2018; Hussain, Citation2019) and ignore the vice versa factor.
Chortareas et al. (Citation2011) conducted a study on the association among ERs, SI, and role of OPs in the context of the MENA region (including four countries, namely Egypt, Kuwait, Oman, and Saudi Arabia) using VECM and monthly data series. They concluded both the positive (in Egypt and Oman) and negative (in Saudi Arabia) relationships between real ER and SI. El-Masry and Badr (Citation2021) explore the relationship between exchange rate and stock market performance in Egypt for a revolutionary period using daily data series and the VAR model. They noted the significant causal (insignificant) relationship between ER and SI before (after) the revolution period. Abdalla and Murinde (1997) investigated the interactions between ER and the stock market in emerging economies including India, Korea, Philippines, and Pakistan. They concluded that ER granger-caused the stock prices.
Tsai (Citation2012) analyzed the relationship between foreign and stock exchange markets in Asian markets (i.e., Thailand, Malaysia, Philippines, South Korea, and Taiwan) using quantile regression approach and monthly data series. They concluded that an increase in stock price returns caused exchange rate to depreciate, i.e., domestic currency to appreciate and this negative relationship is exacerbated when ER is significantly high or low. Hatemi–J and Irandoust (Citation2002) analyzed the causality between exchange rate and stock market using Toda and Yamamoto approach and monthly data series for period 1993–1998. They concluded that the causality is unidirectional and runs from stock market to exchange rate. Ajaz et al. (Citation2017) analyzed the asymmetric relationship between ER, SI, and OPs in India using monthly data series from period 1991 to 2015. They noted that domestic currency depreciation caused stock prices to fall.
Some studies on the relevant literature in the economic environment of Pakistan are also available. For example, Chang et al. (Citation2021) analyzed the impact of macroeconomic variables on stock prices, both in the short and long term, using Quantile ARDL model and monthly data series. They also considered the impact of three crises that occurred between 2005 and 2009. They remarked that there is an insignificant relationship between macroeconomic variables and stock prices in the long run. However, in short run, the impact of exchange rate is market state dependent. Furthermore, Akbar et al. (Citation2019) analyzed the dynamic relationship among ER, gold prices, SI, and interest rate using VAR Bayesian VAR model for the period 2001–2014 and monthly data series. They concluded that bilateral relationship exists between exchange rate and stock value with downward movement of both Pak rupee and stock prices in economic downturns. However, all of these studies observed the variations in stock market indices due to the exchange rate volatile movement but no effort is made to investigate whether increase or decrease in stock market values may affect the currency devaluation. According to the stock-oriented approach, appreciation in local asset prices attracts foreign and local investors and this would lead towards the capital inflows and local currency appreciation. In view of the above literature, the second hypothesis is formulated as follows:
H1b: Stock index has a direct impact on exchange rate
2.3. Studies on relationship between oil prices and exchange rate
The linkage between OPs and ER can be established in three different ways, namely the Terms of Trade (ToT) channel, the wealth effect channel, and portfolio reallocation channel (Habib et al., Citation2016). The traditional ToT channel describes that expensive (cheaper) imports (exports) cause current account balance to deteriorate, compelling the depreciation of domestic currency provided that the demand of the importing (exporting) good is highly inelastic as in the case of oil (Chen et al., Citation2016), especially for oil-importing emerging economies. The wealth channel introduced by Golub (Citation1983) and portfolio reallocation channel pioneered by Krugman et al. (Citation1983) reflect the effects in short and long run of almost the same concept related to wealth transfer. An increase (decrease) in OPs generates higher (lower) income for oil-producing nations and lower (higher) income for oil-importing nations. Higher (lower) income enhances (deteriorates) the current account balance and, hence, appreciates (depreciates) the domestic currency.
Liu et al. (Citation2021) investigated the dependence and risk co-movement of OPs and ERs in seven oil-producing and seven net oil-buying nations using time-varying copula models and daily data series from the period 2000–2017. They suggested the negative dependence between exchange rate and OPs, i.e., rising OPs led to an appreciation of domestic currency against the US dollar. Kin and Courage (Citation2014) studied the impact of OPs on ER in South Africa using the Generalized Autoregressive Conditional Heteroscedasticity (GARCH) model with monthly data for the period 1994–2012. They found that OPs significantly affect the ER and rising OPs led to falling in the value of a national currency.
In terms of risk spillovers, Wen et al. (Citation2020) analyzed the volatility spillovers between OPs and ERs in net oil-buying (Europe, India, China, and Japan) and net oil-selling (Norway, Canada, and Russia) countries using multivariate quantile model (MVMQ-CAViaR) using daily data series for period from 2000 to 2018. They concluded the presence of spillover effects with stronger spillover effects from exchange rate to OPs and oil-exporting countries. Youssef and Mokni (Citation2020) examined the impact of OPs on currency markets for oil-related economies (i.e., USA, Canada, Australia, Japan, and Eurozone) using novel regime-switching quantile regression and daily data series. They concluded that the response of ER to changes in OPs is regime-dependent and varies in magnitude, statistical significance, and size. Similarly, Chen and Chen (Citation2007) explored the con-integration relationship between OPs and ERs of G7 economies using monthly data. They noted the link between OPs and real ERs with real OPs have significant predictive power.
Alternatively, Sari et al. (Citation2010) and Pershin et al. (Citation2016) explored the relationship between OPs and exchange rates in the European Union and selected African countries, respectively, by using VAR model and daily data series. They concluded that the relationship between OPs and ERs is not stable and the relationship between OPs and ER cannot be generalized for net-oil importing African countries. While using time-varying copula method and daily data series for the period from 2000 to 2010 in seven OECD countries, Reboredo (Citation2012) noted the weak dependence between OP and ER. In view of the above literature, the third and fourth hypotheses are formulated as follows:
H1c: Oil price has a direct impact on exchange rate
OP appreciation may impose a depreciating pressure on local currency of economies relying upon imported oil. However, OP positive changes may also lead towards the stock market appreciation because of the increase in oil demand due to economic expansion, ease in inward and outward restriction on travel, and overall governmental spending on development budgets. Therefore, investors during a financial recession and health related turbulence may react positively to OP increase. Furthermore, OP increase may put a downward trend on local currency, but this downward pressure is much beneficial for local exporters because of reduction in expense and expansion in revenues. As explained in introduction section, stock-oriented approach stated that appreciation in equity prices may attract foreign investment, and as a consequence, local rupee appreciates against international currency. Therefore, there may be a possibility that OP does not impact the local exchange rate directly but utilizes the medium of SM as a transmission channel for transmitting the OP shocks towards the exchange rate.
H1d: Stock index acts as a mediating variable in between oil prices and exchange rate
3. Data and methodology
3.1. Data
In this paper, we explore the trilateral relationship among OPs, SI, and exchange rate (ER) for the period spanning from 4 January 2016 to 30 April 2021. Furthermore, we also analyze the transmission mechanism of shocks between the variables by using stock market indices as a mediator. We split whole sample period into three sub-periods: pre-COVID period (4 January 2016 to 31 December 2019), COVID period (1 January 2021 to 30 April 2021), and overall period (4 January 2016 to 30 April 2021). The division of data set into sub-periods is in line with previously published researches (Wen et al., Citation2020). We use daily time series data as it is more rich in information than lower-frequency data (Basher & Sadorsky, Citation2006) and is more complex and provides timely information (Ahmed & Huo, Citation2020). There are 1,325 total observations in the overall sample.
We use the nominal exchange rate for the Pakistani rupee (PKR) against per unit of the US dollar (USD) and the representation of local exchange rate by PKR/USD is consistent with Ahmed and Huo (Citation2020). A rising (falling) ER corresponds to falling (rising) PKR. For OPs, a futures contract on Brent Crude oil is used because of its representation as change in world OPs (Adedeji et al., Citation2021; Lv et al., Citation2020; Mensi et al., Citation2018; Wang & Zhao, Citation2021; Wen et al., Citation2020). KSE-100 index (SI), a free-float market capitalization index of top 100 companies in Pakistan, is used to measure the impact on the SI. Data for all the variables was extracted from the Bloomberg.
3.2. Methodology
This paper explores the trilateral relationship among OP changes, SI changes, and exchange rate changes in Pakistan through the following process. First, the unit root test is employed to determine the stationarity of all the data series. Data needs to be non-stationary at level and it should be stationary after transforming the non-stationary series with the first differencing, i.e., I (1). Second, VAR model can be applied with appropriate lag length criteria only if all the time series are integrated at I (1), none of the variables is I (2), and time series are not co-integrated with each other. Optimal lag length criterion is determined using minimum values of AIC, SC, and HQ. In case the series are co-integrated with each other, we employ VECM to explore the long-term relationship among the variables with appropriate lag length. In order to determine the transmission channel (and hence the mediation) of a variable, we use a system of equations in VAR environment, and the Wald Test of Joint Significance is employed. We firstly examine the impact of OP on the exchange rate fluctuations (ER OP) and examine whether there is any direct significant influence of energy prices on the local currency fluctuations. Secondly, we also examine the direct linkages between the SM
OP (impact of OPs on stock market indices) and lastly the nexus between (impact of stock market on exchange rate) ER
SM is studied. If there exists no significant impact of OP on ER (first case) but the significant result is found for the direct influence of OP on SM indices (second case) and for the direct impact of SM indices on ER (third case), then we can say that stock market indices acted as a mediator in between the exchange rate and OPs. This also shows the transmission channel of SM for transferring the shocks from OP towards the ER (ER
SM
OP). Finally, the VAR model can be decomposed into IRFs and Variance Decompositions (VDCs).
3.2.1. Unit Root Tests
Identification of unit root is essential as non-stationary data leads to spurious regression results. Table presents the results of ADF, PP, and KPSS unit root tests. ADF and PP unit root tests have a null hypothesis that time series has a unit root. Conversely, the KPSS test checks the null hypothesis that the time series is stationary. The results of ADF and PP tests depict that all the variables are stationary at a 1% level of significance after first differencing, i.e., they are I (1) for both intercept and intercept positive trend position. In the case of the KPSS test, OP and SI are I (1) at a 1% level of significance, while the exchange rate is not stationary even after the first differencing. As two out of three tests confirm the stationarity of a variable and integration of the variables at a similar level, the conclusion is the exchange rate is also stationary (Areli Bermudez Delgado et al., Citation2018).
Table 1. Unit root tests
3.2.2. Vector autoregressive model
We employ VAR model introduced by Sims (Citation1980) to assess the trilateral interaction between OPs, SI, and exchange rate. In VAR model, all variables (endogenous) are expressed as past values of order p and each equation is separately estimated by OLS. Generally, the VAR (p) model can be for OPs, SI, and exchange rate can be specified as follows:
where Yt represents 3 × 1 vector of endogenous variables, C is a 3 × 1 vector of intercepts in VAR, j is the j-th (3 × 3) matrix of coefficients, and εt is 3 × 1 vector of disturbance terms. The optimal lag length for each model in each sub-sample period was specified through AIC criteria. Information about lag criteria in presented in .
The system of equations with three endogenous variables is estimated as follows:
where Δ is a difference operator, a0 is a constant term, and ε represents the innovations or shocks.
4. Empirical results
4.1. Preliminary data analysis
Table presents the descriptive summary of all the variables in this study. Each variable has 990, 335, and 1325 daily observations in the pre-COVID period, COVID period, and Overall period, respectively. SI has the highest value of 52,876.46 points and the lowest value of 28,764.63 in the pre-COVID period. The highest value was due to money inflow on account of upgradation of Pakistan stock market status into MSCI emerging market. During the COVID period, SI plummeted to 27,228.80 level due to divestment of local investors and outflow from foreign portfolio investors as the panic selling continued in that period.
Table 2. Descriptive statistics
The skewness of SI turned negative during the COVID period representing the frequent small gains and a few extreme losses in the COVID period. Furthermore, the leptokurtic behavior of SI indicates the stock market has more frequently large deviations from the mean due to fatter tails in all sub-sample periods of study. Another variable in the table is OP. It has the lowest price of US19.33 during the COVID period and a higher standard deviation value of 12.38 than the pre-COVID value of 11.57. None of the variables are normally distributed in all the sub-periods as indicated by the p-value of Jarque–Bera except for OP in the pre-COVID period.
4.2. Empirical results from unrestricted VAR model
Tables present the results of unrestricted VAR model. Table displays the results of transmission channel (and hence mediating role) of SI in between OP and ER during the COVID period using Wald Joint significance test. The Residual Serial Correlation Lagrange Multiplicator (LM) test, presented in , shows no autocorrelation in the data. Wald joint significance test checks the joint significance (and hence direct impact) of variable with its all lags on another variable in a system of equations in VAR model. Findings demonstrate that the first lag of OP in pre-COVID and overall period and the first and fifth lags of OP during COVID period have statistically significant and positive impact on SI. However, Wald joint significance test shows that changes in OPs directly and significantly affect the SI only during COVID period and have no impact in the pre-COVID and overall period of study. Hence, first hypothesis is rejected in pre-COVID and overall sub-periods. In short run, no direct impact of OP on SI is consistent with the previous study by Ceylan et al. (Citation2020) in developing countries. This result is also supported by the VAR Granger Causality test (as shown in Figure ) which confirms that OP does not granger cause SI in both pre-COVID and overall sub-period. The overall behavior of OP being economic characteristics dependent and time dependent in impacting SI is supported by Le and Chang (Citation2015).
Figure 1. VAR Granger Causality Test. Source: Author’s own.
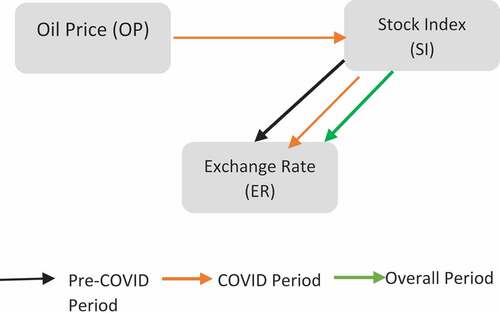
Table 3. Wald Joint Sig. Test
Table 4. Unrestricted VAR
Table 5. Unrestricted VAR
Results also confirm that the second lag of SI in the pre-COVID period and the first, second, fourth, and fifth lags SI during the COVID period have a statistically significant and negative impact on the ER. Hence, the second hypothesis is accepted in all sub-periods of study. This result is supported by a previous study by Tsai (Citation2012). Wald joint significance test also confirms the significant direct unidirectional impact of SI changes on ER during all the sub-periods of study. These results are complemented by VAR Granger Causality Tests (as shown in Figure ) which confirm unidirectional causality running from SI to ER and supported by Hatemi–J and Irandoust (Citation2002).
Finally, results also show that the impact of OP changes on the ER is statistically insignificant both in the pe-COVID and overall period. However, the fourth lag of OP is statistically positively significant at 1% level of significance during the COVID period, highlighting the depreciation of domestic currency (i.e., PKR).
This conclusion is supported by the work of Kin and Courage (Citation2014). However, Wald joint significant test concludes that there is an insignificant direct impact of OP variable with its all lags on ER in all sub-periods of study. Furthermore, the VAR Granger Causality test (as shown in Figure ) confirms that OP does not granger cause ER in all sub-periods of study. This conclusion is in confirmation with previous studies (Sari et al., Citation2010; Pershin et al., Citation2016). Hence, this
conclusion helps rejecting the third hypothesis. It is imperative to note that the insignificant impact of OP on SI in pre-COVID and overall period became significant during COVID period along with insignificant direct impact of OP on ER in all sub-periods of study. So, the fourth hypothesis is accepted concluding that SI acted as a transmission channel and, hence as a mediator, in between OP and ER during COVID period.
4.3. Impulse Response Functions
show the result of IRFs. IRFs are applied to assess the short-run dynamics of the economic variables. Both employ the Cholesky Decomposition for identification process. IRFs show the effect of an unanticipated shock in one variable upon itself and on all other variables.
Figure 2. Impulse-Response-Function pre-COVID period. Source: Author’s own.
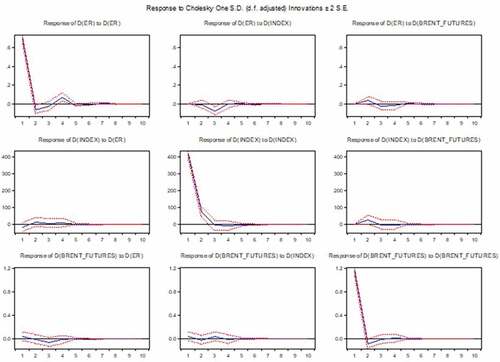
Figure 3. Impulse-Response-Function during COVID period. Source: Author’s own.
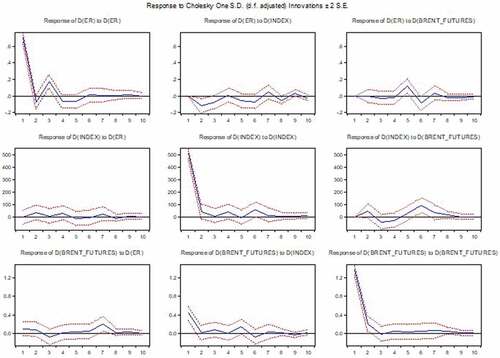
Figure 4. Impulse-Response-Function in overall period. Source: Author’s own.
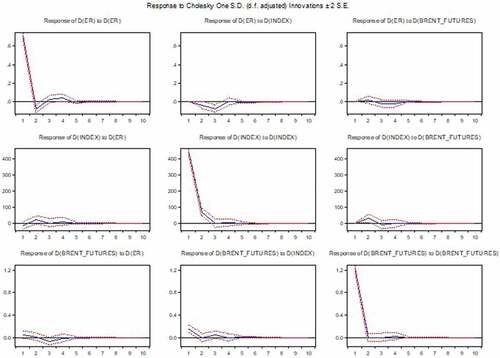
A positive shock of SI to ER shows an abrupt fall in ER in pre-COVID and overall period (as shown in Figures ) and tapers off quickly after period 4. However, during COVID period, response of ER to SI continues up to 10th period after which it starts to fade out gradually (as shown in ). This shows the persistence of sentiment of market participants during the COVID period. A decrease (increase) in ER means appreciation (depreciation) of domestic currency (i.e., PKR). These results are in confirmation with the results of VAR model.
The response of ER to positive shock in OP is immediate and generates both positive and negative effects which disappear quickly in the pre-COVID and overall period (as shown in and gradually during the COVID period (as shown in Figure ). In the case of SI, the greatest response to OP is shown in the sixth period during COVID period.
4.4. Variance Decomposition
Tables show VDCs of variables in pre-COVID and during the COVID period, respectively. VDCs display how much of variability in the dependent variable is contributed by its own shocks compared to the shocks to other endogenous variables in the system of equations. Results of VDCs show that SI and OP (OP), in the VDCs of ER (SI), have no contemporaneous effect on ER (SI) in period 1 with zero values of SI and OP (OP) in both the pre-COVID and during COVID period. In period 1, 100% of the variability in the ER is explained by its own shock both in the pre-COVID and during COVID periods which gradually decreases to 98.42% (89.75%) in period 10 in the pre-COVID (during COVID) period with the rest of the variability of 1.17% (6.03%) and 0.41% (4.22%) explained by SI and OP, respectively.
Table 6. Variance Decompositions (VDCs)—pre-COVID period
Table 7. Variance Decompositions (VDCs)—during COVID period
Results also show that OP explains 99.77% of its own variability in period 1 in the pre-COVID period (which remains almost unchanged at 99.31% in period 10), while ER and SI explain the rest of the minimal variability of 0.12% and 0.11% in OP respectively. However, it is imperative to note that during the COVID period, the own variability of OP significantly reduced to 90.36% which further falls to 86.68% in period 10. In the meanwhile, variability in OP explained by SI significantly increased to 9.15% during the COVID period (which further increases to 10.18% in period 10) from its low of 0.11% in the pre-COVID period. Furthermore, the explanation of variability in VDCs of SI by OP increased to 5.6% in period 10 during the COVID period from the lowest of 0.0% in period 1 in the pre-COVID period. These two phenomena highlight the fact that OP started impacting the SI during the COVID period and helped SI act as a transmission channel (and hence, a mediator) in between OP and ER. This conclusion agrees with the results of VAR model.
5. Conclusion and Policy implications
This research explores the trilateral relationship between OP, stock market, and exchange rate in the economic background of the Pakistani economy using the VAR model for the period spanning from 4 January 2016 to 30 April 2021. This paper attempts to analyze a novel idea of mediating the role of SI in between OPs and exchange rate during the COVID period by analyzing the joint relationship among the variables and splitting the whole sample period into three sub-sample periods. The results of this study suggest that OP changes have an insignificant positive joint impact on SI in both pre-COVID and overall sub-periods of study while statistically significant and positive impact during the COVID period. The results are in line with Le and Chang (Citation2015). Granger causality test confirms that there is a unidirectional causality running from OPs to SI during the COVID period only.
The results of the study also suggest that changes in SI have a statistically significant and negative impact on the exchange rate with causality running from SI to exchange rate in all sub-periods of study. It means, rising stock prices lead to an appreciation of domestic currency (i.e., PKR). These results have important implications for investors, traders, oil and gas companies and policymakers in terms of investing, hedging the trades against negative OP shocks and taking correct policy measures during the COVID-19 period. Furthermore, this research found the mediating role of stock market indices in between the exchange rate and OP shocks. Therefore, importers, exporters and forex traders should consider the stock price inflation or deflation because stock price decline (appreciative pressure) is harmful (beneficial) for local exchange rate. Moreover, when the local currency appreciated, it increases the revenues of local importers but also burdened the local exporters by elevating their expenses and liabilities. This research also found that health related uncertainty has activated the transmission channel of stock market indices for transmission of shocks from OP towards the exchange rate. Therefore, forex traders and investors during the Covid-19 must oversee the transmission of shocks from OP rather than taking decision on the basis of direct nexus between ER-OP and ER-SM, respectively. As this research found the mediating factor of stock market prices between OP and ER, whereas future researches should understand the mediating role of ER in between the other two variables of interest. Furthermore, researches should analyze the moderating impact of OPs on the dynamic conditional correlation (DCC) between SM and ER. The moderating effect can be estimated by using NARDL framework for studying direct influence of OP on the DCCs between SM and ER.
Disclosure statement
No potential conflict of interest was reported by the author(s).
Additional information
Funding
Notes on contributors
Mosab I. Tabash
Mosab I. Tabash is currently working as Associate Professor at the College of Business, Al Ain University, UAE. He has published many papers in journals of repute. His research interests include finance, Islamic banking, monetary policies, financial performance, and investments.
Zaheeruddin Babar
Zaheeruddin Babar is working at the Faculty of Management Studies, University of Central Punjab, Pakistan. He possesses several professional and academic degrees and have greater focus on practice-oriented research. He has published many papers in journals of repute indexed by Scopus, WOS, and ABDC.
Umaid A Sheikh
Umaid A. Sheikh has completed several academic degrees including BBA-Hons and Master of Business Administration from Comsats University, Islamabad. His research works appear in other scientific journals indexed by Scopus, WOS, and ABDC.
Ather Azim Khan
Ather Azim Khan is working as Dean of Faculty of Management and Administrative Sciences, University of Sialkot, Pakistan. He has published many papers in journals of repute.
Suhaib Anagreh
Suhaib Anagreh is working as Assistant Professor at Higher Colleges of Technology, Dubai. His area of research includes finance and banking.
References
- Adedeji, A. N., Ahmed, F. F., & Adam, S. U. (2021). Examining the dynamic effect of COVID-19 pandemic on dwindling oil prices using structural vector autoregressive model. Energy, 230(1), 120813. https://doi.org/10.1016/j.energy.2021.120813
- Adjasi, C. K. D. (2009). Macroeconomic uncertainty and conditional stock‐price volatility in frontier African markets: Evidence from Ghana. The Journal of Risk Finance, 10(4), 333–22. https://doi.org/10.1108/15265940910980641
- Aggarwal, P., & Manish, M. K. (2020). Effect of oil fluctuation on stock market return: An empirical study from India. International Journal of Energy Economics and Policy, 10 (2), 213–217. https://www.econjournals.com/index.php/ijeep/article/view/8802
- Ahmed, A. D., & Huo, R. (2020). Linkages among energy price, exchange rates and stock markets: Evidence from emerging African economies. Applied Economics, 52(18), 1921–1935. https://doi.org/10.1080/00036846.2020.1726861
- Ajaz, T., Nain, M. Z., Kamaiah, B., & Sharma, N. K. (2017). Stock prices, exchange rate and interest rate: Evidence beyond symmetry. Journal of Financial Economic Policy, 9(1), 2–19. https://doi.org/10.1108/JFEP-01-2016-0007
- Akbar, M., Iqbal, F., & Noor, F. (2019). Bayesian analysis of dynamic linkages among gold price, stock prices, exchange rate and interest rate in Pakistan. Resources Policy, 62(1), 154–164. https://doi.org/10.1016/j.resourpol.2019.03.003
- Alamgir, F., & Amin, S. B. (2021). The nexus between oil price and stock market: Evidence from South Asia. Energy Reports, 7(1), 693–703. https://doi.org/10.1016/j.egyr.2021.01.027
- Al-hajj, E., Al-Mulali, U., & Solarin, S. A. (2018). Oil price shocks and stock returns nexus for Malaysia: Fresh evidence from nonlinear ARDL test. Energy Reports, 4(1), 624–637. https://doi.org/10.1016/j.egyr.2018.10.002
- Ali, S. R. M., Mensi, W., Anik, K. I., Rahman, M., & Kang, S. H. (2022). The impacts of COVID-19 crisis on spillovers between the oil and stock markets: Evidence from the largest oil importers and exporters. Economic Analysis and Policy, 73(1), 345–372. https://doi.org/10.1016/j.eap.2021.11.009
- Anisak, N., & Mohamad, A. (2019). Foreign Exchange Exposure of Indonesian Listed Firms. Global Business Review. (1), 0972150919843371. https://doi.org/10.1177/0972150919843371
- Areli Bermudez Delgado, N., Bermudez Delgado, E., & Saucedo, E. (2018). The relationship between oil prices, the stock market and the exchange rate: Evidence from Mexico. The North American Journal of Economics and Finance, 45(1), 266–275. https://doi.org/10.1016/j.najef.2018.03.006
- Ashraf, B. N. (2020). Stock markets’ reaction to COVID-19: Cases or fatalities? Research in International Business and Finance, 54(1), 101249. https://doi.org/10.1016/j.ribaf.2020.101249
- Bagchi, B. (2017). Volatility spillovers between crude oil price and stock markets: Evidence from BRIC countries. International Journal of Emerging Markets, 12(2), 352–365. https://doi.org/10.1108/IJoEM-04-2015-0077
- Bai, S., & Koong, K. S. (2018). Oil prices, stock returns, and exchange rates: Empirical evidence from China and the United States. The North American Journal of Economics and Finance, 44(1), 12–33. https://doi.org/10.1016/j.najef.2017.10.013
- Basher, S., Haug, A., & Sadorsky, P. (2016). The impact of oil shocks on exchange rates: A Markov-switching approach. Energy Economics, 54(C), 11–23. https://econpapers.repec.org/RePEc:eee:eneeco:v:54:y:2016:i:c:p:11-2310.1016/j.eneco.2015.12.004
- Basher, S. A., & Sadorsky, P. (2006). Oil price risk and emerging stock markets. Global Finance Journal, 17(2), 224–251. https://doi.org/10.1016/j.gfj.2006.04.001
- Benkraiem, R., Lahiani, A., Miloudi, A., & Shahbaz, M. (2018). New insights into the US stock market reactions to energy price shocks. Journal of International Financial Markets, Institutions and Money, 56(1), 169–187. https://doi.org/10.1016/j.intfin.2018.02.004
- Ceylan, R., Ivrendi, M., Shahbaz, M., & Omay, T. (2020). Oil and stock prices: New evidence from a time varying homogenous panel smooth transition VECM for seven developing countries. International Journal of Finance and Economics. (1), 1–16. https://doi.org/10.1002/ijfe.2202
- Chang, B. H., Bhutto, N. A., Turi, J. A., Hashmi, S. M., & Gohar, R. (2021). Macroeconomic variables and stock indices: An asymmetric evidence from quantile ARDL model. South Asian Journal of Business Studies, 10(2), 242–264. https://doi.org/10.1108/SAJBS-09-2019-0161
- Chen, -S.-S., & Chen, H.-C. (2007). Oil prices and real exchange rates. Energy Economics, 29(3), 390–404. https://doi.org/10.1016/j.eneco.2006.08.003
- Chen, H., Liu, L., Wang, Y., & Zhu, Y. (2016). Oil price shocks and U.S. dollar exchange rates. Energy, 112(1), 1036–1048. https://doi.org/10.1016/j.energy.2016.07.012
- Cho, J. S., Kim, T., & Shin, Y. (2015). Quantile cointegration in the autoregressive distributed-lag modeling framework. Journal of Econometrics, 188(1), 281–300. https://doi.org/10.1016/j.jeconom.2015.05.003
- Chortareas, G., Cipollini, A., & Eissa, M. A. (2011). Exchange rates and stock prices in the MENA Countries: What Role for Oil? Review of Development Economics, 15(4), 758–774. https://doi.org/10.1111/j.1467-9361.2011.00641.x
- Cunado, J., & Perez de Gracia, F. (2014). Oil price shocks and stock market returns: Evidence for some European countries. Energy Economics, 42(1), 365–377. https://doi.org/10.1016/j.eneco.2013.10.017
- Das, D., & Kannadhasan, M. (2020). The asymmetric oil price and policy uncertainty shock exposure of emerging market sectoral equity returns: A quantile regression approach. International Review of Economics & Finance, 69(1), 563–581. https://doi.org/10.1016/j.iref.2020.06.013
- Diebold, F. X., & Yilmaz, K. (2012). Better to give than to receive: Predictive directional measurement of volatility spillovers. International Journal of Forecasting, 28(1), 57–66. https://doi.org/10.1016/j.ijforecast.2011.02.006
- Dornbusch, R., & Fischer, S. (1980). Exchange rates and the current account. American Economic Review, 7(5), 960–971. American economic Association .
- El-Masry, A. A., & Badr, O. M. (2021). Stock market performance and foreign exchange market in Egypt: Does 25th January revolution matter? International Journal of Emerging Markets, 16(6), 1048–1076. https://doi.org/10.1108/IJOEM-11-2017-0477
- Fayyad, A., & Daly, K. (2011). The impact of oil price shocks on stock market returns: Comparing GCC countries with the UK and USA. Emerging Markets Review, 12(1), 61–78. https://doi.org/10.1016/j.ememar.2010.12.001
- Gharib, C., Mefteh-Wali, S., & Jabeur, S. B. (2021). The bubble contagion effect of COVID-19 outbreak: Evidence from crude oil and gold markets. Finance Research Letters, 38(1), 101703. https://doi.org/10.1016/j.frl.2020.101703
- Ghulam, A., McMillan, D. G., & Wang, S. (2018). Conditional volatility nexus between stock markets and macroeconomic variables. Journal of Economic Studies, 45(1), 77–99. https://doi.org/10.1108/JES-03-2017-0062
- Golub, S. (1983). Oil Prices and Exchange Rates. The Economic Journal, 93(371), 576–593. https://doi.org/10.2307/2232396
- Habib, M. M., Bützer, S., & Stracca, L. (2016). Global exchange rate configurations: Do oil shocks matter? IMF Economic Review, 64(3), 443–470. https://doi.org/10.1057/imfer.2016.9
- Hadhri, S. (2021). The nexus, downside risk and asset allocation between oil and Islamic stock markets: A cross-country analysis. Energy Economics, 101(1), 105448. https://doi.org/10.1016/j.eneco.2021.105448
- Hatemi–J, A., & Irandoust, M. (2002). On the causality between exchange rates and stock prices: A Note. Bulletin of Economic Research, 54(2), 197–203
- He, X., Mishra, S., Aman, A., Shahbaz, M., Razzaq, A., & Sharif, A. (2021). The linkage between clean energy stocks and the fluctuations in oil price and financial stress in the US and Europe? Evidence from QARDL approach. Resources Policy, 72(1), 102021. https://doi.org/10.1016/j.resourpol.2021.102021
- Hussain, C. B. (2019). Dynamic analysis of the relationship between stock prices and macroeconomic variables. In M. M. Saeed (Ed.), South Asian Journal of Business Studies,1–32. Emerald . https://doi.org/10.1108/SAJBS-06-2018-0062
- Iqbal, N., Naeem, M. A., & Suleman, M. T. (2022). Quantifying the asymmetric spillovers in sustainable investments. Journal of International Financial Markets, Institutions and Money, 77(1), 101480. https://doi.org/10.1016/j.intfin.2021.101480
- Ivanovski, K., & Hailemariam, A. (2021). Forecasting the dynamic relationship between crude oil and stock prices since the 19th century. Journal of Commodity Markets, 24(1), 100169. https://doi.org/10.1016/j.jcomm.2021.100169
- Izzeldin, M., Muradoğlu, Y. G., Pappas, V., & Sivaprasad, S. (2021). The impact of Covid-19 on G7 stock markets volatility: Evidence from a ST-HAR model. International Review of Financial Analysis, 74(1), 101671. https://doi.org/10.1016/j.irfa.2021.101671
- Jiang, Y., Wang, G.-J., Ma, C., & Yang, X. (2021). Do credit conditions matter for the impact of oil price shocks on stock returns? Evidence from a structural threshold VAR model. International Review of Economics & Finance, 72(1), 1–15. https://doi.org/10.1016/j.iref.2020.10.019
- Ji, Q., Shahzad, S. J. H., Bouri, E., & Suleman, M. T. (2020). Dynamic structural impacts of oil shocks on exchange rates: Lessons to learn. Journal of Economic Structures, 9(1), 20. https://doi.org/10.1186/s40008-020-00194-5
- Kin, S., & Courage, M. (2014). The impact of oil prices on the exchange rate in South Africa. Journal of Economics, 5(2), 193–199. https://doi.org/10.1080/09765239.2014.11884996
- Kocaarslan, B., & Soytas, U. (2019a). Dynamic correlations between oil prices and the stock prices of clean energy and technology firms: The role of reserve currency (US dollar). Energy Economics, 84(1), 104502. https://doi.org/10.1016/j.eneco.2019.104502
- Kocaarslan, B., & Soytas, U. (2019b). Asymmetric pass-through between oil prices and the stock prices of clean energy firms: New evidence from a nonlinear analysis. Energy Reports, 5(1), 117–125. https://doi.org/10.1016/j.egyr.2019.01.002
- Krugman, P. R., Bhandari, J. S., & Putnam, B. H. (1983). Economic Interdependence and flexible exchange rates. MIT Press.
- Kumar, S. (2019). Asymmetric impact of oil prices on exchange rate and stock prices. The Quarterly Review of Economics and Finance, 72(1), 41–51. https://doi.org/10.1016/j.qref.2018.12.009
- Kumeka, T. T., Uzoma-Nwosu, D. C., & David-Wayas, M. O. (2022). The effects of COVID-19 on the interrelationship among oil prices, stock prices and exchange rates in selected oil exporting economies. Resources Policy, 77(1), 102744. https://doi.org/10.1016/j.resourpol.2022.102744
- Le, T. H., & Chang, Y. (2015). Effects of oil price shocks on the stock market performance: Do nature of shocks and economies matter? Energy Economics, 51(1), 261–274. https://doi.org/10.1016/j.eneco.2015.06.019
- Li, C., Lin, S., Sun, Y., Afshan, S., & Yaqoob, T. (2022). The asymmetric effect of oil price, news-based uncertainty, and COVID-19 pandemic on equity market. Resources Policy, 77(1), 102740. https://doi.org/10.1016/j.resourpol.2022.102740
- Lin, B., & Su, T. (2020). Does oil price have similar effects on the exchange rates of BRICS? International Review of Financial Analysis, 69(1), 101461. https://doi.org/10.1016/j.irfa.2020.101461
- Liu, Z., Huynh, T. L. D., & Dai, P.-F. (2021). The impact of COVID-19 on the stock market crash risk in China. Research in International Business and Finance, 57(1), 101419. https://doi.org/10.1016/j.ribaf.2021.101419
- Lv, X., Lien, D., & Yu, C. (2020). Who affects who? Oil price against the stock return of oil-related companies: Evidence from the U.S. and China. International Review of Economics & Finance, 67(1), 85–100. https://doi.org/10.1016/j.iref.2020.01.002
- Managi, S., Yousfi, M., Ben Zaied, Y., Ben Mabrouk, N., & Ben Lahouel, B. (2022). Oil price, US stock market and the US business conditions in the era of COVID-19 pandemic outbreak. Economic Analysis and Policy, 73(1), 129–139. https://doi.org/10.1016/j.eap.2021.11.008
- Mensi, W., Hkiri, B., Al-Yahyaee, K. H., & Kang, S. H. (2018). Analyzing time–frequency co-movements across gold and oil prices with BRICS stock markets: A VaR based on wavelet approach. International Review of Economics & Finance, 54(1), 74–102. https://doi.org/10.1016/j.iref.2017.07.032
- Olayeni, O. R., Tiwari, A. K., & Wohar, M. E. (2020). Global economic activity, crude oil price and production, stock market behaviour and the Nigeria-US exchange rate. Energy Economics, 92(1), 104938. https://doi.org/10.1016/j.eneco.2020.104938
- Pershin, V., Molero, J. C., & de Gracia, F. P. (2016). Exploring the oil prices and exchange rates nexus in some African economies. Journal of Policy Modeling, 38(1), 166–180. https://doi.org/10.1016/j.jpolmod.2015.11.001
- Reboredo, J. C. (2012). Modelling oil price and exchange rate co-movements. Journal of Policy Modeling, 34(3), 419–440. https://doi.org/10.1016/j.jpolmod.2011.10.005
- Reddy, Y. V., & Sebastin, A. (2008). Interaction between forex and stock markets in India: An entropy approach. Vikalpa, 33(4), 27–46. https://doi.org/10.1177/0256090920080403
- Sari, R., Hammoudeh, S., & Soytas, U. (2010). Dynamics of oil price, precious metal prices, and exchange rate. Energy Economics, 32(2), 351–362. https://doi.org/10.1016/j.eneco.2009.08.010
- Shahrestani, P., & Rafei, M. (2020). The impact of oil price shocks on Tehran stock exchange returns: Application of the Markov switching vector autoregressive models. Resources Policy, 65(43), 101579. https://doi.org/10.1016/j.resourpol.2020.101579
- Sharif, A., Aloui, C., & Yarovaya, L. (2020). COVID-19 pandemic, oil prices, stock market, geopolitical risk and policy uncertainty nexus in the US economy: Fresh evidence from the wavelet-based approach. International Review of Financial Analysis, 70(1), 101496. https://doi.org/10.1016/j.irfa.2020.101496
- Shear, F., & Ashraf, B. N. (2022). The performance of Islamic versus conventional stocks during the COVID-19 shock: Evidence from firm-level data. Research in International Business and Finance, 60(1), 101622. https://doi.org/10.1016/j.ribaf.2022.101622
- Sheikh, U., Ahmed, D. Z., Asad, D. M., Ahmed, D. Z., & McMillan, D. (2020). Asymmetrical relationship between oil prices, gold prices, exchange rate and stock prices during global financial crisis 2008; evidence from Pakistan. Cogent Economics & Finance, 8(1), 1757802. https://doi.org/10.1080/23322039.2020.1757802
- Sims, C. A. (1980). Macroeconomics and Reality. Econometrica, 48(1), 1–48. https://doi.org/10.2307/1912017
- Tawfeeq, M., Collins, A. R., Elbakidze, L., & Zaynutdinova, G. (2019). Linking crude oil prices and Middle East stock markets. OPEC Energy Review, 43(2), 136–167. https://doi.org/10.1111/opec.12145
- Tsai, I. C. (2012). The relationship between stock price index and exchange rate in Asian markets: A quantile regression approach. Journal of International Financial Markets, Institutions and Money, 22(3), 609–621. https://doi.org/10.1016/j.intfin.2012.04.005
- Tuna, G., & Tuna, V. E. (2022). Are effects of COVID-19 pandemic on financial markets permanent or temporary? Evidence from gold, oil and stock markets. Resources Policy, 76(1), 102637. https://doi.org/10.1016/j.resourpol.2022.102637
- Wang, Z.-J., & Zhao, L.-T. (2021). The impact of the global stock and energy market on EU ETS: A structural equation modelling approach. Journal of Cleaner Production, 289(1), 125140. https://doi.org/10.1016/j.jclepro.2020.125140
- Wen, D., Liu, L., Ma, C., & Wang, Y. (2020). Extreme risk spillovers between crude oil prices and the U.S. exchange rate: Evidence from oil-exporting and oil-importing countries. Energy, 212(1), 118740. https://doi.org/10.1016/j.energy.2020.118740
- Youssef, M., & Mokni, K. (2020). Modeling the relationship between oil and USD exchange rates: Evidence from a regime-switching-quantile regression approach. Journal of Multinational Financial Management, 55(1), 100625. https://doi.org/10.1016/j.mulfin.2020.100625
- Zaighum, I., Aman, A., Sharif, A., & Suleman, M. T. (2021). Do energy prices interact with global Islamic stocks? Fresh insights from quantile ARDL approach. Resources Policy, 72(1), 102068. https://doi.org/10.1016/j.resourpol.2021.102068
- Zeinedini, S., Karimi, M. S., & Khanzadi, A. (2022). Impact of global oil and gold prices on the Iran stock market returns during the Covid-19 pandemic using the quantile regression approach. Resources Policy, 76(1), 102602. https://doi.org/10.1016/j.resourpol.2022.102602
- Zhang, X., Ding, Z., Hang, J., & He, Q. (2022). How do stock price indices absorb the COVID-19 pandemic shocks? The North American Journal of Economics and Finance, 60 (1), 101672. https://doi.org/10.1016/j.najef.2022.101672