
 ?Mathematical formulae have been encoded as MathML and are displayed in this HTML version using MathJax in order to improve their display. Uncheck the box to turn MathJax off. This feature requires Javascript. Click on a formula to zoom.
Abstract
Examining China’s stock market, mean variance is used to measure returns and risk and build an irrational risk-asset pricing model. The power of heterogeneous beliefs and risk-valuation deviation are found to affect capital asset pricing, presenting excessive fluctuations that neoclassical finance theory cannot easily explain. A diversified portfolio can disperse or aggregate irrational risk. Trading frequency and quantity reflect differences in investors’ rationality and reveal irrational risk effects. On that basis, regulatory tools and derivative products can be designed to build a rational risk anchor, prevent the systematic bias of irrational risk, and improve capital allocation.
PUBLIC INTEREST STATEMENT
Is the capital market a paradise for value investment? Why does diversification also make it difficult to manage and control risk? Why is it that arbitrage often cannot correct extreme market behavior and price manipulation? Intravalue is the anchor of capital market stability. Sometimes, the market is effective, and risks can be dispersed through portfolio allocation and value exploration. However, the market is also a game of “will and power.” Owing to the disturbance of information, when the systematic deviation of irrational risk forms, it will lead to violent price fluctuations. Individuals’ responses to information should be consistent with the overall response of the market. The overall behavior of the transaction price, target, quantity, and timing are intuitive tools for monitoring irrational risks.
1. Introduction
Neoclassical finance theory assumes that investors are rational, predictable, and consistent in their behavior under risk. Variance in the expected rate of return distribution is used to measure a portfolio’s risk. The portfolio with the highest expected rate of return at a given level of risk will be the best portfolio choice for investors (Markowitz, Citation1952). According to the capital asset pricing model (CAPM), investors’ optimal decisions should be made along the capital allocation line with the slope of the beta coefficient, and the risk-preference characteristics of investors influence their investment decisions under uncertainty (Sharpe, Citation1964).
Real investors, however, are not homogenously rational, as assumed by neoclassical finance theory. Researchers have questioned homogenous rationality, suggesting that investors only possess bounded rationality, under certain constraints of cognitive ability, behavioral ability, and egoism (Simon, Citation2002). Indeed, there are three bounds of human nature: limited rationality, limited willpower, and limited self-interest (Mullainathan & Thaler, Citation2001).
Researchers have verified market anomalies that neoclassical finance theory cannot easily explain. Specifically, a scale effect commonly exists in the markets of various countries: the larger the company, the lower its stock return rate (Banz, Citation1981). Analyzing the relationship between long-term stock price fluctuations and dividend changes reveals that excessive volatility and irrational bubbles exist in the market (Shiller, Citation2005). Further, a significant positive correlation exists between price and trading volume (Genesove & Mayer, Citation2001). Excessive trading with a high turnover rate exists (Odean, Citation1999; Sprenger et al., Citation2014). High returns will attract abnormal attention, which will become involved in trading (Barber et al., Citation2008; Da et ai., Citation2011; Hirshleifbr et al., Citation2009; Jinesh et al., Citation2021). In contrast to relative momentum payoffs, risk-managed momentum payoffs remain substantial even in extended time frames(Simarjeet et al., Citation2022). Such phenomena are not easily explained by neoclassical finance theory and in turn reveal differences in investors’ rationality.
Based on investors’ bounded rationality, real-world decision-making behaviors under uncertainty are diverse (Kahneman & Tversky, Citation1979). Markets consist of multiple layers of rational investors and noise. When noise is included in asset pricing theory, asset prices will deviate from CAPM predictions (De Long et al., Citation1990). Under the influence of noise trader risk, the effective mean-variance boundary of a market portfolio will deviate from the CAPM level (Shefrin & Statman, Citation1994). Mood fluctuations are defined as changes in investors’ preference structure parameters (subjective discount factor and risk-aversion factor), and small changes in the subjective discount factor can lead to large fluctuations in stock prices (Mehra & Sah, Citation2002).
There is evidence of irrational psychology or behaviors among investors—such as overconfidence bias, anchoring bias, loss aversion bias, and herd bias—in the capital markets of developed economies, such as France and the UK (Benkraiem et al., Citation2019) and the US (Gary, Citation2016). Evidence can also be found in emerging economies, such as Vietnam (Xuan & Dang, Citation2019), India (Jain et al., Citation2019; Muskan et al., Citation2021, Citation2022), Pakistan (Kashif et al., Citation2020), and Ghana (Banyen & Nkuah, Citation2015). Moreover, there is evidence of such phenomena in other markets, such as cryptocurrencies (Ghulame et al., Citation2022) and money markets (David & Alireza, Citation2020). Driven by incomplete information, psychological feedback, cognitive bias, and behavioral blindness, individual beliefs and behavioral biases are strengthened by the positive feedback mechanism of market price. This leads to irrationally optimistic fanaticism and irrationally pessimistic panic through market sentiment and social contagion, resulting in systematic group biases. Finally, part of the deviation in financial markets evolves into a systematic and comprehensive overall abnormal market performance.
Under the premise of homogeneity and rationality, neoclassical financial theory focuses on studying information contained in the price, with the transaction price as the main research object. With the rise of behavioral finance, researchers have incorporated psychology to identify the factors that influence pricing. In transaction behavior, the technical analysis school uses securities investment technology to empirically investigate the quantity, time, and price of trading. In addition to transaction price, transaction behavior (e.g., decisions about the transaction target, transaction quantity, and transaction timing) also contains information about investors’ heterogeneous beliefs, as well as information about the conversion of heterogeneous beliefs, which is an intuitive tool for monitoring irrational risks. The goal of the present study, therefore, is to introduce the proportion of investment (e.g., turnover rate of changes in investment ratio) into the pricing model to illustrate the possible effects of irrational risks.
This paper first describes heterogeneous rationality in China’s stock market, because it is an emerging capital market in a country with a rapidly growing economy. Then, the mean-variance method of Markowitz’s asset portfolio theory is used to measure returns and risk, and an asset-pricing model based on rational heterogeneity is constructed for comparison with neoclassical finance theory to show how asset pricing is affected by differences in rationality, which may lead to irrational risk bias. The power transformation reflecting investment proportion and the expression of risk-valuation deviation can be measured and described based on the number and frequency of transactions. This can provide ideas for improving the efficiency of capital allocation and controlling the deviation of irrational risks.
2. Irrational risk influence on diversified risk-asset portfolios
2.1. Scale effect and attention-driven transactions in the Chinese stock market
The market measure of exchange activity and the premium can be observed by selecting the turnover rate (traded share capital/total share capital) and the turnover rate premium. The data used in this study come from the Wind Financial Terminal and include transaction data for all listed A-share companies in China, for a total of 1,272 companies (excluding those listed after the initial point and delisted during the study period), covering 191 consecutive months from 1 January 2005, to 30 November 2020. Based on the total amount of share capital at the beginning of the period (ranked from small to large), the companies were grouped into 24 portfolios, each of which consists of 53 listed companies who all have the same amount of investment. Specifically, from P1 to P24, the portfolios range from companies with a small amount of share capital to those with a large amount. The association between the range of the monthly average return rate (YIELD, %) and of the daily turnover rate (ADTR1, %), excluding the suspension date, is observed based on current total share capital. The underlying index is calculated as the monthly average of the Shanghai Composite Index and the Shenzhen Component Index in the same period. The risk-free rate is 2.5%.
Comparing these portfolios, as total equity increases, YIELD decreases, and ADTR1 decreases. This means that smaller portfolios trade more actively, turn over more frequently, and earn higher returns ().
Figure 1. Price-volume trend chart of change in equity capital.
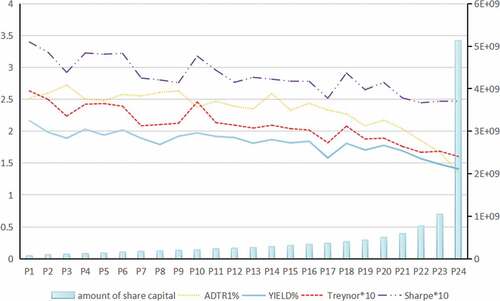
Andrea et al. (Citation2018) introduced six factors, including the size factor “small-minus-big” (a strategy of going long on small stocks and short on large stocks). They suggest that Buffett’s returns are largely attributable to stock selection, and that Berkshire’s diminishing returns are related to an initial focus on small firms and a later bias toward larger stocks. Fama and French (Citation1992) suggest that the scale effect is only a manifestation of risk premium; the smaller the company size, the greater the risk, and the higher return compensates for the high risk. However, the Treynor coefficient and the Sharpe coefficient of the 24-asset portfolio also decreases simultaneously, indicating that the small-equity portfolio has a higher relative risk return per unit. In terms of the average range of rise and fall, P1, P2, P3, and P4 increase by 13.3, 8.3, 6.8, and 12.6 times, respectively, while P21, P22, P23, and P24 increase by 4.6, 6.3, 4.1, and 5.9 times, respectively. The CSI 300 (China Securities Index), underlying asset of Stock Index Futures and Exchange Traded Funds, increases by five times.
The correlation coefficient between YIELD and ADTR1 is 0.835558, indicating a good correlation. The Granger causality test for the sequence shows bidirectional causality from ADTR1 to YIELD. That is, YIELD has a significant positive effect on ADTR1, and ADTR1 has a significant positive effect on YIELD. This indicates that positive feedback exists between attention-driven and excessive trading. When the return is high, the risk exchange frequency is more frequent, and when the return is low, the willingness for risk exchange is less. The two-way influence of trading behavior on price decision-making and price change on trading behavior embodies the role of irrational risk. Is the endogeneity bias or omitted-variable bias a value factor or an information factor?
2.2. An irrational risk-asset pricing model
The returns of assets tend to be partially correlated with each other. In addition to the risk factors of the underlying assets, some of the returns come from the actors’ understanding of, and behavior coordination based on, information in the market, or even from behavioral coordination with each other. The definition of uncertainty in investors’ cognitive and behavioral biases in capital asset price decision-making is distinguished from the definition of rational risk (RR) under the rationality condition of neoclassical finance theory, which can be defined as irrational risk (IR). The expected return rate of a single asset (or portfolio of assets) is a linear function that contains two groups of factors affecting the return rate of the asset: rational risk and irrational risk. Trading activity includes the exchange of irrational pessimism (IP) and irrational optimism (IO) relative to the forecast of homogenous rationality.
Assume the capital market is composed of a risk-free asset f ( is quantity at time t) and a risk asset (
is quantity at time t;
is price); transaction costs are zero. Investors’ optimistic expectations are consistent with and in the same direction as the absolute rational risks, and irrationally optimistic investors will allocate high-risk assets. Assume there is a positive correlation between the irrationally optimistic asset IO and the rational asset RR; that is,
. Later, this will be relaxed in favor of more restrictive assumptions. Assume that in a Z portfolio, there are both rational investors and irrationally optimistic investors. If the investment ratio of rational investors is λ, and that of irrationally optimistic investors is 1-λ, and yield is r, then,
Rearranging EquationEquations (1)(1)
(1) and (Equation2
(2)
(2) ) yields
Namely, the yields of Z portfolios from the two elements is the product of the RR-sensitive coefficient and RR yield;
is the product of the IO-sensitive coefficient and IO yield. Further arrangement yields
Investors use three stages (t = 1, 2, 3) to complete investment transactions. The time stages refer to the cycle of heterogeneous belief conversion: the initial period, irrational optimism, and rationality. Investors have a limited amount to invest. Market information is , investors’ cash flow is
, the number of irrationally optimistic investors is
, and collected market information is
. Irrationally optimistic investors cannot accurately anticipate risk-asset prices and believe they are independent, following a normal distribution.
Investors risk repugnance, and their utility function is , where
is the absolute risk-aversion coefficient, and
is wealth. The equilibrium price-risk valuation of rational investors is
, the risk valuation of the irrationally optimistic equilibrium price is
, and k is the deviation degree of risk valuation; the value is overestimated when
.
The investor’s decision at time t = 1, 2, 3 based on utility maximization and exchange point equivalence is given by
At t = 3, based on standard normal distribution, EquationEquation (5)(5)
(5) becomes
The optimization of EquationEquation (6)(6)
(6) yields
. Thus, the optimal decision of investors is
According to the right triangle altitude theorem, irrationally optimistic investment expectation and its variance are
Then, the expectation function value and covariance value of investors’ investment are
which further yield
The first-order condition is
According to the equilibrium principle of capital markets, and
, and the asset pricing at t = 3 is
Similarly, the asset pricing at t = 2 is
According to EquationEquations (4)(4)
(4) and (Equation17
(17)
(17) ), asset pricing consists of three elements: the risk-free rate of return, the product of the rational risk premium and factor sensitivity, and the product of the irrational risk premium and factor sensitivity. The irrational risk premium originates from the disturbance of market information I, which leads to differences in investors’ expectations. Factor sensitivity depends on the correlation between irrational risk and rational risk. When
, irrational risk is positively correlated with rational risk; that is, irrational optimism. When
, irrational risk is negatively correlated with rational risk; that is, irrational pessimism.
2.3. Aggregation effect of irrational risk
Assume that in a Z portfolio of n securities, each security has the same amount of investment, the investment proportion of each security is , and the respective risks of n securities are
, in which the least risk is greater than a constant
, and the greatest risk is less than a constant
. When the correlation coefficient is
, it means that n securities’ returns show irrational optimism, and they have a positive correlation with each other:
Therefore, even if n tends to infinity—that is, as the number of securities in the portfolio increases infinitely—the risk of the portfolio will always be between the lowest and highest risk level, and risks cannot be effectively dispersed. In other words, when an information disturbance leads to irrational expectation overlap among investors, their trading strategies, based on the hypothesis of efficient market behavior, are mutually irrelevant, and mutual offset cannot be achieved. Based on EquationEquations (16)(16)
(16) and (Equation17
(17)
(17) ), the variance of P describes the fluctuation in capital market prices as
Taking the partial derivatives with respect to k yields
The volatility of capital market prices is a diminishing function of investors’ irrational optimism—that is, the more investors overestimate the capital market, the greater the asset-price volatility, and the greater the likelihood of ·price-fluctuation risk. Meanwhile, when investors are irrationally pessimistic, the more they underestimate the capital market, the lower the asset-price volatility.
2.4. Systemic bias of irrational risks
Because of the disturbance and influence of information, capital market investors may occupy a position between rational and irrational, between irrational pessimism and irrational optimism. This is caused by the rational risk of the investment target itself, as well as the irrational pessimism and irrational optimism caused by differences in investors’ rationality.
Assume that for asset Z, its price is determined by three heterogeneous beliefs: RR, IO, and IP. RR is positively correlated with IO while IP is negatively correlated with RR and IO; later, it will be relaxed in favor of more restrictive assumptions. That is, ,
, and
; λ is the investment ratio. Thus, we have
The effective portfolio of all investment ratios of the asset portfolio with three heterogeneous beliefs is within the polygon interval of ABXYC shown in . When RR is positively correlated with the IO, and IP is negatively correlated with or irrelevant to the RR and IO, the actual effective portfolio set is the uncertain and dynamically changing interval represented by IR.
Figure 2. Asset portfolio with three heterogeneous beliefs.
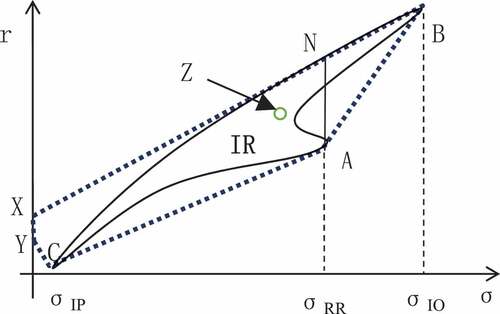
RR represents the influence of rational investors on price, IO represents the influence of irrationally optimistic investors on price, and IP represents the influence of irrationally pessimistic investors on price. The influence of irrational risk leads to actual asset risk allocation around the rational risk point of the benchmark equilibrium. The greater the influence of irrational risk, the more likely it is to deviate from the rational risk point of the benchmark equilibrium, thus forming an obvious equity premium (Mehra, Citation2008; Siegel & Thaler, Citation1997).
Combined with the irrational risk-asset pricing model, the risk-return deviation equilibrium of asset Z is affected by two factors: the investment ratio λ and the risk-valuation deviation degree k. These can be measured by the turnover rate and turnover rate premium. The irrational risk effects of the three heterogeneous beliefs are described as four effects:
2.5. Rational risk anchor
When λRRσRR has a large proportion of risks in the portfolio, rational risks contribute more, and the portfolio is less influenced by irrational risks. On the one hand, the risk-valuation deviation k of irrational risks is low, which depends on guiding investors to establish relatively rational risk-valuation expectations. On the other hand, this also means the greater the rational investment, the better it can stabilize the market. Since institutions are more capable of acquiring and processing information than individual investors, it is generally believed that institutions are more rational than individual investors. Therefore, compared with individual investors, securities markets with a higher proportion of institutional investors have a relatively stable overall market volatility.
When λRRσRR takes a small proportion of a portfolio’s risks, the portfolio is more affected by irrational risks, the critical equilibrium of irrational risk dispersion becomes less clear and more difficult to stabilize, and the price fluctuations become more extreme and frequent, presenting excessive fluctuations that neoclassical finance theory cannot easily explain. When a large number of investors are guided by incorrect information, and consistent feedback synergy (or even blind synergy) affects asset pricing, there will be an irrational risk-aggregation effect, leading to irrational exuberance or irrational panic.
2.6. Irrational risk-aggregation effect: Irrational exuberance
When λIOσIO has a large proportion of a portfolio’s risk, it indicates that irrational optimism contributes more to the risk, especially when σIO is very high compared with σRR and σIP; that is, the overall risk-valuation deviation k is very high. Even a small change in the investment ratio will have a large impact.
The capital released by rational investor arbitrage and by irrationally pessimistic investors may supplement the capital needs of irrational and optimistic investors via lending flows. This will further promote the formation of asset bubbles, thus losing the endogenous ability to return to rational balance (or hedging). Irrational exuberance can form a siphon effect, moving from asset to asset and from market to market. As noted by Shiller (Citation2005, p. 311), irrational exuberance does not disappear; it just reappears in another market. The limits of asset bubbles may depend on the limits of investment (social wealth) and the temptation to focus on relative yields.
2.7. Irrational risk-aggregation effect: Irrational panic
When , the risk of the asset portfolio with three heterogeneous beliefs is equal to zero—that is, the portfolios point on the XY line segment in . Because irrational pessimism will lead investors to reduce risk-asset allocation, even to hold cash, the σIP asset risk is relatively small. Thus, the investment proportion of λC must be large enough to satisfy the equation, which means the risk-asset investment ratio is very low. This may cause a severe bleeding of risky asset demand. The less room there is to reach capital market equilibrium through arbitrage dynamics, the less vitality and liquidity the asset will lose.
2.8. Irrational risk dispersion
The combined point on the line segment of AN in occurs when . This does not necessarily mean the market is homogenously rational or that the state of risk is balanced between irrational optimism and irrational pessimism, which is the critical point where irrational risk is completely dispersed throughout diversified asset portfolios with three heterogeneous beliefs. In this case, the portfolio risk is equal to the equilibrium price of the portfolio under the condition of absolute rationality. In other words, the risk impact of investors’ irrational optimism and irrational pessimism can be reduced to zero through a diversified portfolio. However, the equity premium has historically been much higher than any rational model can explain (Thaler, Citation1999).
3. Conclusion and policy suggestions
3.1. Conclusion
Real investors are not homogenously rational, as assumed by neoclassical finance theory. Thus, asset prices are affected by irrational risks. Heterogeneous beliefs include rational risk, irrational optimism, and irrational pessimism. The irrational risk premium originates from the disturbance of market information, which leads to differences in investors’ expectations. Trading frequency and quantity reflect differences in investors’ rationality. Market data such as the turnover rate and the turnover rate premium can effectively be used as indicators. Irrational risk can be dispersed through a diversified portfolio or aggregated. The higher the proportion of irrational risk investment and the greater the deviation degree of risk valuation, the stronger the irrational risk-aggregation effect.
It should be noted that this study has some limitations. First, this study is based on the assumption of “zero transaction cost.” Since transaction frequency and quantity reflect differences in investors’ rationality, transaction cost is an effective way to control irrational risk. Second, this study is based on the assumption of “investor risk aversion”; but, the degree of risk aversion differs between irrational pessimism and irrational optimism. This study is also based on the assumption of “three-stage investment transaction”; the cycle of heterogeneous belief conversion takes some time to complete, and the time factor is not considered in the model. At the same time, there is a strong correlation between the fuzziness of the rational anchor and irrational risk level, but this study cannot accurately define the rational anchor. Finally, a diversified investment portfolio can generate a premium, but this study cannot accurately define how the premium level reflects the degree of deviation caused by irrational risk.
3.2. Policy suggestions
Irrational risk leads to inefficient markets, and perhaps markets that are inherently flawed. The Buffett Index (total market value of US stocks/US GDP), the “20 Rule” proposed by Peter Lynch, and the 10-year cyclically adjusted price-to-earnings ratio proposed by Shiller are all traditional financial ideas that anchor the capital market with the growth of the real economy. They also comprise the theoretical foundation of traditional financial supervision. Isaac Newton said, “I can calculate the motion of heavenly bodies but not the madness of people.” Defining the rational portfolios of benchmark equilibrium thus becomes the anchor of market stability and establishes the benchmark and direction for preventing the systematic deviation of irrational risk.
Irrational risk originates from differences in investors’ rationality and is affected by the quality and transmission of information, the trading rules of the market, the ability of individual investors to process information, the complex inner psychology of investors, and the behavioral coordination of group investors. The premises of neoclassical finance theory are rational choice and perfect competition. Meanwhile, regulation theory based on behavior analysis can help investors avoid irrational systematic deviation and improve market efficiency. Rational policy designs such as intelligent assignments can nudge people’s decision-making to achieve “twice the result with half the effort” (Thaler & Sunstein, Citation2008).
To avoid deviations caused by irrational risk and the related effects on the market, in addition to prices and price fluctuations, it is also necessary to track trading volume, turnover rate, turnover rate fluctuations, and turnover rate premiums. It is necessary to establish an evaluation and tracking system, an early-warning and resolving mechanism, and a perfect control mechanism. It is also necessary to develop financial tools to suppress irrational risks and cultivate the endogenous power of the market to return to rationality. This is inseparable from the deeper connection of irrational risk, as well as its influencing factors and transmission mechanism.
Differences in rationality reflect the richness of human diversity and are also part of the beauty of the market game. We should not only guide investors’ expectations and cut off the link formed by the systematic deviation of irrational risk but also improve the tolerance of irrational risks. The results are applicable not only to China but also universally. In a broad sense, cognition of irrational risk plays an important role in investment and even in all economic activities.
Acknowledgements
I would like to thank all those who helped me in the process of writing this paper.
First, I thank my students for their inspiration. Their doubts led me to think about how to incorporate irrational risks into the asset pricing model. I would also like to sincerely thank Professor Wang Taosheng and Professor Huang Mengqiao for their guidance and helpful comments on my manuscript. I am grateful for their assistance in helping me to complete this paper.
In addition, I thank the Hunan Provincial Department of Education and Hunan International Economic Risk Prevention and Management Research Base for their financial support (Innovation Platform Open Fund Project: 20K075). I also thank the Wind data terminal (www.wind.com.cn) for its data services, and I thank LetPub (www.letpub.com) for its linguistic assistance and expert pre-submission review.
Finally, I appreciate my family’s consideration and their great confidence in me over the years, especially my daughter Liu Xingyu for her assistance with data collection and processing. I also sincerely thank my friends who helped me to solve the problems I faced in the challenging process of writing this paper.
Disclosure statement
No potential conflict of interest was reported by the author(s).
Additional information
Funding
Notes on contributors

Yaping Liu
Yaping Liu is an associate professor in the Finance Department at Hunan International Economics University. He is mainly engaged in teaching and research on investment economics, behavioral finance and asset pricing, securities investment analysis, and other fields, particularly stock market anomalies. The present article pertains to key topics covered by the Hunan International Economic Risk Prevention and Management Research Base and Investment Research Institute, providing theoretical support for in-depth asset pricing preference, strong empirical justification, irrational risk monitoring, and irrational risk management.
References
- Andrea, F., David, K., & Lasse, H. P. (2018). Buffett’s alpha[J]. Financial Analysts Journal, 74(4), 35–12. https://doi.org/10.2469/faj.v74.n4.3
- Banyen, K. T., & Nkuah, J. K. (2015). Limited stock market participation in ghana: A behavioral explanation[J]. International Journal of Economics & Empirical Research, 3(6), 286305. https://ssrn.com/abstract=2795036
- Banz, R. W. (1981). The Relationship Between Return and Market Value of Common Stocks[J]. Journal of Fractal Economics, 9(1), 3~18. https://doi.org/10.1016/0304-405X(81)90018-0
- Barber, B. M., Odean, T., & Zheng, L. (2008). The behavior of mutual fund investors[M]. In V. Anjan & A. W. A. Thakor (Eds.), Handbook of financial intermediation and banking (pp. 259~283). Elsevier.
- Benkraiem, R., Bouattour, M., Galariotis, E., & Miloudi, A. (2019). Do investors in SMEs herd? Evidence from French and UK equity markets[J]. Small Business Economics, 56(2), 1619~1637. https://doi.org/10.1007/s11187-019-00284-0
- Da, Zhi, Engelberg, D, & Gao, P. (2011). In search of attention [J]. Journal of Finance, 66(5), 1461~1499. https://doi.org/10.1111/j.1540-6261.2011.01679.x
- David, T., & Alireza, Y. (2020). The equity differential factor in currency markets[J]. Financial Analysts Journal, 76(2), 70~81. https://doi.org/10.1080/0015198X.2020.1712924
- De Long, J. B., Shleifer, A., Summers, L. H., & Waldman, R. J. (1990). Noise trader risk in financial markets[J]. Journal of Political Economy, 98(4), 703~738. https://doi.org/10.1086/261703
- Fama, E. F., & French, K. R. (1992). The cross-section of expected stock returns[J]. The Journal of Finance, 47(2), 427~465. https://doi.org/10.1111/j.1540-6261.1992.tb04398.x
- Gary, S. (2016). Overreaction of dow stocks[J]. Cogent Economics & Finance, 4(1), 1251831. https://doi.org/10.1080/23322039.2016.1251831
- Genesove, D., & Mayer, C. (2001). Loss aversion and seller behavior: Evidence from the housing market[J]. The Quarterly Journal of Economics, 116(4), 1233~1260. https://doi.org/10.1162/003355301753265561
- Ghulame, R., Kienpin, T., Perihan, I., & Sonia, A. (2022). Investors’ mood and herd investing: A quantile-on-quantile regression explanation from crypto market[J]. Finance Research Letters, 47(A), 102585. https://doi.org/10.1016/j.frl.2021.102585
- Hirshleifbr, D., Lim, S. S., & Teoh, S. H. (2009). Driven to distraction extraneous events and underreaction to earnings news [J]. The Journal of Finance, 64(5), 2289~2325. https://doi.org/10.1111/j.1540-6261.2009.01501.x
- Jain, J., Walia, N., & Gupta, S. Evaluation of behavioral biases affecting investment decision making of individual equity Investors by buzzy analytic hierarchy process[J]. (2019). Review of Behavioral Finance, 12(3), 297–314. (ahead-of-print). https://doi.org/10.1108/RBF-03-2019-0044
- Jinesh, J., Nidhi, W., Sanjay, G., & Kriti, A. (2021). A fuzzy analytical hierarchy process framework for stock selection in the Indian stock market[J]. Early View, 2(4). https://doi.org/10.1002/VIW.20210003
- Kahneman, D., & Tversky, A. (1979). Prospect theory: An analysis of decision under risk[J]. Econometrica: Journal of the Econometric Society 47(2), 263~291. https://doi.org/10.2307/1914185
- Kashif, M., Palwishah, R., Ahmed, R. R., Veinhardt, J., & Streimikiene, D.(2020). Do investors herd? An examination of Pakistan stock exchange[j]. International Journal of Finance & Economics, 26(1 2090~2105.https://doi.org/10.1002/ijfe.1895
- Markowitz, H. M. (1952). Portfolio selection[J]. Journal of Finance, 7(1), 77~91. https://doi.org/10.1017/S0020268100019831
- Mehra, R. (2008). Handbook of the equity risk premium [M] (pp. 75~76). Elsevier.
- Mehra, R., & Sah, R. (2002). Mood fluctuations, projection bias and volatility of equity prices[J]. Journal of Economic Dynamics & Control, 26(5), 869–887. https://doi.org/10.1016/S0165-1889(01)00035-5
- Mullainathan, S., & Thaler, R. H. (2001). Behavioral economics[J]. International Encyclopedia of the Social & Behavioral Sciences, 76(7948), 1094~1100. http://dx.doi.org/10.1016/B0-08-043076-7/02247-6
- Muskan, S., Ritu, L., Sanjay, G., & Aashish, G. (2021). What make investors herd while investing in The Indian stock market? A hybrid approach[J]. Review of Behavioral Finance. https://doi.org/10.1108/RBF-04-2021-0070
- Muskan, S., Ritu, L., Swati, G., & Sanjay, G. (2022). Influence of contextual factors on investment decision-making: A fuzzy-AHP approach[J]. Journal of Asia Business Studies. https://doi.org/10.1108/JABS-09-2021-0376
- Odean, T. (1999). Do investors trade too much?[J]. Social Science Electronic Publishing, 89(5), 1279~1298. https://doi.org/10.1257/aer.89.5.1279
- Sharpe, W. F. (1964). Capital asset prices: A theory of market equilibrium under conditions of risk[J]. Journal of Finance, 19(3), 425~442. https://doi.org/10.1111/j.1540-6261.1964.tb02865.x
- Shefrin, H., & Statman, M. (1994). Behavioral capital asset pricing theory[J]. The Journal of Financial and Quantitative Analysis, 29(3), 323~349. https://doi.org/10.2307/2331334
- Shiller, R. J. (2005). Irrational exuberance[M] (pp. 311~312). Princeton University Press.
- Siegel, J. J., & Thaler, R. H. (1997). Anomalies: The equity premium puzzle[J]. American Economic Association, 11(1), 191~200. https://doi.org/10.1257/jep.11.1.191
- Simarjeet, S., Nidhi, W., Pradiptarathi, P., & Sanjay, G. (2022). Risk-managed momentum: An evidence from Indian stock market[J]. FIIB Business Review, 11(3), 347~358. https://doi.org/10.1177/23197145211023001
- Simon, H. (2002). Simon anthology [M]. Capital University of Economics and Business Press.
- Sprenger, T. O., Sandner, P. G., Tumasjan, A., & Welpe, I. M. (2014). Tweets and trades: The information content of stock microblogs [J]. European Financial Management, 20(5), 926~957. https://doi.org/10.1111/j.1468-036X.2013.12007.x
- Thaler, R. H. (1999). The end of behavioral finance[J]. Financial Analysts Journal, 55(6), 12~17. https://doi.org/10.2469/faj.v55.n6.2310
- Thaler, R. H., & Sunstein, C. R. (2008). Nudge:ImprovingDecisions about health, wealth, and happiness[M]. Yale University Press.
- Xuan, V., & Dang, B. (2019). Herd behavior and idiosyncratic volatility in a frontier market[J]. Pacific-Basin Finance Journal, 53(2), 321~330. https://doi.org/10.1016/j.pacfin.2018.10.005