
 ?Mathematical formulae have been encoded as MathML and are displayed in this HTML version using MathJax in order to improve their display. Uncheck the box to turn MathJax off. This feature requires Javascript. Click on a formula to zoom.
Abstract
Indonesia ranks sixth globally in terms of wealth distribution inequality. Changes in human capital development may affect labor force efficiency and productivity as well as wages and income inequality levels. This study applies a nonlinear autoregressive distributed lag (NARDL) model to data from 1970 to 2019 to investigate the asymmetric impact of human capital development on income inequality in Indonesia. Our results provide significant evidence of the long-run asymmetric effects of human capital development on income inequality. More specifically, income inequality responded more significantly to increase in human capital development than to reduction. Hence, policymakers should establish inclusive lifelong learning systems that concentrate on skill enhancement, such as re-training and re-skilling, and technical and vocational training (TVET) systems to enhance a country’s human capital development.
1. Introduction
Although issues related to income inequality have been widely discussed in the mainstream media for some time and were included in the United Nations’ 17 Sustainable Development Goals established in 2015, the challenges of closing the income gap between upper- and lower-income groups remain significant, and remedial policies remain ineffective. As of 2021, the richest 10% of the global population receives 52% of the total global income, while the poorest 50% receives only 8.5% (World Economic Forum, Citation2021). It has been discovered that the ongoing COVID-19 pandemic will exacerbate global income inequality and worsen income inequality in emerging and developing economies by 0.3 points in 2020. (World Bank, Citation2022). According to Oxfam’s (Citation2022) report, Indonesia is now the world’s fourth most populous country and sixth most unequal in terms of wealth distribution. Income disparity in Indonesia has grown faster over the last two decades than in any other Southeast Asian country. Furthermore, the four richest men in Indonesia are said to be worth more than the combined wealth of the poorest 100 million people in Indonesia.
Human capital development assumes continuous advancement in knowledge and skill competencies through continuing education, job training, and workshops. Not surprisingly, it is seen as a key factor for income growth, promotion of competitiveness, and higher employment, and is expected to have a curative effect on a nation’s level of income inequality (World Economic Forum, Citation2017). Similarly, Becker (Citation1962) and Rosen (Citation1977) argued from a theoretical standpoint that individuals who advance their skills and competencies would benefit from a nation’s industrialisation. On the other hand, low-skilled workers will suffer or be laid off if they do not advance with the industrial revolution. As a result, human capital development would improve labor force efficiency and productivity, while also serving as a springboard for wage increase. Consequently, this has a direct impact on a country’s income distribution level.
According to the World Bank, Indonesia’s Human Capital Index improved from 0.54 in 2020 to 0.53 in 2018, indicating that an Indonesian worker of the next generation would only be 54% as productive as they would be under the benchmark of complete education and full health. Thus, to accelerate investment in people for greater equity and economic growth in Indonesia, the Indonesian government has undertaken several initiatives to prioritise human capital development. These initiatives include allocating funds for various programs aimed at improving education, health, and social protection in the country (Holmemo, Citation2019). Furthermore, in 2019, Indonesian President Joko Widodo proposed a USD 178 billion budget for 2020 centered on education (The Star,), in addition to the USD 2.7 billion in loans provided by the Asian Development Bank (ADB) to fund the human capital development program (The Jakarta Post, Citation2020).
Although the Indonesian government was an early adopter of the World Human Capital Project, many initiatives to improve human capital development have been implemented over the years (World Bank, Citation2019). A country’s income inequality level (as measured by the Gini index) remains significant. According to World Bank and the Standardised World Income Inequality Database (SWIID) reports, the Gini index remained significant at 46.50 in 2015 before rising to 46.60 in 2016 and 2017, before worsening to 47.40 in 2018 and 2019. However, while the inverse linkages between human capital development and income inequality are well founded, the empirical results have not been unanimous. Altgouhh and Lin (Citation2007), Birchenall (Citation2001), Shahpari and Davoudi (Citation2014), Turnovsky (Citation2011), and Chani et al. (Citation2014) suggest that there is a significant correlation between human capital development and disparities in income distribution. Lee and Lee (Citation2018) argue that educational equality and public policies that improve social benefits are the driving forces behind income inequality. Turnovsky (Citation2011) found that human capital advancement has no impact on growth or income inequality. Chani et al. (Citation2014) found that income inequality was caused by human capital inequality, but not vice versa. Nevertheless, these contrasting empirical studies continue to attract debate and call for further research.
Moreover, most existing literature suggests that the relationship between human capital development and income distribution disparities is symmetrical (Behrman & Knowles, Citation1999; Jolliffe, Citation1998; Kajisa & Palanichamy, Citation2006). However, this study argues that the assumption of symmetrical bonding between human capital development and income inequality is inaccurate. Given that the level of human capital development directly reflects workers’ compensation, an increase in human capital development is expected to boost workers’ wages. However, as argued by the theory of stickiness in wage adjustment (Keynes, Citation1936), downward adjustment in wages caused by a reduction in human capital development may not be possible. In practical terms, any reduction in wages may be prohibited or made impossible by labor unions, labor laws, or even by minimum wage regulations laid down by the country’s labor law/National Wages Consultative Council Act. Hence, the adjustment of wages or income is not necessarily symmetrical to any variation in human capital development. Consequently, it is inaccurate to hypothesise that the impact of human capital development on income distribution is symmetrical. Therefore, a study on the asymmetric integration between human capital development and disparities in income distribution is required.
Despite spending millions of dollars on various initiatives to improve Human Capital Development in Indonesia, income inequality remains significant. As a result, this study aims to see if increasing human capital development reduces income inequality in Indonesia. Furthermore, by investigating the potential asymmetric impact of human capital development on income distribution disparities in Indonesia, this study seeks to fill a gap in the existing literature. More specifically, this study adopts the nonlinear autoregressive distributed lag (NARDL) model proposed by Shin et al. (Citation2014) to highlight potential long-run asymmetries in the income inequality-human capital development nexus. The remainder of this paper is organised as follows. Section 2 presents the study background. Section 3 reviews the literature. Section 4 describes the data and methodology. Section 5 presents the estimation results and robustness checks. Finally, Section 6 presents the conclusion of the study as well as a discussion of the known limitations of this work and policy recommendations for future studies.
2. Background of the study
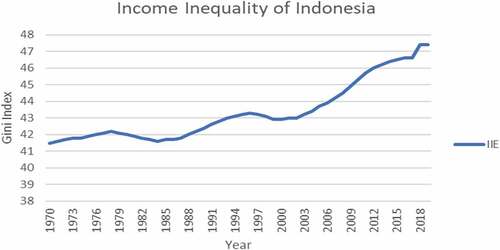
With a total estimated population of 272,832,226 million, of which approximately 67.59% are in the labour force (15 to 64 years of age), income inequality in Indonesia has been on an upward trend since 1970. As highlighted in Figure , income inequality in Indonesia fluctuated from 41.5 to 42.8 from 1970 to 1992 before reaching 43.0 in 1993. The index worsened to 44.2 during the global financial crisis and has remained at 47.4 since 2018. According to the literature, factors attributed to the high-income inequality level in Indonesia include industrialisation and globalisation (Kanbur, Citation2015; Afandi et al., Citation2017), low education level (Chongvilaivan & Kim, Citation2015, Conteras et al., Citation2015), and increasing dominance of the financial sector (Hein & Detzer, Citation2015).
Figure 1. Income inequality in Indonesia—1970-2019.
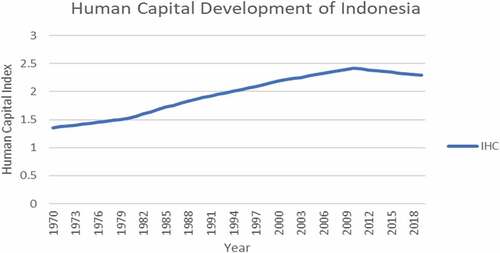
On the other hand, the human capital index of Indonesia, which is based on the years of schooling and the number of populations returning to education, has recorded an upward trend over the years, which could be due to the country’s transformation from physical-based to knowledge-based human capital development (Holmemo, Citation2019). From Figure , it can be seen that the human capital development index has steadily increased since 1970. However, despite the general upward trend in human capital development, the progression was hit by a reverse trend after 2010, when the human capital development index dropped from a peak of 2.4168 index points in 2010 to 2.4021 index points in 2011 and continued to downtrend to 2.2882 in the year 2019. Interestingly, the progressive upward trend in Indonesia’s income inequality coincided with the downward trend in human capital development since 2010, suggesting that changes in human capital development may explain the level of income inequality in Indonesia.
Figure 2. Human capital index of Indonesia—1970-2017.
3. Literature review
The following section highlights previous literature concerning human capital development and income inequality issues.
Liu and Wong (Citation1981) applied the strict human capital model to analyse the impact of Singapore’s human capital development on income distribution based on a survey conducted between June and August 1974. They concluded that rapid economic and educational development resulting in unequal incidences of educational opportunities and obsolescence of older skills acquired at school or on the job may have been factors that contributed to greater inequality. Sehrawat and Singh (Citation2019) employed the nonlinear autoregressive distributed lag approach on Indian data from 1970 to 2016 and concluded that education expansion promoted income distribution parities, and economic growth, inflation, and trade openness discouraged income distribution parities. Lee and Lee (Citation2018), who utilised cross-country data between 1980 and 2015, found that an equal distribution of educational availability contributed significantly to reducing income inequality. Educational expansion was a major factor in reducing educational inequality, and thus, income inequality.
Shahabadi et al. (Citation2018) investigated the effects of income inequality in Islamic countries between the years 1990–2013. They concluded that the upward enrolment rate in primary and secondary schools had a significant curative effect on income inequality and that the enrolment rate in universities worsened income inequality. In contrast, Hwang and Jung (Citation2006), who applied cross-national evidence for 108 countries covering the period from 1947 to 1994, indicated that an upward enrolment rate at the secondary and tertiary levels of education improved income inequality. Chiu (Citation1998) found that a higher level of aggregate human capital accumulated by an initial generation would improve the initial income distribution of all subsequent generations, signifying an overlapping-generations model with heterogeneity in income distribution and human capital.
Utilising dynamic panel estimation techniques on a data range based on five-year intervals from 1980 to 2010, Coady and Dizioli (Citation2018) found that inequality in schooling affects the income inequality level significantly. Specifically, income inequality and the average number of years of schooling for the older cohorts were positively correlated. In contrast, the relationship was inversely correlated with the number of years of schooling of the younger cohorts. Using quantile regression analysis on data ranging from 1966 to 1995 to investigate the impact of schooling level and school dispersion on the income distribution of Taiwan, Chu (Citation2000) concluded that increases in the level of schooling or schooling dispersion and educational equality tended to improve the income distribution of the country. Foldvari and Leeuwen (Citation2011), using two-stage least squares (2SLS) analysis of data from both OECD and non-OECD countries from 1960 to 2000, found that human capital was not a significant determinant of income inequality for non-OECD countries. However, a positive relationship was found in OECD countries.
On the other hand, Rehme (Citation2007) found that the effects of higher education on income inequality could not be explicitly determined, as increases in education first increased and then decreased growth and income inequality when measured by the Gini index. Similarly, Green (Citation2007) concluded that the empirical evidence indicated that human capital policy did not create a good income redistribution policy. Using data from the China Urban Household Survey from 1992 to 2009, Feng and Tang (Citation2019) found that labor market factors and a falling marriage rate increased income inequality. However, changes in human capital level were not associated with income distribution. Similarly, Chani et al. (Citation2014) investigated the causal relationship between human capital and income inequality in Pakistan using time series data from 1973 to 2009 and confirmed that income inequality caused human capital inequality, but that human capital inequality did not cause income inequality.
In conclusion, although the preceding discussions provide some insightful information on the impact of human capital development on income inequality in their respective studies. There is still debate about whether a country’s human capital development can help to reduce income inequality. Furthermore, while existing literature has used a variety of estimation methods to investigate the impact of human capital development (for example, panel data analysis—Coady and Dizioli (Citation2018); quantile regression—Chu (Citation2000); two-stage least squares (2SLS)—Foldvari and Leeuwen (Citation2011)), no study has examined the asymmetric link between income inequality and human capital development. As a result, it is not consistent with Keynes (Citation1936) argument that wage adjustment can be sticky and asymmetric, which we argued would impact income distribution asymmetrically. Hence, this study intends to fill this gap in the literature by exploring the asymmetric impact of human capital development on the income inequality of Indonesia, the most populous nation in the ASEAN region.
4. Data and methodology
4.1. Asymmetric framework
Based on our discussion in the previous sections, we argued that the asymmetric relationship between human capital development and income inequality could be explained through the human capital- wages model (recommended by Tchernis (Citation2010)) and sticky wages model (recommended by Huo and Rios-Rull (Citation2020)). The earlier model explained the connection between human capital and wages, whereas the latter highlighted the stickiness of wage adjustment. As a result of wage stickiness, income adjustment due to human capital development increases and decreases would not be symmetric, resulting in an asymmetrical impact on income inequality.
Tchernis (Citation2010) described an individual’s wage equation as follows:
Where Wit represents an individual’s wages, Eit denotes an individual’s market experience, Tit represents seniority, and Xit is a set of variables that affect current wages. Thus, according to EquationEquation 1(1)
(1) , if an individual improves their skill or educational attainment, Xit is expected to rise, and thus wages will rise. However, Keynes (Citation1936), Heckel et al. (Citation2008), and Huo and Rios-Rull (Citation2020) explained that while human capital development may have a direct impact on an individual’s wage and income, the impact may not be symmetrical due to sticky wages. As a result, the relationship between human capital development, income, and income inequality may be asymmetric. The hypothesis of sticky wages by Huo and Rios-Rull (Citation2020) is as follows:
Where ni is a continuum of differential labour varieties subject to i ∈ [0,1], and the union sets wages (wi), firms accept all wages as determined by the union. Thus, cost minimisation, given wages (wi) and total labour (n), yields demand schedules for each labour variety, i as:
w is the aggregate wage index that subject to which satisfies
Huo and Rios-Rull (Citation2020) also assumed that every representative household consists of a continuum of workers with different labour variety i but enjoys the same consumption level. Thus, the household utility functions are as follows:
To maximise the utility of the agents, the opportunity to reset the wage occurs with probability1—θw. The union’s problem, according to Huo and Rios-Rull (Citation2020), will be:
is subject to
and the first order condition of EquationEquation (4)(4)
(4) is as follows:
Huo and Rios-Rull (Citation2020) asserted that because wages are sticky, EquationEquation (7)(7)
(7) may imply an optimal supply of labour where
hus violating the labour supply constraint. As a result of the preceding, we argued that the impact of human capital development on inequality would be asymmetric.
4.2. The model
Additionally, from the existing literature, the consumer price index (CPI), the real gross domestic product per capita (RGDPC), employment, trade openness, and urbanisation are often linked to the level of income and income distribution (Li & Zou, Citation2002; Mah, Citation2013; Siami-Namini & Hudson, Citation2019). Hence, the rate of inflation, real GDP per capita, employment, trade openness, and urbanisation are included as control variables in the following base model. As a result, the following is the basic model used to investigate the impact of human capital development on income inequality in Indonesia:
where IE stands for income inequality, HC stands for human capital, CPI stands for consumer price index, RGDPC stands for real GDP per capita, EMP stands for employment, and TO and UBR stand for trade openness and urbanisation rate, respectively. Equation (9) depicts the ARDL bounds cointegration test model.
where IE represents income inequality, HC is the human capital index, CPI refers to the consumer price index, RGDPC represents the real GDP per capita, EMP represents the number of people employed, and TO and UBR represent the level of trade openness and urbanisation rate, respectively. The ARDL bound cointegration test model is shown in Equation (9).
The empirical model is based on the asymmetric cointegration approach proposed by Shin et al. (Citation2014). This method employs the nonlinear autoregressive distributed lag cointegration (NARDL) approach to capture both long- and short-run asymmetries between human capital development and income inequality, in which the human capital development (HC) variable is decomposed into two partial sum processes that accumulate in positive and negative changes. The asymmetric long-run equation is as follows:
where IE is the variable for income inequality; HC is the variable for human capital development; o,
1,
2,
are the vectors of the long-run parameters to be estimated.
on the other hand, are the partial sums of the positive and negative changes in the HC variable.
and
According to the above formulation, the long-run relationships between income inequality (IE) and human capital development (HC) are and
, respectively where
captures the long-run relationship between income inequality and increases in human capital development and
captures the long-run relationship between income inequality and decreases in human capital development. By default, Equation (12) indicates that the current value of the human capital development (HCt) variable is given by the sum of its initial value (HC0) and partial sums of positive and negative
.
The empirical long-run Equation (8) in the autoregressive distributed lag (ARDL) model proposed by Shin et al. (Citation2014) is as follows:
All variables were defined as previously described, with the addition of the lag orders p, q, r, s, w, y, and z. The long-run parameters in Equation (8) were calculated using Equation (13), namely, and
. Furthermore,
measured the short-run impact of human capital development (HC) increase in income inequality (IE), whereas
measured the short-run impact of human capital development (HC) decrease in income inequality (IE).
The following steps were used to implement the nonlinear ARDL (NARDL) analysis. First, the NARDL model, like the ARDL error-correction model developed by Pesaran et al. (Citation2001), does not allow I(2) variables. The presence of the I(2) variables invalidates the computed F-statistics for the cointegration test. As a result, the Augmented Dickey-Fuller (ADF) and Philips-Perron (PP) unit root tests were performed to ensure that all variables were either I(0) or I(1) (1). The Kwiatkowski–Phillips–Schmidt–Shin (KPSS) test was used to validate the results of the ADF and PP unit root tests. Second, the nonlinear error correction model was run under the NARDL model using a two-step least-squares estimation to obtain the optimum lags of the NARDL model. Fourth, the bounds-testing approach proposed by Pesaran et al. (Citation2001) and Shin et al. (Citation2014) was used to identify the presence of cointegrating variables under the NARDL model.
The implementation of nonlinear ARDL (NARDL) analysis involves the following steps. First, similarly to the ARDL error correction model, by Pesaran et al. (Citation2001), the NARDL model does not allow I(2) variables. The presence of the I(2) variables invalidates the computed F-statistics for the cointegration test. Hence, Augmented Dickey-Fuller (ADF) and Phillips–Perron (PP) unit root tests were carried out to confirm that all variables were either I(0) or I(1). The Kwiatkowski–Phillips–Schmidt–Shin (KPSS) test was also included to confirm the findings obtained from the ADF and PP unit root tests. Second, Equation (14) was estimated using the standard ordinary least squares (OLS) estimation method. Third, the nonlinear error correction model was run under the NARDL model using a two-step least-squares estimation to obtain the optimum lags for the NARDL model. Third, the bounds-testing approach proposed by Pesaran et al. (Citation2001) and Shin et al. (Citation2014) was used to identify the presence of cointegrating variables under the NARDL model. Following this, we used the Wald test with the restriction to look for asymmetry in the long-run impact of human capital development on income inequality in Indonesia. Finally, we proxy the human capital development variable with life expectancy to test the robustness of the estimation.
4.3. The data
This study focused on Indonesia because it is the world’s fourth most populous country, with approximately 273 million people. Furthermore, despite numerous initiatives and millions of dollars spent to improve human capital, its income inequality level remains the highest in the ASEAN region.
Gini indexes were used to reflect income inequality (IE) levels, and the data were obtained from the Standardised World Income Inequality Database (SWIID). The human capital index (HC), which is based on the average number of years of schooling, the assumed rate of return to education, and the data for employment (EMP) refers to the number of people employed (in millions) and was obtained from the Penn World Table. The remaining datasets were obtained from the World Bank Indicators (WDI), which included the consumer price index (CPI) and urbanisation rate (UBR), which refers to the number of people living in urban areas as defined by national statistical offices. Trade openness (TO), the sum of total exports and imports of goods and services measured as a share of the gross domestic product, and the real gross domestic product per capita (RGDPC) were also obtained from the WDI. Table presents descriptive statistics of the datasets. The standard deviations of all variables were high, indicating that all variables had high variation.
Table 1. Summary statistics
5. Empirical results
The Augmented Dickey-Fuller (ADF) and Phillips-Perron (PP) tests were used to ensure that the underlying variables were stationary. Simultaneously, the Kwiatkowski–Phillips–Schmidt–Shin (KPSS) test was used to validate the ADF and PP unit root test results. All the variables were stationary at either I (0) or I (1). The ADF and PP tests examine the null hypothesis of a unit root, whereas the KPSS test examines the null hypothesis of stationarity relative to the alternative hypothesis of a unit root. The test results are presented in Table . With no I(2) variables detected, the study proceeded with the NARDL model estimation, as suggested by Pesaran et al. (Citation2001).
Table 2. ADF and PP unit root test results
To arrive at the model’s final specification, the cointegration test on the human capital development-income inequality nexus equation was performed by regressing EquationEquation (5)(5)
(5) with the OLS estimation method and the nonlinear error correction model (ECM) under the setting of the NARDL model using the two-step least squares method. The maximum number of lags considered in this study was three, because of the small number of observations. The existence of long-run cointegration in the NARDL framework can be tested using bounds testing F-statistics, as proposed by Shin et al. (Citation2014), and compared with the critical values provided by Pesaran et al. (Citation2001), if the number of observations is greater than 100. By contrast, small sample sizes (100 observations) can be compared to Narayan’s critical value (Narayan, Citation2005). Cointegration is present if the calculated F-statistics are greater than the upper-bound critical value. The F-statistics reported in Table are highly significant, thus rejecting the null hypothesis of non-cointegration. In addition, the Breusch-Godfrey serial correlation LM statistics for autocorrelation up to order three were included to validate the model’s specification. The findings revealed no serial correlation.
Table 3. Cointegration tests (human capital index as the proxy for human capital development)
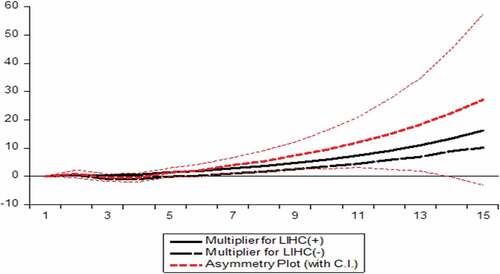
In addition, the long-run asymmetry of positive and negative changes in human capital development was investigated. The obtained p-value was less than 0.05, indicating asymmetry in the long-run impact of human capital development and income inequality. The NARDL Multiplier Graph also revealed the asymmetric long-run impact of human capital development (see, Figure ). As shown in Figure , the asymmetry multiplier plot was in the positive zone of the multiplier graph, indicating that increased human capital development had a greater impact on income inequality than decreased human capital development.
Figure 3. NARDL multiplier graph.
5.1. Long-run estimates and short-run dynamics
Panel I of Table displays the long-run coefficients derived from EquationEquation (5)(5)
(5) estimation. Several key points are worth emphasising. First, increases in human capital were found to be inversely related to the level of income inequality in Indonesia over time, implying that any improvement in human capital development would help reduce income inequality in Indonesia. A decrease in human capital development, on the other hand, was positively associated with the level of income inequality in Indonesia, implying that a decrease in human capital development would worsen the level of income inequality in Indonesia in the long run. Second, inflation, trade openness, and real GDP per capita were positively associated with Indonesia’s level of income inequality. This suggests that the increase in inflation, trade openness, and income per capita of the country would worsen income inequality in Indonesia in the long run. This finding is not surprising given that high inflation tends to exacerbate inequality or poverty by making it more difficult for poorer or middle-income households to save and invest than for wealthy households (Gill & Nagle, Citation2022). Kremer and Maskin (Citation2003) claimed that increased trade tends to benefit elites in both rich and emerging countries, increasing income disparities. However, despite two decades of economic growth in Indonesia, only the richest 20 per cent benefited (World Bank, Citation2015). On the other hand, urbanisation was found to be negatively associated with income inequality, implying that urbanisation could help reduce income inequality in Indonesia. This finding is not surprising given that, compared to other areas of Indonesia, major cities, such as Jakarta and Denpasar, are the primary contributors to Indonesian GDP (Paulhypepage. Co, Citation2022). Lastly, employment level failed to explain income inequality in Indonesia in the long run.
Table 4. NARDL estimates of the impact of human capital development on income inequality
Consistent with the long-run results, the short-run coefficients reported in Panel II of Table indicate that increases in human capital development would promote income distribution parities, whereas decreases in human capital development would worsen the country’s income inequality. Similarly, real GDP per capita, urbanisation, and trade openness were found to have a significant positive impact on income inequality. Thus, rising real GDP per capita, urbanisation, and trade openness were expected to worsen Indonesia’s income distribution in the short run. By contrast, inflation and employment were found to be ineffective in explaining Indonesia’s income inequality level in the short run.
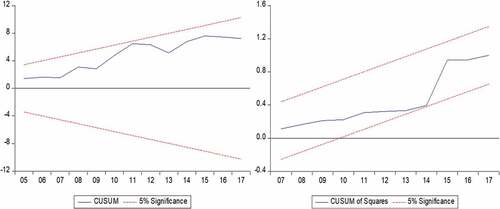
Overall, our findings show that human capital development is an effective tool for reducing income distribution disparities in Indonesia, in both the short and long run. In contrast, inflation, real GDP per capita, and trade openness worsen income inequality. However, while urbanisation has been shown to reduce income inequality in the long run, it is expected to worsen income inequality in the short run. Finally, this study discovered an asymmetry in the relationship between human capital development and income inequality. In particular, an increase in human capital development tends to improve the level of income inequality in the long run with a larger deviation, whereas a decrease in human capital development tends to impact Indonesia’s income inequality with a larger deviation in the short run. Figure shows the CUSUM and CUSUM Squares diagrams for testing the structural stability of the nominal term model. The results showed that the test statistics were within a 5% confidence interval, implying structural stability.
Figure 4. Cusum and cusum squares diagrams.
5.2. Discussion and robustness check
This section discusses the main implications of the findings, followed by a robustness test, in which the proxy for human capital development is replaced with life expectancy.
Table summarises the results. In line with the findings of Moyo et al. (Citation2022); Ali and Cantner (Citation2020), Chu (Citation2000), and Coady and Dizioli (Citation2018), human capital development and income inequality were found to be significantly cointegrated, implying that it plays an important role in determining Indonesia’s income inequality. Furthermore, according to the long-run asymmetry coefficients reported in Table , a percentage point increase in human capital development tends to decrease the level of income inequality in Indonesia by 5.6550 percentage points, whereas a decrease leads to a 2.6253 percentage point increase in income inequality. This suggests that, contrary to the findings of Jolliffe (Citation1998), Behrman and Knowles (Citation1999), and Kajisa and Palanichamy (Citation2006), Indonesia’s income inequality level was more sensitive to increases in human capital development than decreases in the long run.
In contrast, inflation, real GDP per capita, and trade openness exacerbate income inequality in Indonesia. Our findings, too, were consistent with Ucal et al. (Citation2016)’s finding that real FDP per capital is an important indicator of income inequality. This indicates that policymakers should prevent general price increases and ensure that trade benefits and a higher GDP are distributed evenly among Indonesians. According to the World Health Organization (Citation2001) and Matteo and Sunde (Citation2005), rising life expectancy tends to increase educational attainment and promote human capital development. Therefore, we use the longevity factor as a proxy for human capital development to investigate its impact on income inequality in Indonesia to test the robustness of our findings. As postulated by the World Health Organization (Citation2001), life expectancy is the fundamental goal of economic development decisions, and increases in life expectancy tend to enhance educational attainment, thereby promoting human capital development (Matteo & Sunde, Citation2005).
Thus, to examine the robustness of our analysis, the longevity factor was utilised as a proxy for human capital development to investigate its impact on income inequality in Indonesia. Consistent with previous findings (as highlighted in ), the model was found to be significantly cointegrated with income inequality in the long run, and the life expectancy variable was inversely correlated with income inequality (as shown in ), implying that human capital development is critical for income distribution parities. In contrast, inflation, trade openness, and urbanisation are found to worsen Indonesia’s income inequality level, whereas real GDP per capita and employment play no significant role in influencing Indonesia’s income inequality level.
Table 5. Cointegration tests (life expectancy as the proxy for human capital development)
Table 6. ARDL estimates of the impact of human capital development on income inequality (life expectancy as a proxy for human capital development)
6. Conclusion
Human capital development is viewed as a means of increasing wages because it improves labor force efficiency and productivity. However, owing to wage stickiness, a downward adjustment in wages caused by a reduction in human capital development may be impossible (Keynes, Citation1936). Consequently, we argue that human capital development has an asymmetric impact on a country’s income distribution level. Recognising that Indonesia had 131.171 million citizens in the labor force (the highest in ASEAN) in 2019 (Feenstra et al., Citation2015), changes in labor laws and education policy can shape the nation’s human capital development and income distribution asymmetrically. Hence, the NARDL model proposed by Shin et al. (Citation2014) was used to capture the asymmetric cointegration between human capital development and the level of income inequality in Indonesia.
This study contributes to the existing literature in three important ways. First, given that human capital development may have an asymmetric impact on income inequality, the nonlinear autoregressive distributed lag (NARDL) model proposed by Shin et al. (Citation2014) is utilised to highlight potential long-run asymmetries in the income inequality-human capital development nexus. Second, the importance of human capital development in mediating the level of income inequality in Indonesia may prompt policymakers throughout the region to increase their annual budget for human capital development even further. Third, the effectiveness of human capital development in reducing income inequality in Indonesia may prompt policymakers to strengthen existing human capital development programs to keep up with technological advancements.
Our findings confirm the long-run asymmetric effects of human capital development on income inequality in Indonesia thus is in parallel with Ucal et al. (Citation2016) findings that . In particular, an increase in human capital development tends to improve the level of income inequality in the long run with a larger deviation, whereas a decrease in human capital development tends to impact Indonesia’s income inequality in the short run with a larger deviation. Consequently, human capital development appears to be an effective tool for influencing Indonesia’s level of income inequality. Furthermore, inflation, real GDP per capita, and trade openness exacerbate income inequality in Indonesia. Our findings support Adhi’s (Citation2015) claim that rich elites and foreign corporations control the majority of the Indonesian economy, thereby worsening income inequality in the country.
According to our findings, increased human capital development reduces income inequality in Indonesia. Similarly, the United Nations (Citation2013) report highlighted that social programs implemented by several Latin American countries targeting human capital development through education and health services, cash transfers, and labor market reforms have played a significant role in reducing regional income inequalities. Therefore, to improve human capital development, Indonesian policymakers should establish inclusive lifelong learning systems that focus on skill enhancement, such as re-training and re-skilling and technical and vocational training (TVET). Second, with inflation expected to worsen Indonesia’s income inequality, policymakers should consider implementing a cash transfer program, such as food vouchers, to assist vulnerable groups.
Furthermore, policymakers should ensure that adequate infrastructure and employment opportunities are available in cities to allow those struggling in the suburbs to relocate to cities eventually. Finally, a more effective progressive tax system should be implemented to tax top income earners to close the current income gap between the rich and the poor. This study has only scratched the surface of Indonesia’s complex human capital development and income inequality issues. More research into the demographics of human capital in Indonesia is needed to allow policymakers to tailor policies to specific groups, whether they are high-, middle-, or low-income.
Finally, while this study contributed to the literature by demonstrating that human capital development is asymmetrically related to income inequality, our findings must be viewed in light of some limitations. First, because this study relied on secondary data, it may be overly generalised and may have overlooked Indonesia’s within-region income inequality level. Second, because this study only applied to Indonesia, it provides no evidence that the asymmetrical cointegration between human capital development and income inequality applies to other countries. As a result, future studies should consider broadening their scope to include both within-country and between-country research.
Disclosure statement
No potential conflict of interest was reported by the author(s).
Additional information
Funding
References
- Adhi, A. (2015). 80 Persen Industri Indonesia Disebut Dikuasai Swasta. SURYA.co.id. https://surabaya.tribunnews.com/2015/03/03/80-persen-industri-indonesia-disebut-dikuasai-swasta
- Afandi, A., Rantung, V. P., & Marashdeh, H. (2017). Determinants of income inequality. Economic Journal of Emerging Markets, 9(2), 159–17. https://doi.org/10.20885/ejem.vol9.iss2.art5
- Ali, M., & Cantner, U. (2020). Economic diversification and human development in Europe. Eurasian EconomicReview, 10(2), 211–235. https://doi.org/10.1007/s40822-020-00147-0
- Becker, G. S. (1962). Investment in human capital: A theoretical analysis. Journal of Political Economy, 70(5), 9–49. https://doi.org/10.1086/258724
- Behrman, J., & Knowles, J. (1999). Household income and child schooling in Vietnam. The World Bank Economic Review, 13(2), 211–256. https://doi.org/10.1093/wber/13.2.211
- Birchenall, J. A. (2001). Income distribution, human capital and economic growth in Colombia. Journal of Development Economics, 66(1), 271–287. https://doi.org/10.1016/S0304-3878(01)00162-6
- Chani, M. I., Jan, S. A., Pervaiz, Z., & Chaudhary, A. R. (2014). Human capital inequality and income inequality: Testing for causality. Qual Quant, 48, 149–156. https://doi.org/10.1007/s11135-012-9755-7
- Chiu, W. (1998). Income inequality, human capital accumulation and economic performance. The Economic Journal, 108(446), 44–59. https://doi.org/10.1111/1468-0297.00272
- Chongvilaivan, A. & Kim, J. (2015). Individual Income Inequality and Its Drivers in Indonesia: A Theil Decomposition Reassessment. Social Indicators Research, 126 (1). https://doi.org/10.1007/s11205-015-0890-0
- Chu, H. Y. (2000). The impacts of educational expansion and schooling inequality on income distribution. Quarterly Journal of Business and Economics, 39(2), 39–49. http://www.jstor.org/stable/40473289
- Coady, D., & Dizioli, A. (2018). Income inequality and education revisited: Persistence, endogeneity and heterogeneity. Applied Economics, 50(25), 2747–2761. https://doi.org/10.1080/00036846.2017.1406659
- Contreras, D., Rodriguez, J., & Urzua, S.(2019). The return to private education: Evidence from school-to-work transitions. Working Papers, University of Chile, Department of Economics, https://EconPapers.repec.org/RePEc:udc:wpaper:wp479
- Feenstra, R. C., Robert, I., & Marcel, P. T. (2015). The next generation of the Penn world table. American Economic Review, 105 (10), 3150–3182. available for download at. www.ggdc.net/pwt10.1257/aer.20130954.
- Feng, S., & Tang, G. (2019). Accounting for urban China’s rising income inequality: The roles of labor market, human capital, and marriage market factors. Economic Inquiry, 57(2), 997–1015. http://dx.doi.org/10.1111/ecin.12748
- Foldvari, P., & Leeuwen, B. V. (2011). Should less inequality in education lead to a more equal income distribution? Education Economics, 19(5), 537–554. https://doi.org/10.1080/09645292.2010.488472
- Gill, I., & Nagle, P. (2022). Inflation could wreak vengeance on the world’s poor. https://www.brookings.edu/blog/future-development/2022/03/18/inflation-could-wreak-vengeance-on-the-worlds-poor/#:~:text=High%20inflation%2C%20in%20short%2C%20tends,into%20it%20by%20rising%20inflation
- Green, D. A. (2007). A cautionary discussion about relying on human capital policy to meet redistributive goals. Canadian Public Policy, University of Toronto Press, 33(4), 397–418. https://doi.org/10.3138/cpp.33.4.397
- Heckel, T., Bihan, H. L., & Montornes, J. (2008). Sticky wages: Evidence from quarterly microeconomic data. Working paper series 893. European Central Bank.
- Hein, E & Detzer, D. (2015). Finance-dominated capitalism and income distribution: A Kaleckian perspective on the case of Germany. Italian Economic Journal, 1, 171–191. https://doi.org/10.1007/s40797-014-0001-4
- Holmemo, C. (2019). Human capital development is key to Indonesia’s future. https://blogs.worldbank.org/eastasiapacific/human-capital-development-key-indonesias-future
- Huo, Z., & Rios-Rull, J. V. (2020). Sticky wage models and labor supply constraints. American Economic Journal: Macroeconomics, American Economic Association, 12(3), 284–318. https://doi.org/10.1257/mac.20180290
- Huo, Z., & Rios-Rull, J. V. (2020). Sticky wage models and labor supply constraints. American Economic Journal: Macroeconomics, American Economic Association, 12(3), 284–318. https://doi.org/10.1257/mac.20180290
- Hwang, J., & Jung, K. O. (2006). A cross-country study on income distribution and school enrolment. Applied Economics Letters, 13(11), 723–726. https://doi.org/10.1080/13504850500402013
- The Jakarta Post. (2020). ADB to provide Indonesia with $2.7b in loans to support human capital, infrastructure development. 3rd March 2020. https://www.thejakartapost.com/news/2020/03/03/adb-to-provide-indonesia-with-2-7b-in-loans-to-support-human-capital-infrastructure-development.html
- Jolliffe, D. (1998). Skills, Schooling, and Household Income in Ghana. World Bank Economic Review, 12(1), 81–104. https://doi.org/10.1093/wber/12.1.81
- Kajisa, K., & Palanichamy, N. (2006). Income dynamics in Tamil Nadu, India from 1971 to 2003: Changing roles of land and human capital. Agricultural Economics, 35(s3), 437–448. https://doi.org/10.1111/j.1574-0862.2006.00189.x
- Kanbur, R. (2015). Globalization and inequality. Handbook of Income Distribution, Elsevier (2), 1845–1881. https://doi.org/10.1016/B978-0-444-59429-7.00021-2
- Keynes, J. W. (1936). The general theory of employment, interest and money. Palgrave Macmillan.
- Kremer, M., & Maskin, E. (2003). Globalisation and Inequality. Department of Economics, Harvard University; The Brookings Institution; NBER.
- Lee, J. W., & Lee, H. (2018). Human capital and income inequality. Journal of the Asia Pacific Economy, 23(4), 554–583. https://doi.org/10.1080/13547860.2018.1515002
- Lin, C. H. A. (2007). Education expansion, educational inequality, and income inequality: Evidence from Taiwan. Social Indicators Research, 80(3), 601–615. https://doi.org/10.1007/s11205-006-0009-8
- Liu, P. W., & Wong, Y. C. (1981). Human capital and inequality in Singapore. Economic Development and Cultural Change, 29(2), 275–293. http://dx.doi.org/10.1086/451247
- Li, H., & Zou, H. F. (2002). Inflation, growth and income distribution. A cross country study. Annals of Economics and Finance, 2(1), 85–101. https://EconPapers.repec.org/RePEc:cuf:journl:y:2002:v:3:i:1:p:85-101
- Mah, J. S. (2013). Globalisation, decentralisation and income inequality. The case of China. Economic Modelling, 31, 653–658. https://doi.org/10.1016/j.econmod.2012.09.054
- Matteo, C., & Sunde, U. (2005). Human capital formation, life expectancy, and the process of development. American Economic Review, 95(5), 1653–1672. https://doi.org/10.1257/000282805775014380
- Moyo, C., Mishi, S. & Ncwadi, R. (2022) Human capital development, poverty and income inequality in the Eastern Cape province, Development Studies Research, 9:1, 36–47. https://doi.org/10.1080/21665095.2022.2032236
- Narayan, P. K. (2005). The saving and investment nexus for China: Evidence from cointegration tests. Applied Economics, 37(17), 1979–1990. https://doi.org/10.1080/00036840500278103
- Oxfam (2022). Inequality in Indonesia: millions kept in poverty. https://www.oxfam.org/en/inequality-indonesia-millions-kept-poverty
- Paulhypepage. Co. (2022). Regional differences in Indonesia’s Job market. https://www.paulhypepage.co.id/regional-differences-in-indonesias-job-market
- Pesaran, M. H., Shin, Y., & Smith, R. J. (2001). Bounds testing approaches to the analysis of level relationships. Journal of Applied Econometrics, 16(3), 289–326. https://doi.org/10.1002/jae.616
- Rehme, G. (2007). Education, economic growth and measured income inequality. Economica, 74(295), 493–514. https://doi.org/10.1111/j.1468-0335.2006.00555.x
- Rosen, S. (1977). Human Capital: A Survey of Empirical Research. Research in Labor Economics,76 (2), 3–39. https://www.econbiz.de/Record/human-capital-a-survey-of-empirical-research-rosen-sherwin/10002752827
- Sehrawat, M., & Singh, S. K. (2019). Human capital and income inequality in India: Is there a nonlinear and asymmetric relationship? Applied Economics, 51(39), 4325–4336. https://doi.org/10.1080/00036846.2019.1591605
- Shahabadi, A., Nemati, M., & Hosseinidoust, S. E. (2018). The effect of education on income inequality in selected Islamic countries. International Journal of Asia Pacific Studies, 14(2), 61–78. https://doi.org/10.21315/ijaps2018.14.2.3
- Shahpari, G., & Davoudi, P. (2014). Studying effects of human capital on income inequality in Iran. Procedia - Social and Behavioral Sciences, 109, 1386–1389. https://doi.org/10.1016/j.sbspro.2013.12.641
- Shin, Y., Yu, B., & Greenwood-Nimmo, M. (2014). Modelling asymmetric cointegration and dynamic multipliers in a nonlinear ARDL framework. In R. Sickles & W. Horrace (Eds.), Festschrift in honor of Peter schmidt (pp. 281–314). Springer. https://doi.org/10.1007/978-1-4899-8008-3_9
- Siami-Namini, S., & Hudson, D. (2019). Inflation and income inequality in developed and developing countries. Journal of Economic Studies, 46(3), 611–632. https://doi.org/10.1108/JES-02-2018-0045
- Star, T. (2019, August 16). Indonesia president proposes US$178b budget for 2020 with focus on education. Accessed 10th January 2019. https://www.thestar.com.my/business/business-news/2019/08/16/indonesia-president-proposes-us178b-budget-for-2020-with-focus-on-education
- Tchernis, R. (2010). Measuring human capital and its effects on wage growth. Journal of Economic Surveys, 24(2), 362–387. https://doi.org/10.1111/j.1467-6419.2009.00617.x
- Turnovsky, S. (2011). The accumulation of human capital and income inequality in a two-sector economy. Journal of Human Capital, 5(4), 418–452. https://doi.org/10.1086/663169
- Ucal, M., Haug, A. A., & Bilgin, M. H. (2016). Income inequality and FDI: Evidence with Turkish data. Applied Economics, 48(11), 1030–1045. https://doi.org/10.1080/00036846.2015.1093081
- United Nations (2013). UN Capital Development Fund (UNDCF) Workshop. https://www.un.org/en/desa/un-capital-development-fund-undcf-workshop
- World Bank (2015). Indonesia’s rising divide. Washington DC. https://www.worldbank.org/en/news/feature/2015/12/08/indonesia-rising-divide
- World Bank (2019). Indonesia Human Capital Knowledge Series. Washington DC. https://www.worldbank.org/en/country/indonesia/brief/indonesia-human-capital
- World Bank (2022). Global income inequality and the COVID-19 pandemic in three charts. Washinton DC. Available at: https://blogs.worldbank.org/developmenttalk/global-income-inequality-and-covid-19-pandemic-three-charts
- World Economic Forum (2017). The Global Human Capital Report 2017.
- World Economic Forum. (2021). These charts show the growing income inequality between the world's richest and poorest.
- World Health Organization (2001): Macroeconomics and health: Investing in health for economic development, Report of the Commission on Macroeconomics and Health.
