
 ?Mathematical formulae have been encoded as MathML and are displayed in this HTML version using MathJax in order to improve their display. Uncheck the box to turn MathJax off. This feature requires Javascript. Click on a formula to zoom.
Abstract
The youthful population of South Asia, holding the majority in the subregion, will also have a great share in the future alongside the risk of being not in education, employment, or training with a persisting gender gap. This makes it important to adopt a gender-responsive policy framework for youth empowerment. This paper, after constructing a multidimensional financial inclusion index, based on a multilevel estimation framework considering the hierarchical structure of the dataset, shows evidence on how to increase financial inclusion among the South Asian youth. It furthermore provides policy recommendations considering the gendered effects. The paper finds that education level, formal employment, having a national ID, and government expenditure on education and health are important drivers of financial inclusion. The paper furthermore finds that education level becomes especially more important for those at the bottom income quintile and that government expenditure into education and health would boost the youth financial inclusion in South Asia, especially for the female youth.
Public interest statement
Financial inclusion that may be defined as the formal use of financial services has development benefits especially for developing economies. This paper shows evidence on how education level, formal employment, having a national ID, and government spending on education and health can enhance youth and women’s financial inclusion in South Asia. Policy recommendations drawn based on the findings in the paper could be of interest to policymakers as well as to the general public in the sub-region. Moreover, developing economies in other regions may also learn from the findings pointed out in the paper.
1. Introduction
The 2030 Agenda for Sustainable Development (United Nations, Citation2015) highlights the need to promote decent job and entrepreneurial opportunities especially for the youth and women. More specifically, promoting development-oriented policies that support productive activities, decent job creation, entrepreneurship, creativity and innovation, and encourage the formalization and growth of micro-, small-, and medium-sized enterprises, including through access to financial services as per Target 8.3; achieving full an productive employment and decent work for all women and men, including for young people and persons with disabilities, and equal pay for equal work as per Target 8.5; substantially reducing the proportion of youth not in employment, education, or training as per Target 8.6; and developing and operationalizing a global strategy for youth employment and implementing the Global Jobs Pact of the International Labour Organization as per Target 8.5 are part of the SDG 8 (International Labour Organization (ILO), Citation2015).
Financial inclusion which may be defined as the formal use of financial services may improve individuals’ welfare and advance economic development (Allen et al., Citation2012). Lack of access to formal financial services is often seen as a barrier against entrepreneurship by restricting economic opportunities for women, youth, and especially for the female youth (United Nations Development Programme (UNDP), Citation2021). Financial exclusion is wider for women than men and gender inequality in financial inclusion persists particularly for developing countries regardless of education level and income (The Global 2017 Findex Database and Author’s calculations). This has further implications on female labour force participation and women’s empowerment.
A gender-responsive global strategy for the youth empowerment would then need to address the legal and regulatory framework which facilitates the low-cost and efficient ways of access to finance, therefore the empowerment of the youth and women, given the weight of youth population in South Asia. More importantly, youth, defined as persons between the ages of 15 and 24 years (United Nations, Citation1981) had a significant share of the population in South Asian countries with almost one-fifth of the population is within this age group by 2017 (United Nations, Department of Economic and Social Affairs, Population Division, Citation2019 and Author’s calculations).
The United Nations Economic and Social Commission for Asia and the Pacific (ESCAP, Citation2018) points out that providing financial inclusion, along with universal social production strategies, would accelerate poverty reduction and reduce inequality. Innovations including branchless banking and mobile-based financial services would enhance financial inclusion in addition to expanding micro-finance programmes. A much more inclusive approach mainstreaming gender-responsive policies, such as incentivized credit schemes, would promote gender equality and women’s entrepreneurship (ESCAP, Citation2018).
Hence, the current study is motivated by persisting gender gap in financial inclusion in South Asia as well as the weight of the youth population within the total population of the subregion. It adds up to the existing literature by using a hierarchical framework while examining the macro and micro level determinants of youth financial inclusion in South Asia. Furthermore, it focuses on youth in the working age instead of whole youth sample. This paper, aiming at addressing how the youth and women in South Asia can be financially included, tries to find the micro and macro determinants of the financial inclusion of the population of interest. Findings for this subregion may also shed light for the regions or subregions with developing economies since financial inclusion may provide development benefits. The first section overviews the situation of the young population in South Asia with respect to education, employment, and training as well as gender inequality, and it gives the stylized facts on financial inclusion of the South Asian youth based on the latest Global Findex Database. The second section summarises the main literature on financial inclusion and its development benefits. The third section explains the methodology behind the construction of world-wide and South-Asia-specific composite indices of financial inclusion and the hierarchical model to provide empirical evidence on drivers of the financial inclusion of the South Asian youth focusing on 18–24 age category and presents the results. Finally, the last section provides policy recommendations on how to enhance the financial inclusion of the South Asian youth, especially the female youth, and it concludes.
2. Financial inclusion in South Asia
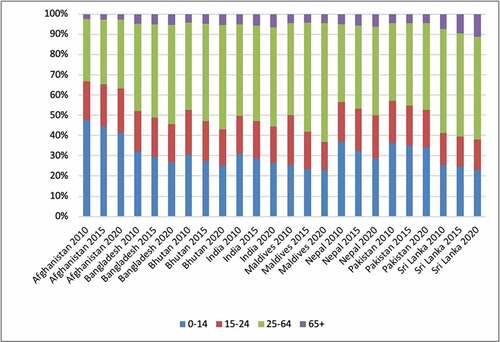
South Asia has a youthful population with almost half of the population below 25 years old and one-third of population of the subregion below 15 years old. By 2015, 0–14 age group accounted for 27.5% and 15–24 age group accounted 18.1% of the population in the subregion (). These age groups are expected to account for 24.3% and 16.4%percent, respectively, in 2030 (United Nations, Department of Economic and Social Affairs, Population Division, Citation2019 and Author’s calculations).
Figure 1. Population breakdown in South Asia
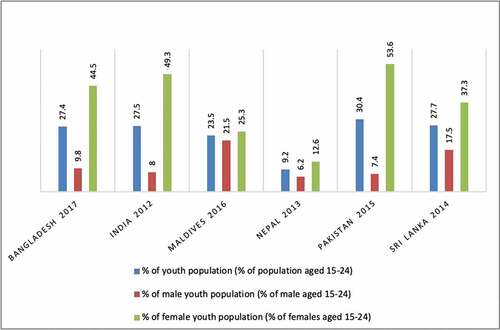
Given the weight of its youth population, empowering the youth is crucial to enhance sustainable economic growth in the subregion. Empowering the youth is strongly associated with providing equal access to affordable and quality education, equipping them with relevant skills in line with the labour market needs, and providing them low-cost and efficient ways of financial access in order them to access to decent work. According the most recent data, youth in NEET (Not in Education, Employment, or Training) is remarkably high () being higher than 20% in Bangladesh, India, Pakistan, and Sri Lanka (ESCAP Database, Citation2019).Footnote1 Empowering the youth to innovate in line with the needs of developing world can be considered as a powerful tool to prevent them from being in NEET, by creating opportunities for entrepreneurship. These opportunities, however, might be locked because of lack of access to financial services alongside the legal and regulatory barriers. When unlocked, they would not only to lead the youth to access to decent work, but also overall economy would benefit from the productive employment.
Figure 2. Youth in NEET in South Asia
Education among young population remains low with a literacy rate of the youth was 88.25% by 2016 in South Asia. Gender parity in youth literacy, even it follows an improving trend, registered as 0.95. In Bangladesh, Maldives, and Sri Lanka, the female youth has higher literacy rate than their peers. The percentage of primary-school-age children who are not enrolled in primary or secondary school is 6.56 in South Asia. In terms of children out of school, Bhutan and Pakistan experience remarkably high rates of 18.05% and 23.55%, respectively. In Pakistan, the gender gap in children out school, even it has a decreasing trend, is remarkably high as 29.39% of girls are out primary school compared to 18.11% of boys. (WDI, 2016 and Author’s calculations)
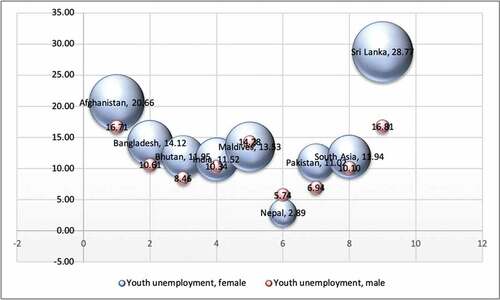
Youth unemployment, in average, was 10.55% in South Asia as of 2018 (WDI, 2018 and Author’s calculations, ). However, being in the labour force is not a measure of empowerment especially for the population below 18 years old. Instead of being in the labour force, the youth need to get empowered through better education and training therefore much more decent work opportunities in the future that would also enhance economic growth by increasing productivity.
Figure 3. Youth unemployment in South Asia by 2018
While account ownership among adults has reached globally to 69% in 2017 increasing from 62% in 2014 and 51% in 2011; only 63% of adults have account in developing economies. This stands at 55% in South Asia. Mobile money accounts have been widely spread in sub-Saharan Africa, exceeding 10%, as well Bangladesh in South Asia, exceeding 20%. About 1.7 billion adults are unbanked of which almost one-fifth are living in Bangladesh, India, and Pakistan. Overall, in South Asia, 45% of adults are still unbanked. Among those, Bangladesh and Pakistan experience a remarkably high gender gap exceeding 30 percentage points. Among the South Asian youth, account ownership is much lower at 55.8% and 52.9% for 15–24 and 18–24 age groups, respectively (The Global 2017 Findex Database and Author’s calculations).
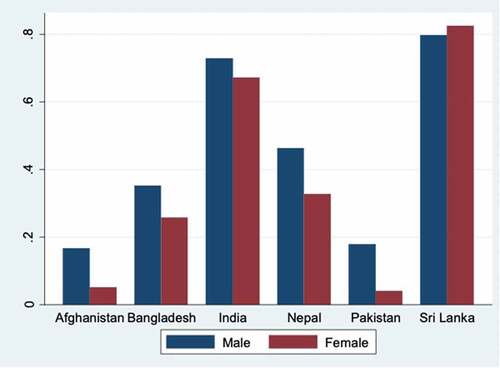
For the South Asian youth, account ownership is strongly associated with gender, being educated, having a national ID, having mobile phone. Within the youth, gender inequality is remarkably high except Sri Lankan youth (Figure ).
Figure 4. Account ownership by South Asian youth by countries
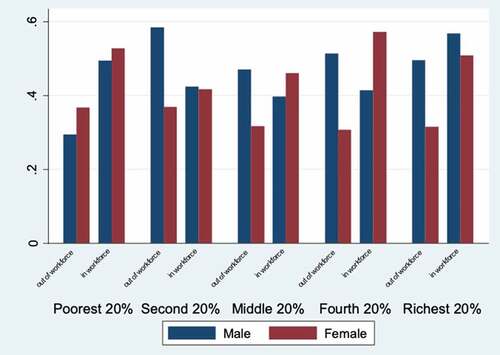
In South Asia, being educated is strongly associated with the account ownership unexceptionally for all the income quantiles for both women and men alike (Figure ) while the effect of being in the workforce is mixed for men within various income quintiles (Figure ).
Figure 5. Account ownership by South Asian youth by income level and education level
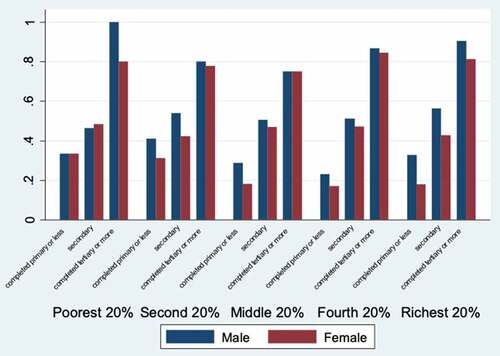
Figure 6. Account ownership by South Asian youth by income level and employment status
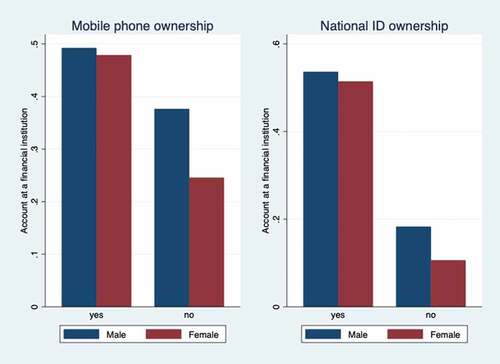
Access to other services (e.g., having an ID and/or mobile phone) affects the account ownership status (Figure ), much more among the women.
Figure 7. Mobile phone, ID, and account ownership by South Asian youth
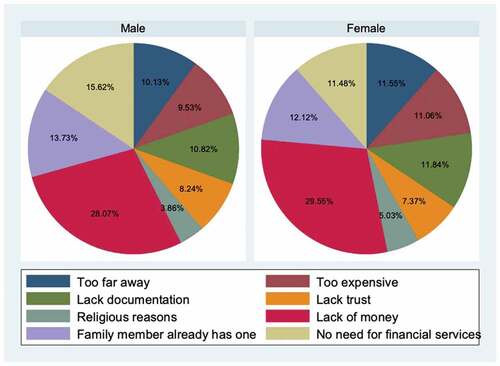
Even though the reasons behind the financial exclusion slightly differ among genders, lack of money, relying on family member’s account, and needlessness of account are the most dominant reasons of not having an account (Figure ).
Figure 8. Why financially excluded?
Empowering youth is not only driven by equal access to education and training from childhood but also by equal access to immediate basic needs for life as well as access to health services. Unless providing immediate basic needsFootnote2 and adequate health services, it would not be possible to expect equal outcomes from (equal) education, thus governments’ expenditure on education and health would enhance the social and financial inclusion of the youth. Along with universal social protection strategies, financial inclusion may play in important role in empowerment through providing means for entrepreneurship. A gender-responsive global strategy for the youth empowerment would need to address the legal and regulatory framework which facilitates the low-cost and efficient ways of access to finance given the weight of youth population in South Asia.
Gender bias in financial inclusion may also arise due to parents’ characteristics including income, education, occupation, and financial literacy; therefore, including these characteristics as instruments might have addressed the possible endogeneity problem in explaining gender bias. However, in the absence of such internal instruments, an interaction term between being female and receiving wage or payments from self-employment is included to control gender bias in the labour market and its possible indirect impact on financial inclusion since legal and regulatory framework may prevent women from in the labour market. With this background, this paper, after constructing a composite index of financial inclusion, provides further empirical evidence on the drivers of demand side of (formal) financial inclusion.
3. Literature review
Financial inclusion which may be defined as the access to and the use of formal financial services by households and firms is seen by policymakers as a way to improve people’s livelihoods, reduce poverty, and advance economic development (Sahay et al., Citation2015), and reduce income inequality (Dabla-Norris et al., Citation2015b, Citation2015a). A general definition of the financial development may be explained by the financial depth measures such as ratio of the private credit or stock market capitalisation to GDP (Svirydzenka, Citation2016). World Bank (Demirguc-Kunt et al., Citation2018) defines financial inclusion as means that individuals and businesses have access to useful and affordable financial products and services delivered in a responsible and sustainable way. World Bank (Pearce & Ortega, Citation2012) suggests the main types of indicators as access indicators, usage indicators, quality measures, and an indicator assessing how financial inclusion affects households’ and firms’ outcome. International Monetary Fund (Svirydzenka, Citation2016) creates nine indices that summarises how developed financial institutions and financial markets are in terms of depth, access, and efficiency, then aggregate these indices into an overall index of financial development covering 183 countries on annual frequency between 1980 and 2013.
On the demand side of financial inclusion, Demirguc-Kunt and Klapper (Citation2012a) present the 2011 wave of the Global Findex Database, the set of indicators that measure saving, borrowing, making payments, and managing risk behaviour of adults in 148 economies. The Global Findex Database which is a world-wide dataset on how adults save, borrow, make payments, and manage risk has been published every three years since 2011. It covers more than 150,000 adults in over 140 economies. The 2017 edition of the Global Findex Database includes updated indicators on access to and use of formal and informal financial services, adding new data on the use of financial technology (FinTech), including the use of mobile phones and the internet to conduct financial transactions (The World Bank, Citation2017). Aslan et al. (Citation2017) introduces a multi-dimensional index that captures financial access and the intensity of using financial services as a multi-dimensional concept based on account ownership, debit card ownership, credit card ownership, frequency of using these services, saving at and borrowing from a financial institution, having borrowed from a financial institution, and having emergency funds.
Development benefits of the financial inclusion are being increasingly addressed in the literature. Among others, financial services could help people accumulate savings, mobile money services could enhance people’s income earning potential, digital financial services could help people in managing financial risk and lower the cost of receiving payments, and for governments, and switching to digital payments could reduce corruption and improve efficiency (Demirguc-Kunt et al., Citation2017). Lack of access to formal financial services has implications on entrepreneurship by restricting economic opportunities for youth, especially for the female youth and women in general (United Nations Development Programme (UNDP), Citation2021). Gender inequality in financial inclusion persists (Allen et al., Citation2012) and this has further implications on female labour force participation and women’s empowerment.
Among other regional and country level studies, Pearce (Citation2011) identifies constraints, opportunities, and priorities for significantly improving access to finance in the MENA region; and suggests for a common financial inclusion strategy agreed by governments, a legal and supervisory framework by the regulators, a much more developed financial infrastructure, and removing barriers to the growth of Islamic financial services. Momani (Citation2022) emphasizes that MENA region needs specialized tools for women and youth to enhance their financial inclusion, break down regulatory barriers, access to microfinance, and to acquire necessary skills. Lyons and Kass-Hanna (Citation2021), using the 2014 Global Findex, find that economically vulnerable populations are significantly less likely to be financially included and to have lower financial literacy, and that those with higher financial literacy tend to save more and borrow less, especially from informal sources. Triki and Faye (Citation2013) suggest that relying on supply-side data collected by national regulators and supervisory bodies is not sufficient and that policymakers in Africa should advocate for national demand-side surveys to better understand financial inclusion in the region. Shihadeh (Citation2022), using the 2014 Global Findex data for Palestine, finds that women, the poor, and the less educated are less likely to be included in financial transactions, especially transactions involving borrowing and having formal accounts. Khmous and Besim (Citation2020), considering the Global Findex data for selected 14 MENA countries, find that being male, wealthier, and older increases the probability of meeting financial inclusion and that Islamic banking share has a negative effect on financial inclusion. Fungáčová and Weill (Citation2015), using the 2011 Global Findex data for China, find that women are less likely to report having a formal account or a formal loan but are not less likely to have formal saving. Asuming et al. (Citation2019) show that individual-level covariates (age, education, gender and wealth), macroeconomic variables (growth rate of GDP and presence of financial institutions), and business freedom are significant determinants of financial inclusion and that financial inclusion policies should first target women and young people. OECD (Garcia et al., Citation2013) highlights that public institutions in the Latin America and the Caribbean region should continue to take into account the specific needs of the financially excluded and of the rural population and address those when designing financial education policies and programmes. Seng (Citation2021), after analysing the effects of financial inclusion on poverty in Cambodia, shows that the use of financial services contribute to reducing household budget deficit and poverty if the users, females in particular, have at least basic financial knowledge. Banerjee et al. (Citation2021), after analysing the effects of financial inclusion on economic development in 20 Asian countries, show that that aggregate financial inclusion has a strong positive effect on all development outcomes and this effect improves for countries with lower political risk.
Empowerment theory focuses on both processes and outcomes (Swift & Levin, Citation1987) and it takes on different forms for different people and different contexts (Zimmerman, Citation2000). Youth empowerment at the individual level could be defined as exercising power over one’s life by being skilled, critically aware, and active in creating community change (Zimmerman & Rappaport, Citation1988). Microeconomic determinants such as individual characteristics (Zins & Weill, Citation2016) and barriers including lack of documentation and distance to financial services and banking costs (Allen et al., Citation2012; Demirguc-Kunt & Klapper, Citation2012a) are reported among the drivers of financial inclusion as well as country-level characteristics including financial development (Deléchat et al., Citation2018). It should also be noted that legal restrictions against women (Demirguc-Kunt et al., Citation2013) and youth (Sykes et al., Citation2016) may also prevent them to be financially included.
This leads an emerging need to address how to increase the financial inclusion and therefore social inclusion of the South Asian youth from a gender equality perspective. With this background, this paper, after providing an overview of the South Asian youth population, it analyses the patterns of financial inclusion among the South Asian youth across genders, educational levels, and income quintiles, and then it provides empirical evidence on the drivers of demand side of (formal) financial inclusion.
4. Methodology
This paper, using the comprehensive micro-level survey data of the Global 2017 Findex Database,Footnote3 first constructs the multidimensional index of financial inclusion for South Asian countries. Furthermore, after constructing the multidimensional index of financial inclusion, combines the comprehensive individual level information with the country-level data including policies and structural country characteristics and estimates the model to define the micro- and macro-level determinants of individual financial inclusion measured with the multidimensional index of financial inclusion for the South Asian youth. Therefore, the first two subsections below explain the construction of multidimensional index and the empirical specification of the estimated models, respectively.
4.1. Dataset and index of financial inclusion
The Global Findex Database contains, in addition to demographics, information on how adults save, borrow, make payments, and manage risk for more than 150,000 adults in over 140 economies, collected through nationally representative surveys. It has been published every three years since 2011 and it complements the supply side information on financial inclusion, for example, Financial Access Survey (FAS) released by the IMF, adding up demand side information as well as intensity of use of financial services. In addition to previous waves, the 2017 edition includes updated indicators on access to and use of formal and informal financial services, adding new data on the use of financial technology (FinTech), including the use of mobile phones and the internet to conduct financial transactions (The World Bank, Citation2017).
This paper constructs the composite index of financial inclusion introduced by Aslan et al. (Citation2017) following the JCA (Joint Correspondence Analysis)Footnote4 method which is a factor-analytic technique for categorical variables (Greenacre, Citation2017). First, based on the latest, the 2017 Global Findex Survey’s 10 questions (Table ), which are related to financial inclusion and do not include demographics are selected to construct the multidimensional financial inclusion index.
Table 1. Questions used to construct the financial inclusion index
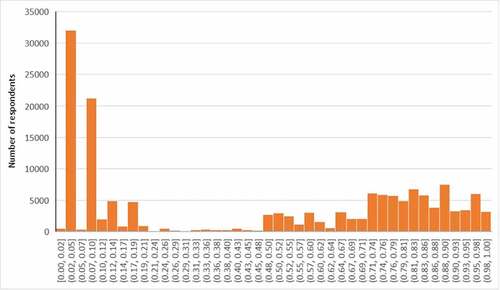
Thus, the multi-dimensional index of financial inclusion scores gives a sense of the intensity of the use of financial services alongside the access to financial services. After calculating individual financial inclusion scores based on JCA, the individual scores are normalized between 0 and 1. Furthermore, to avoid extreme values from distorting the 0–1 values, the individual financial scores are winsorized with 1st and 99th percentiles set at cut-off levels. The JCA (Greenacre, Citation2017) gives categorical variables a notion of distance, so that the multi-dimensional index of financial inclusion scores is continuous (Figure ). Individuals who were assigned the financial scores near 1 have the highest financial inclusion. The concentration on low financial inclusion side is mainly due to South Asia and sub-Saharan Africa.
Figure 9. Distribution of Financial Inclusion Scores
Two different multi-dimensional indices of financial inclusion are calculated being world-wide and South Asia-specific. South Asia sample covers Afghanistan, Bangladesh, India, Nepal, Pakistan, and Sri Lanka due to data availability. For comparison, Table (Annex) gives an overview of the ESCAP region in terms of financial inclusion. In order to avoid extreme values in South Asian sample while analysing the drivers of financial inclusion, South Asia-specific financial inclusion index is used. Country averages of the financial inclusion calculated based on the World-wide (Table ) and South Asian samples are listed in Annex (Table ). Among the South Asian countries,Footnote5 Sri Lanka has the highest financial inclusion score followed by India. At the bottom line, Afghanistan and Pakistan, having the lowest and second-lowest scores, respectively, are also at the end of ranking among ESCAP countries. Afghanistan and Pakistan rank also last globally together with a few sub-Saharan African countries and Iraq.
4.2. Empirical specification
This paper, further, combines the comprehensive individual level information with the country-level data including policies and structural country characteristics.Footnote6 While combining the individual and country level data, all the data are stratified, in other words the population of N units is first divided into homogeneous and mutually exclusive groups called strata (Singh et al., Citation2016), to ensure each subgroup within the population receives proper representation within the sample.
Since the women’s economic decisions and their access to the labour market may also differ from men, an interaction between gender dummy and receiving wage or self-employment payments would help better observing the differentiated effects on financial inclusion.
While demographic data, covering gender, education level, income quintile, being wage employed, being employed, national ID ownership, and mobile phone ownership come from the 2017 Global Findex Database and the multi-dimensional index comes from own calculations using the 2017 Global Findex; macro-level data come from different sources including World Development Indicators (World Bank) for government spending on education and health, and IMF for financial development index. The list of variables and their descriptive statistics are reported in Table A3 and in , respectively.
The paper shows empirical evidence of the drivers of financial inclusion, namely the multi-dimensional index of financial inclusion, for the South Asian youth. Particular focus is given to the 18–24 age group in the analyses as being employed and having completed secondary education would be more relevant for this age group instead of the whole youth sample. The financial inclusion of the female youth is expected to be lower than their male peers. Furthermore, individuals at the bottom of income quintile within the country, individuals who are not formally employed and less educated are expected to have much lower financial inclusion. Therefore, this paper first investigates the relationship between financial inclusion and gender, (formal) employment status, education level, and household income level (EquationEquation 1(1)
(1) ). Second, it investigates government policies on education and health (EquationEquation 2
(2)
(2) ) in a multilevel framework for 2017. The model which is built on the baseline model studied in Deléchat et al. (Citation2018), focusing on South Asian countries and is further developed in a multilevel framework.
Thus, EquationEquation 2(2)
(2) aims at explaining the financial inclusion for individual i and country j with gender, (formal) employment status, education level, household income level, and government policies on education and health. The survey dataset is strafiedFootnote7 by the country before estimating the model in a multilevel framework.
5. Empirical results
At the individual level, demographic characteristics are strongly associated with being financially included. Being women, standing at the bottom level of income distribution, and being less educated negatively affect the financial inclusion. Among the South Asian youth; women and individuals at the bottom level of income distribution have lower financial inclusion while (formally) employed proxied by receiving wage or self-employment benefits, individuals with secondary and higher education have higher financial inclusion when controlling also for the overall financial development level of the country (Table ). Instead, being in the workforce in general is not a strong driver of the financial inclusion for the same sample as shown in the robustness checks (Table ).
Table 2. Drivers of youth’s financial inclusion in South Asia
The findings (Columns 1 and 2 of Table ) imply that females tend to have lower financial inclusion than males do. Contrarily, individuals with secondary and higher education, individuals receiving wages or payments from self-employment, and individuals with national ID tend to have higher financial inclusion. Overall financial development level within the country also drives the financial inclusion of the youth.
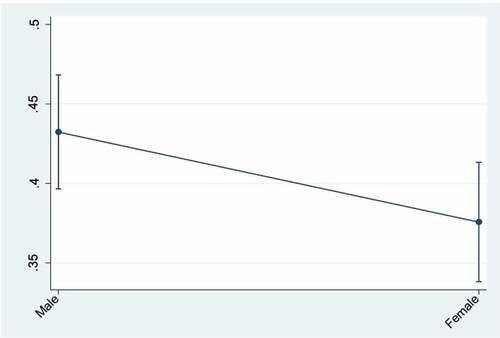
The analyses, then, are extended including national level policy variables, considering the multilevel framework, in order to observe how the macro-level policies could enhance the financial inclusion at the individual level (Table , Column 3), estimating the effects of the education and health expenditure as a proportion of total government expenditure. The effects of the government expenditure on education and health as a proportion of general government expenditure are given in Column 3. In South Asia, in average, increasing government expenditure on education (as percentage of total government expenditure) 1 percentage point would be associated with an increase of 0.33 percentage points in the financial inclusion of the South Asian youth. While increasing government expenditure on health (as percentage of total government expenditure) 1 percentage point would be associated with an increase of 0.15 percentage points in the financial inclusion of the South Asian youth. Furthermore, Figure shows the predictive margins in financial inclusion between female and male subpopulations.
Figure 10. Predictive margins by gender with 95% CIs
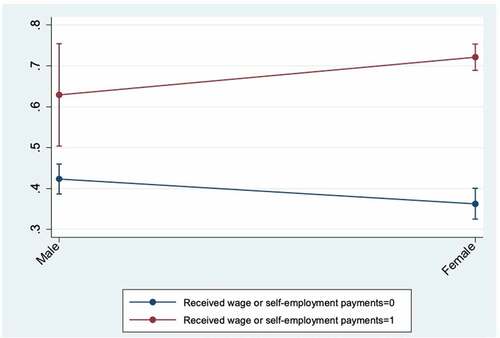
As legal and regulatory framework may prevent women from being employed and/or self-employed, this paper also tests for the interaction between being female and receiving wage or payments from self-employment. This would provide a better understanding how the impact of adopting a gender-responsive global strategy aiming at increasing women’s employment or entrepreneurship would create a leverage effect on financial inclusion (). As such, for female youth, the effect of receiving wage or payments from self-employment is larger than the male youth. Among female youth, the ones who receive wage or payments from self-employment, holding other factors constant, would have 0.358 percentage point higher financial inclusion. Yet, among male youth, the ones who receive wage or payments from self-employment, holding other factors constant, would have 0.206 percentage point higher financial inclusion.
Figure 11. Predictive Margins of Female*Received wage or self-employment payments with 95% CIs
When controlled for the whole sample of South Asia (without filtering for the youth sample), the effects of being female, having completed secondary or higher education, receiving wage or self-employment payments, and policies are observed, in absolute terms, much lower than the youth sample (Table ). Even though the gender gap matters for financial inclusion for the whole sample, it is much larger among the youth.
In order to see how two subpopulations (female and male) differ from each other, the youth sample is further split into female and male subpopulations (Table ). The effects of demographics and country-level characteristics on financial inclusion differ among genders. The impact of receiving payments from employment or self-employment, having national ID, financial development level, and government expenditure is much higher for female subpopulation than the male subpopulation. Contrarily, having secondary or higher education is lower impact on financial inclusion for female subpopulation. Additionally, while belonging to the poorest income quintile has a negative significant impact on female financial inclusion, its effect is not significant for the male subpopulation.
Table 3. Drivers of youth’s financial inclusion in South Asia by gender
Furthermore, in order to test whether if the effects of policies significantly differ among the South Asian countries, the model is extended by adding random slopes for government expenditure on education and on health in a multilevel framework. Then, multilevel mixed-effects estimations are conducted (Table , Annex). The significance of random slopes is also tested based on the likelihood-ratio test to compare the model including random slopes to the nested model (Table , Annex) and it is found that including random slopes do not create statistically significant improvement in the fit of the model. Given a certain level of overall financial development level, the impact of policies on financial inclusion does not significantly differ among South Asian countries.
When compared to the previous studies, being women, being at the bottom level of income distribution, or being less educated negatively affect the financial inclusion, similarly in the studies by Deléchat et al. (Citation2018), Shihadeh (Citation2022) in the case of borrowing and having formal accounts, and Fungáčová and Weill (Citation2015) and Khmous and Besim (Citation2020) in the case of having formal accounts. However, the policy implications in Shihadeh (Citation2022), Fungáčová and Weill (Citation2015), and Khmous and Besim (Citation2020) would be limited since their models do not contain policy variables, while this current study suggest policies based on the empirical evidence provided following the hierarchical structure of models presented in the paper.
Additionally, this current study controls for the overall financial development as in Deléchat et al. (Citation2018), Shihadeh (Citation2022), and Fungáčová and Weill (Citation2015) do not control for the overall financial development while Khmous and Besim (Citation2020) controls for the Islamic banking sharing. The inclusion of the Islamic banking sharing in the model, except for only few South Asian countries, would not be currently very relevant for the South Asian subregion considering the population weight of the countries. Additionally, in line with the previous IMF study (Deléchat et al., Citation2018), which is conducted for the global sample; this paper also finds, among the South Asian youth, being (formally) employed proxied by receiving wage or self-employment benefits positively affect individuals’ financial inclusion when controlling also for the overall financial development level of the country.
6. Conclusion
Income level matters for financial inclusion but education level of the individual is the key. The income quintile which the individual belongs to affects the financial inclusion, but especially for the lowest income quintiles, education becomes even much more important to enhance the financial inclusion. Employment drives financial inclusion when it is formal. Being employed, unless it is formal, is not strongly associated with financial inclusion. Instead, formal employment is strongly associated with financial inclusion. Having national ID which is one of the drivers of financial inclusion needs to be considered as a goal itself. As such, not having national ID may prevent people from accessing to health, education, and finance. In this respect, regional and sub-regional studies come into prominence in order to determine the policy priorities such that providing access to education for all, improving the labour market mechanisms against informal employment, or establishing an efficient national ID system might be of top priority in a given region, sub-region, or country.
Allocation of the government expenditure into education and health would enhance the financial inclusion among the youth, especially for the female youth. Given a certain financial development level, increasing government expenditure on education and health as a proportion of total government expenditure will boost the youth financial inclusion, especially for the female youth. Multilevel framework allows to show differentiated effects of the same policies for a given level of financial development and on different subgroups of population and it should be considered in the future policy research.
Following the key findings of the current study, policymakers could choose appropriate government spending as a tool to increase youth and female youth’s financial inclusion. In South Asia, government spending on education is shown as a much more powerful tool than on health to enhance the youth’s financial inclusion. Moreover, the impact of government spending on education is stronger in female subgroup than in male subgroup. Policymakers could also focus on increasing female youth’s financial inclusion in order to narrow the gender gap, by introducing policies on increasing female labour force participation and on improving national ID systems. For example, in countries with low national ID coverage, governments can prioritise to establish robust national ID systems that in turn would break down one of the main barriers towards accessing to formal financial services.
The current study focuses on a sample of youth population from 18 to 24 years old (being employed and having completed secondary education would be more relevant for this age group instead of the whole youth sample as highlighted above) in South Asian countries and looks at female and male subgroups separately. Future studies can incorporate and/or focuses on regional, sub-regional, and groups of countries with different income levels. Further studies can also look at the evolution of Islamic banking and its impact on youth and female youth’s financial inclusion where it is relevant such as in MENA and in Southeast Asia.
Disclosure statement
No potential conflict of interest was reported by the author(s).
Additional information
Funding
Notes on contributors

Goksu Aslan
Goksu Aslan currently works as an Instructor of Economics at New York University Abu Dhabi. Her research interests revolve around economic growth, income inequality, financial inclusion, and gender inequality. Before joining NYUAD, she was as an Associate Economic Affairs Officer at the United Nations Economic and Social Commission for Asia and the Pacific (ESCAP) on promoting regional cooperation for inclusive and sustainable economic and social development in South and South-West Asia and a Postdoctoral Research Fellow at the University of Milano-Bicocca. The research reported in this paper relates to how youth and women’s financial inclusion can be enhanced in South Asia and how this can contribute to the development in the sub-region.
Notes
1. The latest data for NEET figures are available in 2017 for Bangladesh, 2012 for India, and 2015 for Pakistan.
2. A traditional list of immediate “basic needs” is food (including water), shelter and clothing. Modern lists emphasize also sanitation, education, healthcare, and internet. Denton, John A. (1990). Society and the official world: a reintroduction to sociology. Dix Hills, N.Y: General Hall. p. 17. ISBN 978-0-930,390-94-5.
3. The Global Findex database is a world-wide data set on how adults save, borrow, make payments, and manage risk. Launched with funding from the Bill & Melinda Gates Foundation, the database has been published every three years since 2011. The data are collected in partnership with Gallup, Inc., through nationally representative surveys of more than 150,000 adults in over 140 economies. The 2017 edition includes updated indicators on access to and use of formal and informal financial services, adding new data on the use of financial technology (FinTech), including the use of mobile phones and the internet to conduct financial transactions (The World Bank, Citation2017). The survey includes individual weights. In addition to the survey weights, country weights are calculated using formula; where
denotes sample size and
denotes country population to provide correct representation of the countries. Furthermore, throughout the paper final weights are used based on the formula
; where
denotes individual weights and
denotes country weights and the dataset is stratified by country.
4. Joint Correspondence Analysis (JCA) is one of the methods in the class of Correspondence Analysis (CA) giving a notion of distance to the categorical variables along with the Multiple Correspondence Analysis (MCA), provides an iterative method of finding a best fit of inertia measures.
5. While South Asia refers Afghanistan, Bangladesh, Bhutan, India, Maldives, Nepal, Pakistan, and Sri Lanka; because of the data unavailability in the 2017 Global Findex Database for two South Asian countries, namely Bhutan and Maldives, are not included in the analyses.
6. All the data are stratified by country to ensure each subgroup within the population receives proper representation within the sample.
7. Stratification means the population of N units is first divided into homogeneous and mutually exclusive groups called strata (Singh et al., Citation2016).
References
- Allen, F., Demirguc-Kunt, A., Klapper, L., & Martinez Peria, M. S. (2012). The foundations of financial inclusion: Understanding ownership and use of formal accounts. The World Bank Group.
- Aslan, G., Deléchat, C., Newiak, M., & Yang, F. (2017). Inequality in financial inclusion and income inequality. IMF Working Paper. International Monetary Fund.
- Asuming, P. O., Osei-Agyei, L. G., & Mohammed, J. I. (2019). Financial inclusion in Sub-Saharan Africa: Recent trends and determinants. Journal of African Business, 20(1), 112–29. https://doi.org/10.1080/15228916.2018.1484209
- Banerjee, R., Donato, R., & Maruta, A. A. (2021). The effects of financial inclusion on development outcomes: New insights from ASEAN and East Asian countries. In Chapter 2 in Financial Inclusion in Asia and Beyond, (1st). Routledge.
- Dabla-Norris, E., Ji, Y., Townsend, R. M., & Unsal, D. F. (2015b). Distinguishing constraints on financial inclusion and their impact on GDP, TFP, and inequality. NBER Working Paper No. 20821. Cambridge, MA: National Bureau of Economic Research.
- Dabla-Norris, E., Kochhar, K., Suphaphiphat, N., Ricka, F., & Tsounta, E. (2015a). IMF Staff Discussion Notes 2015/13. International Monetary Fund.
- Deléchat, C., Newiak, M., Xu, R., Yang, F., & Aslan, G. (2018). What is driving women’s financial inclusion across countries? IMF Working Paper 2018/038. International Monetary Fund.
- Demirguc-Kunt, A., & Klapper, L. (2012a). Measuring financial inclusion: The global findex database. Policy Research Working Paper WPS6025. The World Bank.
- Demirguc-Kunt, A., Klapper, L., & Singer, D. (2013). Financial inclusion and legal discrimination against women: Evidence from developing countries. Policy Research Working Paper WPS6416. The World Bank.
- Demirguc-Kunt, A., Klapper, L., & Singer, D. (2017). Financial inclusion and inclusive growth: A review of recent empirical evidence. Policy Research Working Paper WPS8040. The World Bank.
- Demirguc-Kunt, A., Klapper, L., Singer, D., Ansar, S., & Hess, J. (2018). Global findex database 2017: Measuring financial inclusion and the FinTech revolution. World Bank.
- Fungáčová, Z., & Weill, L. (2015). Understanding financial inclusion in China. China Economic Review, 34, 196–206. 1043-951X https://doi.org/10.1016/j.chieco.2014.12.004
- Garcia, N., Grifoni, A., Lopez, J. C., & Mejía, D. (2013). Financial education in Latin America and the Caribbean: Rationale, overview and way forward. OECD Working Papers on Finance, Insurance and Private Pensions, No. 33, OECD Publishing.
- Greenacre, M. (2017). Correspondence analysis in practice (3rd) ed.). Chapman and Hall/CRC.
- International Labour Organization (ILO). (2015). Decent work and the 2030 Agenda for sustainable development. Available from https://www.ilo.org/wcmsp5/groups/public/—europe/—ro-geneva/—ilo-lisbon/documents/event/wcms_667247.pdf
- Khmous, D. F., & Besim, M. (2020). Impact of Islamic banking share on financial inclusion: Evidence from MENA. International Journal of Islamic and Middle Eastern Finance and Management, 13(4), 655–673. https://doi.org/10.1108/IMEFM-07-2019-0279
- Lyons, A. C., & Kass-Hanna, J. (2021). Financial inclusion, financial literacy and economically vulnerable populations in the Middle East and North Africa. Emerging Markets Finance and Trade, 57(9), 2699–2738. https://www.tandfonline.com/doi/abs/10.1080/1540496X.2019.1598370?journalCode=mree20
- Momani, B. (2022). Promoting Entrepreneurship in MENA: A catalyst for a sustained and inclusive recovery from COVID-19. Middle East Institute (MEI).
- Pearce, D. (2011). Financial inclusion in the Middle East and North Africa: Analysis and roadmap recommendations. World Bank Group. https://doi.org/10.1596/1813-9450-5610
- Pearce, D., & Ortega, C. R. (2012). Financial inclusion strategies: Reference framework (English). World Bank Group. http://documents.worldbank.org/curated/en/801151468152092070/Financial-inclusion-strategies-reference-framework
- Sahay, R., Cihak, M., N’Diaye, P. M., Barajas, A., Mitra, S., Kyobe, A. J., Mooi, Y. N., & Yousefi, Y. (2015). In IMF Staff Discussion Notes 2015/017. International Monetary Fund.
- Seng, K. (2021). The poverty-reducing effects of financial inclusion: Evidence from Cambodia. In Financial inclusion in Asia and beyond, (1st) (pp. 197–226). Routledge.
- Shihadeh, F. H. (2022). Individual’s behavior and access to finance: evidence from Palestine. Singapore Economic Review, 67(1), 113 133. https://doi.org/10.1142/S0217590819420025 Mar2022
- Singh, S., Sedory, S. A., Rueda, M. M., Arcos, A., & Arnab, R. (2016). Tuning in stratified sampling. Chapter 8 in A new concept for tuning design weights in survey sampling. Academic Press. [9780081005941]. https://doi.org/10.1016/B978-0-08-100594-1.00008-5
- Svirydzenka, K. (2016). Introducing a new broad-based index of financial development. International Monetary Fund Working Paper 16/5. Washington, D.C.: International Monetary Fund.
- Swift, C., & Levin, G. (1987). Empowerment: An emerging mental health technology. The Journal of Primary Prevention, 8(1–2), 71–94. https://doi.org/10.1007/BF01695019
- Sykes, J., Elder, S., & Gurbuzer, Y. (2016). Exploring the linkages between youth financial inclusion and job creation: Evidence from ILO school-to-work transition surveys. Work4Youth Publication Series, (42). https://www.ilo.org/wcmsp5/groups/public/---ed_emp/documents/publication/wcms_533567.pdf
- Triki, T., & Faye, I. (2013). Financial inclusion in Africa. African Development Bank.
- United Nations. (1981). International Youth Year: participation, development, peace: Report of the Secretary-General (A/36/215). UN, 19 June 1981.
- United Nations. (2015). Transforming our world: The 2030 agenda for sustainable development. Available from https://sustainabledevelopment.un.org/post2015/transformingourworld
- United Nations, Department of Economic and Social Affairs, Population Division. (2019). World population prospects 2019. Online Edition. Rev. 1. United Nations.
- United Nations Development Programme (UNDP). (2021). Addressing gender barriers to entrepreneurship and leadership among girls and young women in South-East Asia. Available from https://www.undp.org/sites/g/files/zskgke326/files/publications/UNDP-RBAP-Gender-Barriers-to-Entrepreneurship-Leadership-among-Girls-and-Young-Women-SE-Asia-2021_0.pdf
- United Nations Economic and Social Commission for Asia and the Pacific (ESCAP). (2018). Achieving the sustainable development goals in South Asia: Key policy priorities and implementation challenges. Available from https://www.unescap.org/sites/default/files/publications/UNESCAP%20-%20SRO-SSWA%20SDG%20Report_Sep2018.pdf
- The World Bank. (2017). World Development Indicators.
- Zimmerman, M. A. (2000). Empowerment theory: Psychological, organizational, and community levels of analysis. In J. Rappaport & E. Seidman (Eds.), Handbook of community psychology (pp. 43–63). Kluwer Academic Publishers.
- Zimmerman, M. A., & Rappaport, J. (1988). Citizen participation. Perceived Control, and Psychological Empowerment. American Journal of Community Psychology, 16, 725–750. https://link.springer.com/article/10.1007/BF00930023
- Zins, A., & Weill, L. (2016). The determinants of financial inclusion in Africa. Review of Development Finance, 6(1), 46–57. https://doi.org/10.1016/j.rdf.2016.05.001
Annex
Table A1. Ranking of financial inclusion country averages—the whole sample
Table A2. Ranking of financial inclusion country averages—South Asian sample
Table A3. List of variables
Table A4. Descriptive statistics
Table A5. Correlation matrix
Table A6. Robustness checks with interactive dummies
Table A7. Drivers of youth’s financial inclusion in South Asia
Table A8. Drivers of financial inclusion in South Asia
Table A9. Predictive margins
Table A10. Predictive margins
Table A11. Testing for random slopes