
 ?Mathematical formulae have been encoded as MathML and are displayed in this HTML version using MathJax in order to improve their display. Uncheck the box to turn MathJax off. This feature requires Javascript. Click on a formula to zoom.
Abstract
From 1990 to 2019, this study examines the nonlinear dynamic impact of financial development on income inequality in an unconventional policy regime in a panel of 21 African countries. More importantly, we use Panel Smooth Transition Regression to extend the existing debate on this subject, with roots back to the seminal work of G-J and many others, and add a twist by distinguishing between a conventional (1990–1999) and unconventional policy regime (2000–2019), as well as the threshold level at which financial development reduces inequality. Our baseline results will be supported by the Generalized Method of Moments. The PSTR model was chosen because it can account for features that dynamic panel techniques cannot, such as endogeneity, homogeneity, cross-country variability, and time instability within the model. We found evidence of a non-linear effect between the two variables, with the threshold found to be 21.90% of GDP, below which financial development reduces inequality in Africa, and this confirms the U-shape in unconventional policy regimes and the G-J in conventional policy regimes. Unconventional monetary policies were found to trigger the financial-inequality relationships. The focal policy recommendation is that the financial sector be given adequate consideration and recognition by, inter alia, implementing appropriate financial reforms, developing an adequate investment strategy, and maintaining spending on science and technology investment in African countries below the threshold. Again, when implementing unconventional monetary policies in African countries, extreme caution is required.
1. Background of the study
For decades, economists and politicians have debated the impact of financial development on income inequality. To date, there have been controversies in both the theoretical predictions and the empirical literature in identifying the role of financial development in income inequality. There are three broad strands of hypotheses in the theoretical perspective of financial inequality. The first strand believes in the G-J inverted U-shape (Greenwood & Jovanovic, Citation1990), while the second strand believes in the inequality-widening hypothesis (Greenwood & Jovanovic, Citation1990; De Gregorio, Citation1996). The final strand believes in the hypothesis of inequality reduction (Galor & Zeira, Citation1993)
The extant literature on the relationship between financial development and income inequality is vast and has capitulated extensive conflicting outcomes. Some authors found non-linearity, claiming that the relationship between the two variables is explained by the G-J inverted U-shape (Bolarinwa & Akinlo, Citation2021; Destek et al., Citation2020; Hassan & Meyer, Citation2020; De la Cuesta-González et al., Citation2020; Matsuyama, Citation2000), and others the U-shape (Zungu & Greyling, Citation2021). There are also authors who fail to support the G-J curve hypothesis, but support the inequality-narrowing hypothesis (Galor & Zeira, Citation1993; De Haan and Sturm 2017; Séraphin & Cyrille, Citation2022), while others believe in the inequality-widening hypothesis (Mookherjee & Ray, Citation2003; Hamori & Hashiguchi, Citation2012; Altunbaş & John Thornton, Citation2019; Özcac, Citation2019). Even among the studies that have been conducted in African countries, a strong paradox emerged as some of these studies support the G-J inverted U-curve (Batuo et al., Citation2010) or the U-shape (Tita & Aziakpono, Citation2016), while others believe in inequality-widening (Jobarteh & Kaya, Citation2019). When investigating the finance-inequality relationship, the contradiction in these results may be due to, but not limited to, the plausible explanation that the divergent results in the existing literature can be attributed to differences in model specifications, data sets, and estimation techniques, or the level of the economy being studied. After reviewing the literature on the relationship between financial development and inequality, we found that no studies attempted to provide the threshold effect by which financial development increases inequality in African countries. As a result, the current study seeks to establish a point beyond which financial development increases inequality in African countries. We believe that funding the finance-inequality threshold would assist policymakers in determining how much finance is beneficial to alleviate inequality.
Following the seminal work of Tita and Aziakpono (Citation2016), who contradict the G-J inverted U-shape, but support the U-shape relationship using the Augmented Mean Group (AMG) estimator in a panel of 15 African countries from 1985 to 2007, this study adds to the existing literature on the subject. Their research takes into account trade openness, inflation, and GDP per capita. Our study aims to broaden the existing debate on this topic, with roots in the seminal work of Greenwood and Jovanovic (Citation1990) and many others on the so-called G-J inverted U-shaped relationship, and then to add a twist by introducing a distinction between the unconventional and conventional regimes, referring to the periods 1994–1999 and 2000–2019, respectively. Furthermore, we aim to include major monetary policy variables known as unconventional monetary policy (UMP) channels (such as earning heterogeneity, income composition, and portfolio composition), which we believe are the most relevant monetary channels that may affect inequality dynamics. During the 2007 financial crisis, federal banks in various countries implemented these policy instruments. In a nutshell, we aim to examine how the UMP implemented during the financial crisis triggered the finance-inequality relationship in African countries. Following a review of the existing literature on the monetary policy side of the argument, these policy instruments are argued to have a direct or indirect impact on inequality, which was not captured by Tita and Aziakpono (Citation2016). We also believe that the correlation between the two variables may change as countries shift from a conventional to an unconventional policy regime.
Given these inconclusive and sometimes contradictory views, we seek to fill a gap in the literature by incorporating and examining the impact of financial development and those monetary policy variables and their effects on inequality in African countries that most existing studies have not addressed, as well as by providing the threshold level of financial development that beyond which financial development improve income inequality. This will provide new evidence in the African literature. We assembled a balanced panel of 21 African countries from 1994–2019. Based on data availability, the conventional policy regime covers the period 1990–1999, while the unconventional policy regime starts at 2000–2019.
This study seeks to add to this debate by examining the non-linear effects of financial development on inequality using the Panel Smooth Transition Regression (PSTR) model and panel Generalized Method of Moments (GMM) estimators. Furthermore, despite the fact that it appears to be extremely relevant, the PSTR model has never been used to investigate this topic in order to add a twist by introducing a distinction between the conventional and unconventional regimes. This model clearly allows for an examination of the impact of financial development as demonstrated by its various phases.
The PSTR model may provide new insights because it endogenously identifies different regimes that correspond with distinct equations as well as the optimal degree of financial development, i.e. the threshold value with respect to which the sign of the coefficient may differ. Furthermore, the PSTR model is unique in that individuals can shift between groups and over time as a result of changes in the threshold variable. The PSTR model provides a parametric solution to the cross-country variability and time instability of the democracy-development coefficients because the parameters fluctuate smoothly as functions of a threshold variable. These characteristics are not explained by dynamic or static panel techniques, nor by interaction effects.
Finally, the motivation for this study stemmed not only from a lack of studies examining the non-linear effect of financial development on inequality in African economies, but also from the fact that this relationship may differ from that found in the literature due to differences in the smoothness and implementation of the policies, as well as the macroeconomic policies that were implemented.
The remainder of the paper is structured as follows. Section 2 summarizes the related literature. The model is summarized in Section 3. The results of the PSTR and GMM models are discussed in Section 4. Section 5 concludes with remarks and discusses policy implications.
2. Literature review
2.1. Theoretical review of financial inequality
The theoretical perspective of the relationship between financial development and income inequality is categorized into three broad strands of hypotheses. The first strand believes in the GJ inverted U-shape, while the second strand is those who believe in an inequality-widening hypothesis. The last strand believes in an inequality-narrowing hypothesis.
The first strand is the theoretical foundation of an inverted U-curve between financial development and income inequality, that is well- known as the G-J hypothesis, developed by Greenwood and Jovanovic (Citation1990). The G-J inverted U-shape model argues about the two agents in the economy, pointing out that there are investment opportunities for each of these agents. The first agent offers a safe but low return, while the second agent yields high returns, but accompanied by high risks. Both these agents have access to the financial sector. Therefore, the economy experiences a reversal trend of the income gap. Then the financial development may increase income inequality during the early stages of development while, as the average income increases, it tends to reduce the level of income inequality after a certain threshold point.
The second strand is drawn from an inequality-widening hypothesis, based on the theory developed by De Gregorio (Citation1996). The increase in inequality entertains the view that only the well-connected and the rich benefit from the development of the financial sector, due to the fact that they have connections and collaterals, especially when the development sector is becoming weaker. A similar hypothesis is shown in the Marxist theory, which expounds the fact that financiers are greedy middlemen who serve only the interests of the wealthy upper class and those who are well-connected financially and politically. The life-cycle model, with endogenous growth, assumes that people have to decide during their youth how much time needs to be devoted to education, due to the borrowing restrictions faced by individuals. Thus, financial development increases the level of income inequality, because those with more endowments for learning have a better opportunity to become wealthy professionals and entrepreneurs, due to the fact that financial development allows individuals with financial resources to develop their human capital optimally.
The last strand focuses on the inequality-narrowing theory developed by Galor and Zeira (Citation1993), using a two-sector model, that only agents invest in invisible human-capital works in the skills-intensive sectors. The inequality-narrowing theory states that the more financial development improves, the more it narrows the differences in levels of income, since the poor will get opportunities for financial services. According to this point of view, development does not exclude poor households, since it increases opportunities for the poor to finance their education and entrepreneurship. To be more precise, financial development facilitating easier access to financial support and relaxing financial constraints is more beneficial to the poor than the rich.
2.2. Empirical review
This section contains the empirical literature on the impact of financial development on income inequality and further briefly looks at the impact of conventional and unconventional monetary policy on income inequality.
2.2.1. Effects of financial development on inequality
After scrutinizing the literature on the financial-inequality relationship, we found that a strong paradox emerges among the schools of thought, on which of the three theories, the G-J hypothesis or the U-shape relationship (Matsuyama, Citation2000; Rehman et al., Citation2008; Roine et al., Citation2009; Ang, Citation2010; Kim & Lin, Citation2011; Tan & Law, Citation2012; Azzam and Ali Raza Citation2018; Younsi and Bechtini Citation2018; Brei et al., Citation2018; Koçak & Uzay, Citation2019; Nguyen et al., Citation2019; Adams & Klobodu, Citation2019; Jung and Cha, Citation2020; De la Cuesta-González et al., Citation2020; Destek et al., Citation2020; Hassan & Meyer, Citation2020; Bolarinwa & Akinlo, Citation2021), inequality-narrowing (Galor & Zeira, Citation1993; Banerjee & Newman, Citation1993; Mookherjee & Ray, Citation2003; Beck et al., Citation2007; De Haan and Sturm, 2017; Séraphin & Cyrille, Citation2022) and inequality-widening (Mookherjee & Ray, Citation2003; Hamori & Hashiguchi, Citation2012; Altunbaş & John Thornton, Citation2019; Özcan, 2020), explain the nature of the relationship between the two variables. Furthermore, even among schools of thought investigating the financial-inequality relationship in African countries, two different findings emerge. Some support the nonlinearity hypothesis (Batuo et al., Citation2010; Tita & Aziakpono, Citation2016), while others claim that there is linearity between the two variables (Jobarteh & Kaya, Citation2019). In this section, both African and global literature is reviewed. Looking at the inconsistent results in the existing literature, it necessitates conducting a new study that uses recent data and economic models. Again, no studies in the existing literature have attempted to provide the threshold effect beyond which finance is good for inequality in African countries.
Going as far back as studies conducted by these authors (Banerjee & Newman, Citation1993; Galor & Zeira, Citation1993; Mookherjee & Ray, Citation2003), they documented the inequality-narrowing hypothesis. Their result is in contradiction with the finding reported by Mookherjee and Ray (Citation2003) as they believe in the inequality-widening hypothesis.
According to Roine et al. (Citation2009), the finance-inequality relationship was studied using the GLS in a panel of 16 OECD countries over the period from 1900–2000. The main aim of their study was to examine how changes in the top shares are related to changes in financial development in the long run. Their study focused on three different groups of income earners: the wealthy group (P99-100), the upper middle-class group (P90-99), and the rest of the population (P0-90). To achieve their main objectives, the authors used capitalisation as the sum of the bank deposits and market-cap to measure financial development. The authors explain that the effects of financial development reduce the level of income inequality by reducing the wages of low-skilled or unskilled labour, while increasing the level of income inequality by increasing the wages of highly skilled labour. Their empirical findings contradict the G-J curve, but are in line with the finding reported by Ang (Citation2010), as these studies believe in inequality narrowing.
Looking at the African literature, the study by Batuo et al. (Citation2010) tested the existence of the inverted U-shaped hypothesis, using a panel of data from 22 African countries, from 1990–2004, applying the GMM technique. The results confirmed the existence of a nonlinear relationship between financial development and income inequality, thus supporting the G-J hypothesis. The findings by Batuo et al. (Citation2010) contradict those reported by Roine et al. (Citation2009) and Ang (Citation2010). Two years later, the argument was taken further by Tan and Law (Citation2012) using dynamic panel GMM estimation. Their findings contradict the G-J hypothesis (Batuo et al., Citation2010) and those who believe finance narrows income (Ang, Citation2010; Roine et al., Citation2009), as their study documented a U-shape relationship between the two variables. The results by Tan and Law (Citation2012) were supported by Tita and Aziakpono (Citation2016), using the AMG estimator for a panel of 15 African countries over the period 1985–2007.
The contradiction further emerged in those studies that investigated the subject matter by grouping together countries based on their level of income (Altunbaş & John Thornton, Citation2019; Bolarinwa & Akinlo, Citation2021). In their study, Altunbaş and John Thornton (Citation2019) find that financial development promotes equality across inequality quintiles in upper middle-income countries, while it promotes inequality across inequality quintiles in low- and high-income countries. This then confirms that financial development is good for the upper middle class. These findings contradict those supporting the G-J hypotheses (Matsuyama, Citation2000; Rehman et al., Citation2008; Roine et al., Citation2009; Ang, Citation2010; Kim & Lin, Citation2011; Tan & Law, Citation2012; Azzam and Ali Raza, Citation2018; Younsi & Marwa Bechtini, Citation2020; Brei et al., Citation2018). However, the results reported by Bolarinwa and Akinlo (Citation2021) in the case of African countries are grouped into high-income, middle-low, and low-income countries. Their findings document that financial development tends to reduce inequality in low- and middle-income countries while increasing inequality in high-income countries. On the other hand, they reported the existence of the threshold level of financial development.
Koçak and Uzay (Citation2019) employed the DOLS and FM-OLS models to investigate the impact of financial development on income inequality in the case of Turkey. Their results support the inequality-narrowing hypothesis. Their finding contradicts those studies that believe in the G-J hypothesis (Ang, Citation2010; Kim & Lin, Citation2011; Tan & Law, Citation2012; Azzam and Ali Raza, Citation2018; Younsi and Bechtini, Citation2018; Brei et al., Citation2018). However, it is in line with those studies that believe in the inequality-narrowing hypothesis (Beck et al., Citation2007; Sehrawat and Giri, 2016; De Haan and Sturm, 2017). In the same year, a further contradiction emerged as the study by Nguyen et al. (Citation2019), conducted in an unbalanced panel of 21 emerging countries, confirms the existence of a G-J inverted U-curve hypothesis. The findings of those studies that believe in the existence of the G-J hypothesis were further supported by Adams and Klobodu (Citation2019) using the DOLS and FMOLS in South Africa covering the period 1965–2014.
Recently, the paradox has emerged even in those studies that find the existence of nonlinearity explained by the U-shaped relationship (Brei et al., Citation2018; Cihak & Sahay, Citation2020; De la Cuesta-González et al., Citation2020), as well as the others that find the inverted U-shape (Destek et al., Citation2020). Özcan, (2020) studied the impact of financial development on income inequality in a panel of emerging markets using panel co-integration. Their finding confirms that financial development has no significant effect on income inequality for the panel group. Their finding contradicts those studies that believe in the G-J hypothesis (Bolarinwa & Akinlo, Citation2021; Cihak & Sahay, Citation2020; Destek et al., Citation2020; Hassan & Meyer, Citation2020; De la Cuesta-González et al., Citation2020; Matsuyama, Citation2000; Rehman et al., Citation2008), inequality-narrowing (Galor & Zeira, Citation1993; Banerjee & Newman, Citation1993; Beck et al., Citation2007; Sehrawat and Giri, 2016; De Haan and Sturm, 2017) and inequality-widening (Mookherjee & Ray, Citation2003; Hamori & Hashiguchi, Citation2012; Altunbaş & John Thornton, Citation2019; Özcan, 2020)
Hassan and Meyer (Citation2020) studied the nonlinear impact of the finance-inequality nexus in South Africa over the period 1970–2018 using the ARDL bounds testing technique. Their discovery contradicts the G-J hypothesis, but confirms our belief in a U-shaped relationship between these variables.
Recently, Séraphin and Cyrille (Citation2022) studied the impact of financial development on income inequality in the Ivory Coast over the period 1986–2016. The findings revealed that the G-J curve does not hold for the Ivory Coast, as the findings found the financial development to be inequality narrowing (Galor & Zeira, Citation1993; Banerjee & Newman, Citation1993; Mookherjee & Ray, Citation2003; Beck et al., Citation2007; Sehrawat and Giri, 2016; De Haan and Sturm, 2017). The argument was taken further by Mbona (Citation2022), who has done the same study in a panel of 120 countries using the GMM, covering the period 2004 to 2019. Their findings conveyed two measures of findings, as they documented that increased access to financial services reduces income inequality in both linear and nonlinear models. While financial-sector depth narrows income inequality in the linear model, the nonlinear model reveals that the too-much-finance hypothesis holds, as the results confirm a U-shaped relationship with income inequality.
2.2.2. Effects of conventional monetary policy on inequality
According to the existing empirical literature on the distributional impact of conventional monetary policy (CMP), an unexpected increase in interest rates increases income inequality. Romer and Romer (Citation1999), the first study to look into the impact of the CMP on poverty, found that an expansionary monetary policy temporarily alleviates poverty, but only through low inflation and stable output. Mumtaz and Theophilopoulou (Citation2017) used the SVAR model to study the subject matter for the United Kingdom from 1969 to 2012. Their discovery demonstrates that contractionary monetary policy shocks increase earnings, income, and consumption inequality and contribute to its fluctuation. They point out a policy of quantitative easing as one of the contributors to the increasing inequality during the Great Recession. Furceri et al. (Citation2018) supported their findings by studying the same topic in a panel of 32 advanced and emerging economies from 1990–2013. In their approach, they altered short-term interest rates in response to unexpected changes in growth and inflation news. El Herradi and Leroy (Citation2019) used data from 12 advanced economies between 1920 and 2015 and the Panel VAR approach to provide additional support to existing studies that believe CMP improves income. Apanisile (Citation2021) documented contradictory results in the case of Nigeria, where they used the Dynamic Stochastic General Equilibrium approach to study the expected and unexpected shock of conventional monetary policy on income inequality. The findings show that both anticipated and unanticipated shocks have the same effect on income inequality, namely to reduce income inequality in the country.
2.2.3. Effects of unconventional monetary policy on inequality
After reviewing the empirical literature on the subject, we discovered that the distribution mechanisms of a UMP are even more intricate. Rather than interest rates, the UMP is determined by the size of the central bank’s balance sheet. These types of policies frequently inflate the prices of financial assets, which are typically held by the wealthy rather than the poor, potentially increasing inequality. The existing literature on this topic is diverse. Some studies establish that the UMP is the main determinant of income and wealth inequality (Davtyan, Citation2016; Evgenidis & Apostolos Fasianos, Citation2021; Israel & Latsos, Citation2019; Rupprecht, Citation2020), while others find it to have a distributional effect (Casiraghi et al., Citation2018; Guerello, Citation2018; Lenza and Slacalek, Citation2019). Furthermore, we have found that the literature has created two strands, indicating that UMP impacts income and wealth inequality through different channels. The first strand, formed by a group of studies, argues that accommodative UMP helps to establish a more equitable income distribution through the savings redistribution and earnings heterogeneity channels (Heathcote et al., Citation2010; Casiraghi et al., Citation2018; Guerello, Citation2018; Lenza and Slacalek, Citation2019), while the second strand believes that these policies will increase income and wealth inequality via the portfolio, income-composition and financial segmentation channels (Albert et al., Citation2019; Amaral, Citation2017; Mumtaz & Theophilopoulou, Citation2017; Taghizadeh-Hesary et al., Citation2018). These strands have produced contradictory results, with the first believing in a negative paradigm and the second believing in a positive paradigm.
3. Research methods and data adopted for this study
This study adopted data covering the period from 1990–2019. However, as the study aimed to investigate the non-linear dynamics of financial inequality in an unconventional monetary policy regime in African countries, a conventional monetary policy regime (1990–1999) and an unconventional monetary policy regime (2000–2019) were adopted. The time period of our data is divided following the adoption of the UMP. We define the period of the prudential policy regime as starting from 2000 onwards, based on the availability of data, while from 1999 backwards it is classified as the period of the non-prudential policy regime. Variables that were suggested in the literature as explaining the relationship between economic development and income inequality were utilized. The Gini coefficient was used as a proxy for income inequality (GINI) and private credit, which is a claim against the private sector by financial intermediaries, as a proxy for financial development (FD). We then controlled for unconventional monetary policy instances by including three channels: earning heterogeneity, income composition, and portfolio composition channels. To capture the earning heterogeneity, the study adopted the unemployment rate (UNMPUN), while the equity index (EQUIUNC) was used to capture the income composition channel. For the portfolio composition channel, we adopted the house price index (HPIUNC) following Alves and Silva (Citation2020), as it was confirmed in the literature to be the significant variable in understanding the interaction between monetary policy and income inequality. For most households, real estate accounts for a significant part of their portfolio, mainly low-income households that own their own house. However, from an aggregate perspective, portfolio rebalancing can occur only if there is an additional supply of risky securities. Therefore, controlling such a factor (i.e. newly-issued securities) is significant for this study. However, based on data availability, the author adopted the house price index to capture the portfolio composition channel. We further included fiscal policy instances through government expenditure (GE) (captured by government spending as a percentage of GDP) in our model with the aim of capturing the impact of these instruments on income inequality, given the fact that the government is used as a tool to trigger output, which then leads to high growth and high employment while simultaneously decreasing inequality. Based on the argument of production, investment (GGFCE) is included because increased capital investment requires some goods to be produced that are not immediately consumed, but instead are used to produce other goods, such as capital goods that lead to an increase in economic growth, which will then decrease inequality. Lastly, real GDP per capita as a proxy of economic development (ECO), trade openness (OPEN) and inflation (INFL) was included as well in the model. For the robustness model, we adopted domestic credit to the private sector as a share of GDP to measure financial development (FDD; Rajan & Zingales, Citation2003b). The variables were extracted from SWIID (Solt, Citation2020) and World Development Indicators (Citation2021). The unit-root test was not appropriate for this study as it deals with monotonic data and does not require integration or cointegration. The analysis of these studies was carried out using R-studio, Version 4.0.5.
3.1. Panel smooth transition regression (PSTR) model
To examine the non-linear effect of the finance-inequality relationship, the PSTR model developed by González et al. (Citation2017) was used. The simplest case of the PSTR model, with two extreme regimes in a single transition function for illustrating the threshold effect of financial development () on income inequality (
is the following:
where indicate a cross-section and the time dimensions of the panel, respectively. Whereas,
and
imply the fixed individual and time effects, correspondingly,
denote the monetary policy instance in the model,
is the vector of control variables, and the errors term are denoted by
. Following González et al. (Citation2017), the transition function in the logistic form
is a continuous function of the transition variable
bounded between 0 and 1 and defined as:
In (3) )’ is an
dimensional vector of threshold parameters, where the slope parameter denoted by
controls the smoothness of the transitions. Moreover,
are restrictions imposed for identification purposes. In practice, for
, there are one or two thresholds of economic development around which their impact on income inequality is nonlinearError! Reference source not found., respectively. This nonlinear impact is represented by a continuum of parameters between the extreme regimes. For
, the transition function has a minimum of
and reaches a value of 1 for both low and high values of
. Therefore, if
tends towards infinity, the model becomes a three-regime threshold model. However, it is reduced to a homogenous or linear fixed-effects panel regression when the transition function becomes constant, i.e., when
tends towards 0.
Before estimating EquationEquation (1)(1)
(1) , González et al. (Citation2005) emphasized the need for a homogeneity or specification test. This test will determine whether the PSTR model is appropriate for assessing the impact of economic development on income inequality. To be more explicit, it allows the researcher to choose between using a linear model and a non-linear model to estimate EquationEquation (1)
(1)
(1) . Finally, we evaluate the correlation between financial development and income inequality using the Difference Generalized Method of Moments (Difference GMM; Arellano & Bond, Citation1991; Blundell & Bond, Citation1998). We adopted the Difference GMM because we wanted to remove the problem of the individual effect. In these techniques, we generated the squared term of financial development to capture the non-linear form of finance inequality in African economies. The dependent variable is further included in the GMM estimator as a lagged explanatory variable. This estimation approach is utilized since the financial development variable has an endogeneity problem, as the expansion of income inequality may have an effect on the level of financial growth. Furthermore, for some of our control variables, the idea of double causation cannot be ruled out. Finally, the GMM estimator has two types of instruments: the external instrument and the internal instrument. It has been argued in the literature that internal instruments are recommended for the GMM system, compared to external instruments. This is because choosing an external instrument for the GMM is the most difficult part of the estimation. The internal instruments are instruments for the data the researcher is working with, such as the lagged values of the regressors. We took advantage of the ability to build instruments internally for the current study. Endogenous variables were, therefore, instrumented by their lagged values. In a nutshell, this means that the instrument of this analysis must come from within. We also estimated EquationEquation (3)
(3)
(3) , which, in order to account for nonlinearity, includes interaction terms:
EquationEquation (3)(3)
(3) incorporates an interaction with a quadratic component to evaluate the non-linear influence of the transition variable, which is financial development. With the addition of an interaction term, it is possible to see if the marginal effect of financial development differs at greater levels of this variable. The other variables of EquationEquation (3)
(3)
(3) are defined as in EquationEquation (1)
(1)
(1) .
We extended EquationEquation (3)(3)
(3) into a dynamic model by introducing a lagged term of income inequality based on the static model to avoid biased estimates due to the omission of other important explanatory variables, as shown in EquationEquation (4)
(4)
(4) . In this study, the dynamic panel models are estimated using differential GMM:
4. Empirical results of the study
The descriptive statistics for the various variables are provided in the Appendix (). Before estimating the PSTR model, the PSTR goes through three stages: finding the appropriate transition variable among all the candidate variables; testing the linearity; and finding the sequence for selecting the order m of the transition function using the LM-type test, with the proposed WCB and WB serving as robustness checks. The outcomes of the three steps are provided individually in the following sections.
Table 1. Results of the linearity test
4.1. The results of the transition variable, homogeneity test and selection of the order m of the PSTR
In our model, we included all variables (FD, EQUIUNC, UNMPUNC, HPIUNC, GGFCE, OPEN, GE, ECO, and INFL) as candidates in identifying the appropriate transition variable following González et al. (Citation2017). The result is presented in for all the stages of the PSTR. The first section of shows the results of the appropriate transition in the panel regression of financial development and income inequality. The results show that both the p-values of the -test (4.896e-17) and
-test (2.998e-8) signify DF as the most suitable choice of transition variable for this study, as the p-values are smaller compared to other included candidate variables.
The results of the homogeneity test are then reported in the second section of Table I. The author generates the F-statistics and p-values of both (5.798e-34) and
(2.768e-07) to test the null hypothesis of linearity, while the proposed WCB (0.00) and WB (0.00) are robustness checks. Both the p-values of
and
indicate the rejection of the null hypothesis of linearity, confirming that there is indeed nonlinearity between financial development and income inequality in selected African countries. This was further supported by WB and WCB, signifying that nonlinearity remains between financial development and income inequality. The homogeneity results support studies documented by Koçak and Uzay (Citation2019), Nguyen et al. (Citation2019), Adams and Klobodu (Citation2019), Cihak and Sahay (Citation2020), De la Cuesta-González et al. (Citation2020), Destek et al. (Citation2020), Hassan and Meyer (Citation2020), and Bolarinwa and Akinlo (Citation2021).
Lastly, the third section of Table reports the results of the sequence for choosing order in PSTR.Footnote1 The results reject
as the p-value of both the
and
when
indicating that, when
is selected as best transition variable, the model has one regime which separates the low level from the high level of financial development. This concludes that the model has two regimes with one transition, and rejects m = 2;
and m = 3;
. Conversely, the results of the
and
were evaluated using the WCB and WB, in the following section following Teräsvirta (Citation1994).
4.2. Model evaluation and the estimated threshold of the PSTR model
This section reports the results of the model evaluation and the estimated threshold of the PSTR. After estimating the baseline model, following Eitrheim and Teräsvirta (Citation1996), we first evaluated the reliability of selecting the order as the best transition variable for this model, using two classes of the misspecification tests: Parameter Constancy (PC) and No Remaining Nonlinearity (NRN; González et al., Citation2017). presents the results of the PC, NRN, and the estimated threshold. The first section of reports the results of the PC. The p-value of the
and
for parameter constancy show that the parameters are constant, while the second section of shows the results of both the WB and WCB tests that take heteroskedasticity as well as possible within-cluster dependence into account, suggesting that the estimated model with one transition is adequate. Lastly, the third section of contains the results of the estimated threshold for the baseline and robustness model.
Table 2. Results of the linearity test
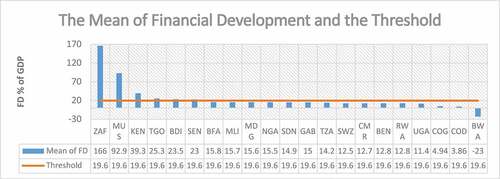
The results show that the estimated financial development threshold is 21.90% of GDP in the unconventional monetary policy regime, while in the conventional monetary policy regime it is 15.30% of GDP; and for the robustness model it is 20.13% of GDP. Hence, the first regime, i.e. when the level of financial development is below the value of 21.90% as a share of GDP, reduces the level of inequality. However, when financial development is above the threshold of between 20% and 21% as a share of GDP, it increases income inequality. The mean of domestic credit to the private sector (FD) was calculated to get a clear picture of which countries are at the lower/higher end of the Greenwood and Jovanovic hypothesis of financial development and economic growth
illustrates that African countries, with the exception of South Africa, Mauritius and Kenya, are at the lower end of financial development. These three countries are found to have a mean of FD (147%, 91%, and 35%, respectively) (2000–2019). There are various dynamics that may cause these countries to be at the lower end of the Greenwood and Jovanovic curve, such as high levels of unemployment or inequality, as Zungu and Greyling (Citation2021). Another factor that could be considered is the implementation of policies that do not benefit the people in terms of improving their standard of living. Per-capita income has been shown to be a good predictor of an institution’s overall development and complexity.
Figure 1. The mean private credit, which is a claim against the private sector by financial intermediaries and the estimated threshold. Note: The value of private credit is expressed as a percentage. Source: Author’s calculation based on WDI (2022) data.
4.3. Empirical results of the PSTR
The results of the baseline model rely on the PSTR, which is a lag of a two-regimes model as well as the GMM with one lag in supporting the PSTR model as reported in . There is a contradiction in the results reported from Model I, the unconventional monetary policy regime, with the results reported in Model II, the conventional monetary policy regime. The results of the baseline model (PSTR) in model I indicate that financial development reduces income inequality, measured by , and it is significant, while in model II it shows that financial development increases inequality. Furthermore, the finding is supported by the results of the S-GMM. A strong nonlinearity is reported between the two variables, as the results in confirm the homogeneity between the variables by rejecting the hull hypothesis of linearity. Therefore, the results of the homogeneity test allow the estimation of the study to generate the coefficient (
) that captures the nonlinear component, which is found to be positive and highly significant during the period of UMP, is negative and statistically significant in the period of CMP. This is further supported by the results of the GMM model.
Table 3. Panel smooth transition regression model estimation
, as the financial development variable varies from low to high. The change between these extreme regimes occurs around the associated endogenous location parameter
. When comparing the conventional policy regime with the unconventional policy regime across all the estimation tools, the authors find that the financial-inequality relationship is triggered by the unconventional monetary policy as the impact is dissimilar. The magnitude coefficient of DF in the unconventional policy regime when the financial system starts to develop has a massive impact compared to its impact on the conventional monetary policy regime. When financial development is far above the threshold, however, the FD still has a massive impact on the common man in the unconventional policy regime period when compared to the conventional policy regime period. Focusing on our model of interest, the magnitude below the threshold is 5.11 and 2.02, while it is 2.50 and 1.40 above the threshold, respectively. The findings of this study emerged with a strong contribution to the existing literature, as this is the first study to attempt to understand the nonlinear dynamic impact of financial development on income inequality in common subjects in the unconventional monetary policy regime, and further try to understand how this policy framework triggered the subject matter. The results show that integrating these policies into both regimes may cause the level of income inequality to improve. This finding is consistent with previous empirical studies that demonstrated a substantial positive and negative effect of financial development on income inequality, such as Brei et al. (Citation2018), Cihak and Sahay (Citation2020), De la Cuesta-González et al. (Citation2020), and Mbona (Citation2022). The findings contradict those that documented the existence of the G-J hypothesis (Ang, Citation2010; Kim & Lin, Citation2011; Tan & Law, Citation2012; Park & Shin, Citation2017; Younsi and Bechtini, Citation2018; Brei et al., Citation2018; Nguyen et al., Citation2019; Martin & Sahay, Citation2020; Alves & Silva, Citation2020).
The possible logic behind the negative relationships between financial development and income inequality in African countries could be financial market imperfections resulting in limited competition and restrictive access. The empirical finding shows that the more finance access improves, the more it narrows the level of income, up until it reaches the optimal point, estimated at 21.90 % of GDP, since inequality narrowing is believed to open doors for the poor to get access to financial services. The concept is that the impact accrues in the presence of an imperfect credit-market, as well as indivisibilities in human capital (investment). Thus, an improvement in the credit market, due to an expansion in the number of agents in the economy, unlocks more funds to invest in human capital. Hence, an increase in capital investment automatically reduces the level of income inequality. The possible logic behind the positive impact beyond the optimal level is based on the concept of the inequality-widening hypothesis. The concept is that as finance improves, going beyond a certain threshold (21.90 as a percentage of GDP), it widens inequality discrepancies by benefiting the rich at the expense of the poor. This happens when institutions are feeble and financial systems channel money to the upper class, as well as to those who are well-connected, who will be able to offer collateral and who will, in all probability, repay the loan. Thus, as the financial sector progresses, the poor will be neglected with regard to loans because they are unable to provide collateral, and then the upper class will continue to benefit from the financial sector. The development of the financial sector is also unable to stop the migration of the poor from rural to urban areas. Furthermore, it is unable to support the poor in starting new businesses and investing in education. The current propensity might be reinforced if the rich are able to prevent new firms from getting access to finance.
Following Zungu and Greyling (Citation2022), we included the unconventional monetary policy channels in our financial-inequality system to find out how these channels have impacted the common man in African countries. The results show that all channels: earnings heterogeneity (unemployment rate (UNMPUN)), income composition (equity index (EQUIUNC)), and portfolio composition (house price index (HPIUNC)) contribute to high income inequality in both regimes. These results were further supported by the GMM estimates. The economic intuition behind the positive impact of UMP, through earning heterogeneity on income inequality, could reflect that unemployment appears to be the most important cause of increased earnings, as a contractionary monetary policy of increases in official interest rates leads to an increase in unemployment which then pushes up income inequality. These results support the results reported by Hohberger et al. (Citation2020) for the Euro Area, and Zungu and Greyling (Citation2022) for emerging markets. The possible reason for the positive impact of the UMP on income inequality through the portfolio composition channel is that this channel is related to the fact that a fall in interest rates impacts households’ asset holdings. Low-income households have more cash to satisfy their daily obligations than high-income households, who may save far more. In this situation the UMP, through the portfolio channel, may raise inequality as financial assets rise. Furthermore, our findings support the findings reported by Domanski et al. (Citation2016) for some countries in the Eurozone, and Dolado et al. (Citation2021) for the US.
The fiscal instance, through government expenditure (GE) by means of unconventional policy, has a statistically significant impact, showing that below the threshold of FD it decreases inequality, while in the high regime beyond the threshold it improves inequality. Even the estimates of the GM support the positive effect of government expenditure on income inequality. The results are in line with the finding reported by Sidek (Citation2021) in a panel of 122 countries with 91 and 31 countries categorized as developing and developed countries.
Investment (GGFCE) has a statistically positive impact on income inequality in both regimes of financial development. However, in the high regime it becomes statistically insignificant. The findings support the argument made by Ryo et al. (Citation2005) and Zungu et al. (Citation2020) that a shift relies on capital-intensive technology, with the aim of increasing production due to an increase in the level of financial infrastructure, pushing up the level of income inequality. Trade openness (OPEN) has a statistically negative impact on income inequality in the low regime of financial development, while in the high regime it is positive and statistically insignificant. The logic behind this is that trade openness in emerging and developing economies tends to benefit the relative income shares of the very poor, but not necessarily all the poor. Trade openness increased income inequality in most advanced economies, with outliers driving the effect. The results are in line with the findings documented by Fukuda (Citation2017) and Dorn et al. (Citation2021).
Economic development captured by GDP per capita (GDPPC) has a statistically negative impact on income inequality in the low regime of financial development, while in the high regime it has a positive impact. The logic behind this is well explained in the studies documented by Wahiba and Weriemmi (Citation2014), Jauch and Watzka (Citation2016), and Zungu et al. (Citation2022). In their paper, they further stress that there is a critical argument behind whether government expenditure plays a major role in decreasing/increasing income inequality: as they point out, the study by Tanzi (Citation1974) argues that government expenditure not only may do nothing towards reducing income inequality, but may even worsen it (Zungu & Greyling, Citation2021). Finally, inflation (INFL) has a positive and statistically significant impact on income inequality in high regimes, but in the low regime below the threshold, it becomes statistically insignificant. The argument is that upper-class households have more access to financial instruments that can hedge their exposure to inflation, while the poor have limited access to such instruments and instead hold more cash (Erosa & Ventura, Citation2002; Hamori & Hashiguchi, Citation2012). Similar conclusions were drawn by Chen and Kinkyo (Citation2016).
4.4. Robustness check and sensitivity analysis
Figure in Section 4.2, shows that South Africa and Mauritius are the countries with a high mean in financial development compared to all other countries included in the system. This may sometimes raise the issue of outliers in the model. We then decided to remove these two countries from our model for robustness and sensitivity. Again, we decided to adopt the domestic credit to the private sector as a share of GDP to measure financial development, since this variable is probably the most important banking development measure, because it reflects the extent to which firms have the opportunity to obtain bank finance. According to Rajan and Zingales (2003b), private credit has the information on where entrepreneurs or companies with sound projects can obtain finance. The main aim of adopting this variable is to trace whether financial inequality depends on the variable used to measure financial development. The variables have the same definition as defined in the baseline methodology. For our difference GMM, we set the number of lags to one for yearly differences in our yearly data, and we further cut our time period to start from 2003–2019 in order to comply with the conditions of the GMM that should not be greater than
. In this section, we offer further evidence of the robustness of these results. The results of the robustness checks are reported in for all the adopted models in the main methodology. Again, all the testing procedures for these models were followed.
Table 4. Finance-Inequality: robustness and sensitivity checks model
We also checked the sensitivity of our findings against the mean by removing two countries that were found to have a high mean of private credit, which is a claim against the private sector by financial intermediaries. This helps us find out whether the results reported in the baseline methodology were sensitive to the countries included and whether they were further affected by countries with a high mean of private credit. The estimation results demonstrated that the non-linear effect of financial development on income inequality was not sensitive to the financial development measurement and countries included in the model. Indeed, the findings were very similar to those initially obtained.
5. Conclusion and policy recommendations
The theoretical and empirical literature is marked by a controversy surrounding the relationship between financial development and income inequality. This paper aims to overcome these inconclusive results by examining this subject, focusing on the unconventional monetary policy period and comparing it to the conventional monetary period in African economies—in a nutshell, we aim to examine whether there is a role played by these policy frameworks in the finance-inequality relationship in African countries. This study estimated the panel data using panel smooth transition regression and the system generalise method of moments, to investigate the impact of financial development on income inequality in the adopted countries.
The estimation results strongly support the presence of nonlinearities in the relationship between financial development and income inequality in Africa. Our findings show that, in the case of African economies, there are two extreme regimes where financial development has a different impact on income inequality, depending on the level of financial development.
First, below the threshold of 21.90% as a share of GDP, a low level of financial development is found to be income distributive due to financial market imperfections and indivisibilities in human capital (investment), resulting in limited competition and restrictive access, which then opens doors for the poor to get access to financial services. Second, above the estimated threshold, the high level of financial development is found to improve income inequality. This is driven by the fact that when the level of finance is high, it benefits the rich at the expense of the poor. This happens when institutions are feeble and financial systems channel money to the upper class, as well as to those who are well-connected, who will be able to offer collateral and who will, in all probability, repay the loan. These findings were found to be not sensitive to the methodology used and control variables adopted, as we obtained the same results using the GMM estimator methods, even if we removed South Africa and Mauritius from the system.
However, for the conventional monetary policy regime, we reported different results compared to those reported for the unconventional policy regime. Thirdly, these results show that the unconventional monetary policy triggered the financial inequality system. This is further supported by the coefficient sign of the included measures of unconventional monetary policy channels.
We further document that an increase in investment increases the level of income inequality in both policy regimes (the unconventional and conventional monetary policy regimes). This could reflect the fact that a shift relies on capital-intensive technology with the aim of increasing production due to an increase in the level of financial infrastructure, pushing up the level of income inequality. Government expenditure, trade openness and economic development were found to be income distribution below the threshold, but income-improving beyond the threshold. Inflation was found to be inequality-improving during the unconventional policy regime, but inequality-narrowing during the conventional policy regime. From a policy standpoint, our findings have a variety of policy implications. Firstly, the presence of a financial development threshold calls into question the efficacy of distribution policies and financial development with regard to reducing inequality. Secondly, countries that are just below the threshold value are encouraged to work on policies that promote financial inclusion and branch financial development in order to mobilize more funds, projects, and resources with the best chance of maximization, thereby supporting economic growth and economic development and reducing income inequality and poverty. Thirdly, our findings alert the reserve bank to the fact that the unconventional policy program seems to achieve its mission at the expense of income inequality. We propose that future research investigates financial inclusion in the system, and also covers the current problem that has arisen between the unconventional monetary policy regime and the conventional monetary policy regime. This will be a significant contribution. Further research will also necessitate the use of a different variables to measure income inequality. New studies will need to include variables that aim to control government effectiveness. The study’s limitations evolved into the issue of data availability as well as the inclusion of financial inclusion variables.
Disclosure statement
No potential conflict of interest was reported by the author(s).
Data availability statement
Publicly available datasets were analysed in this study. This data can be found here: [http://data.worldbank.org/data-catalog/world-development-indicators (accessed on 2 October 2022)]. Further inquiries can be directed to the corresponding author.
Notes
1. The sequence for selecting the order of the transition function under the
for selection
. If it is rejected, it will continue to test
and
, in selection
. If it still fails,
will be selected as default (Teräsvirta, Citation1994).
References
- Adams, S., & Klobodu, E. K. M. (2019). Financial development and income inequality in South Africa. In E. F. Wamboye & P. J. Nyaronga (Eds.), The service sector and economic development in Africa (pp. 48–20). Routledge.
- Albert, J., Gómez-Fernández, N., & Ochando, C. (2019). Effects of unconventional monetary policy on income and wealth distribution: Evidence from United States and Eurozone. Panoeconomicus, 66(5), 535–558. https://doi.org/10.2298/PAN161208007M
- Altunbaş, Y., & John Thornton, J. (2019). The impact of financial development on income inequality: A quantile regression approach. Economics Letters, 175, 51–56. https://doi.org/10.1016/j.econlet.2018.12.030
- Alves, J., & Silva, T. (2020). An empirical assessment of monetary policy channels on income and wealth disparities”, REM Working Paper 0144-2020, de Lisboa. Available online: https://econpapers.repec.org/paper/iseremwps/wp01442020.htm (accessed on 24 February 2022)
- Amaral, P. (2017). Monetary policy and inequality. Economic Commentary, (1), Retrieved from Federal Reserve Bank of Cleveland Economic Commentary. Cleveland.
- Ang, J. B. (2010). Finance and inequality: The case of India. Southern Economic Journal, 76(3), 38–761. https://doi.org/10.4284/sej.2010.76.3.738
- Apanisile, O. T. (2021). Monetary policy shocks and income inequality in Nigeria: Do effects of anticipated and unanticipated shocks differ? African Journal of Economic Review, 9, 1–18. https://doi.org/10.22004/ag.econ.315787
- Arellano, M., & Bond, S. (1991). Some tests of specification for panel data: Monte carlo evidence and an application to employment equations. Review of Economic Studies, 58(2), 277–297. https://doi.org/10.2307/2297968
- Asongu, S. A. (2011). Finance and inequality: Exploring pro-poor investment channels in Africa. Munich Personal RePEc Archive working paper, HEC-Management School, University of Liège, 25 November.
- Banerjee, A., & Newman, A. F. (1993). Occupational choice and the process of development. Journal of Political Economy, 101(2), 274–298. https://doi.org/10.1086/261876
- Batuo, M. E., Guidi, F., & Mlambo, K. (2010). Financial development and income inequality, evidence from Africa Countries. Munich Personal RePEc Archive working paper, University of East London, 11 August.
- Beck, T., Demirguc-Kunt, A., & Levine, R. (2007). Finance, inequality and the poor. Journal of Economic Growth, 12(1), 27–49. https://doi.org/10.1007/s10887-007-9010-6
- Blundell, R., & Bond, S. (1998). Initial conditions and moment restrictions in dynamic panel data models. Journal of Econometrics, 87(1), 115–143. https://doi.org/10.1016/S0304-4076(98)00009-8
- Bolarinwa, S. T., & Akinlo, A. E. (2021). Is there a nonlinear relationship between financial development and income inequality in Africa? Evidence from dynamic panel threshold. The Journal of Economic Asymmetries, 24, e00226. https://doi.org/10.1016/j.jeca.2021.e00226
- Brei, M., Giovanni, F., & Gambacorta, L. (2018). Financial structure and income inequality. In BIS working papers (Vol. 756). Bank for International Settlements.
- Casiraghi, M., Gaiotti, E., Rodano, L., & Secchi, A. (2018). A ‘reverse Robin Hood’? The distributional implications of non-standard monetary policy for Italian households. Journal of International Money and Finance, 85, 215–235. https://doi.org/10.1016/j.jimonfin.2017.11.006
- Chen, W., & Kinkyo, T. (2016). Financial development and income inequality: Long-run relationship and short-run heterogeneity. Emerging Markets Finance and Trade, 52(3), 733–742. https://doi.org/10.1080/1540496X.2016.1116281
- Cihak, M., & Sahay, R. (2020). Finance and Inequality. International Monetary Fund (IMF) Discussion Note, SDN/20/0, Availableonline: https://www.imf.org/en/Publications/Staff-Discussion-Notes/Issues/2020/01/16/Finance-and-Inequality-45129 (accessed on 02 October 2022)
- Davtyan, K. (2016). Income inequality and monetary policy: An analysis of the long run relation. Research Institute of Applied Economics, 4, 1–37.
- De Gregorio, J. (1996). Borrowing constraints, human capital accumulation and growth. Journal of Monetary Economics, 37(1), 49–71. https://doi.org/10.1016/0304-3932(95)01234-6
- De la Cuesta-González, M., Ruza, C., & Rodríguez-Fernández, J. M. (2020). Rethinking the income inequality and financial development nexus. a study of nine OECD countries. Sustainability, 1(13), 5449. https://doi.org/10.3390/su12135449
- Destek, M. A., Sinha, A., & Sarkodie, S. A. (2020). The relationship between financial development and income inequality in Turkey. Journal of Economic Structures, 9(1). https://doi.org/10.1186/s40008-020-0187-6
- Dolado, J. J., Motyovszki, G. O., & Pappa, E. (2021). Monetary policy and inequality under labor market frictions and capital-skill complementarity. American Economic Journal: Macroeconomics, 13, 292–332.
- Domanski, D., Scatigna, M., & Zabai, A. (2016). Wealth inequality and monetary policy. BIS Quarterly Review. Availableonline: https://papers.ssrn.com/sol3/papers.cfm?Abstract_id=2744862 (accessed on 02 October 2022)
- Dorn, F., Fuest, C., & Potrafke, N. (2021). Trade openness and income inequality: New empirical evidence. Economic Inquiry, 60(1), 202–223. https://doi.org/10.1111/ecin.13018
- Eitrheim, Ø., & Teräsvirta, T. (1996). Testing the adequacy of smooth transition autoregressive models. Journal of Econometrics, 74(1), 59–75. https://doi.org/10.1016/0304-4076(95)01751-8
- El Herradi, M., & Leroy, A. (2019). Monetary policy and the top one percent: Evidence from a century of modern economic history. De Nederlandsche Bank Working Paper No, 632, http://dx.doi.org/10.2139/ssrn.3379740.
- Erosa, A., & Ventura, G. (2002). On inflation as a regressive consumption tax. Journal of Monetary Economics, 49(4), 761‐95. https://doi.org/10.1016/S0304-3932(02)00115-0
- Evgenidis, A., & Apostolos Fasianos, A. (2021). Unconventional monetary policy and wealth inequalities in Great Britain. Oxford Bulletin of Economics and Statistics, 83(1), 115–175. https://doi.org/10.1111/obes.12397
- Fukuda, T. (2017). The relationship between financial development and income inequality in India: Evidence from VARX and ARDL assessments. Asian Economic and Financial Review, 7(10), 1014–1027. https://doi.org/10.18488/journal.aefr.2017.710.1014.1027
- Furceri, D., Loungani, P., & Zdzienicka, A. (2018). The effects of monetary policy shocks on inequality. Journal of International Money and Finance, 85, 68–86. https://doi.org/10.1016/j.jimonfin.2017.11.004
- Galor, O., & Zeira, J. (1993). Income distribution and macroeconomics. The Review of Economic Studies, 60(1), 35–52. https://doi.org/10.2307/2297811
- González, A., Ter€asvirta, T., van Dijk, D., & Yang, Y. (2017). Panel smooth transition regression models. CREATES Research Paper No. 2017-36, Department of Economics and Business Economics, Aarhus University, Denmark.
- González, A., Teräsvirta, T., & Dijk, D. (2005)1August.Panel smooth transition regression models. In Research paper Quantitative Finance Research Centre, University of technology Sydney.Vol. 165
- Greenwood, J., & Jovanovic, B. (1990). Financial development, growth, and the distribution of income. Journal of Political Economy, 98(5, Part 1), 1076–1107. https://doi.org/10.1086/261720
- Guerello, C. (2018). Conventional and unconventional monetary policy vs. household’s income distribution: An empirical analysis for the Euro area. Journal of International Money and Finance, 85, 187–214. https://doi.org/10.1016/j.jimonfin.2017.11.005
- Hamori, S., & Hashiguchi, Y. (2012). The effect of financial deepening on inequality: Some international evidence. Journal of Asian Economics, 23(4), 353–359. https://doi.org/10.1016/j.asieco.2011.12.001
- Hassan, A. S., & Meyer, D. F. (2020). Financial development – Income inequality nexus in South Africa: A nonlinear analysis. International Journal of Economics and Finance Studies, 12, 335–351.
- Heathcote, J., Perri, F., & Violante, G. L. (2010). Unequal we stand: An empirical analysis of economic inequality in the United States, 1967–2006. Review of Economic Dynamics, 13(1), 15–51. https://doi.org/10.1016/j.red.2009.10.010
- Hohberger, S., Priftis, R., & Vogel, L. (2020). The distributional effects of conventional monetary policy and quantitative easing: Evidence from an estimated DSGE model. Journal of Banking & Finance, 113, 105483. https://doi.org/10.1016/j.jbankfin.2019.01.002
- Israel, K., & Latsos, S.(2019). The impact of (un)conventional expansionary monetary policy on income inequality—lessons from Japan. Working Paper, No. 163. Leipzig: Universität Leipzig, Wirtschaftswissenschaftliche Fakultät
- Jauch, S., & Watzka, S. (2016). Financial development and income inequality: A panel data approach. Empirical Economics, 51(1), 291–314. https://doi.org/10.1007/s00181-015-1008-x
- Jobarteh, M., & Kaya, H. (2019). Revisiting financial development and income inequality nexus for Africa. The African Finance Journal, 21, 1–22.
- Jung, S. M., & Cha, H. E. (2020). Financial development and income inequality: Evidence from China. Journal of the Asia Pacific Economy, 26(1), 73–95. https://doi.org/10.1080/13547860.2020.1717301
- Kim, D.-H., & Lin, S.-C. (2011). Nonlinearity in the financial development-income inequality nexus. Journal of Comparative Economics, 39(3), 310–325. https://doi.org/10.1016/j.jce.2011.07.002
- Koçak, E., & Uzay, N. (2019). The effect of financial development on income inequality in Turkey: An estimate of the greenwood-Jovanovic hypothesis. Review of Economic Perspectives, 19(4), 319–344. https://doi.org/10.2478/revecp-2019-0017
- Kumar, C. (2014). Africa rising? Inequalities and the essential role of fair taxation. Tax justice network Africa, Available online: http://www.taxjusticeafrica.net. Accessed 09/3/2019
- Lenza, M. & Slacalek, J. (2019). How does monetary policy affect income and wealth inequality? Evidence from Quantitative Easing in the Euro Area. ECB Working Paper Series. https://doi.org/10.2866/414435
- Martin, C., & Sahay, R. (2020). Finance and Inequality. International Monetary Fund. IMF Staff Discussion Notes 2020/001.
- Matsuyama, K. (2000). A ricardian model with a continuum of goods under non homothetic preferences: Demand complementarities, income distribution, and north-south trade. Journal of Political Economy, 108(6), 1093–1120. https://doi.org/10.1086/317684
- Mbona, N. (2022). Impacts of overall financial development, access and depth on income inequality. Economies, 10(5), 118. https://doi.org/10.3390/economies10050118
- Mookherjee, D., & Ray, D. (2003). Occupational diversity and endogenous inequality. Munich Personal RePEc Archive working paper, Boston University, 10 February.
- Mumtaz, H., & Theophilopoulou, A. (2017). The impact of monetary policy on inequality in the UK. an empirical analysis. European Economic Review, 98, 410–423. https://doi.org/10.1016/j.euroecorev.2017.07.008
- Nguyen, T. C., Vu, T. N., Vo, D. H., & Ha, D. T. N. (2019). Financial development and income inequality in emerging markets: A new approach. Journal of Risk and Financial Management, 12(4), 173. https://doi.org/10.3390/jrfm12040173
- Özcac, G. (2019). Financial development and income inequality: An empirical analysis on the emerging market economies. Theoretical and Applied Economics, XXVII, 85–96.
- Park, D., & Shin, K. (2017). Economic growth, financial development, and income inequality. Emerging Markets Finance and Trade, 53(12), 2794–2825. https://doi.org/10.1080/1540496X.2017.1333958
- Rajan, R., & Zingales, L. (2003). The great reversals: the politics of financial development in the Twentieth century. Journal of Financial Economics, 69(1), 5–50. https://doi.org/10.1016/S0304-405X(03)00125-9
- Rehman, H. R., Khan, S., & Ahmed, I. (2008). Income distribution, growth and financial development. A cross countries analysis. Pakistan Economic and Social Review, 46, 1–16.
- Roine, J., Vlachos, J., & Waldenström, D. (2009). The long-run determinants of inequality: What can we learn from top income data. Journal of Public Economics, 93(7–8), 974–988. https://doi.org/10.1016/j.jpubeco.2009.04.003
- Romer, C. D., & Romer, D. H. (1999). Monetary policy and the well-being of the poor. Economic Review, 84, 21–49. RePEc:fip:fedker:y:1999:i:qi:p:21-49:n:v.84no.1
- Rupprecht, M. (2020). Income and wealth of euro area households in times of ultra-loose monetary policy: Stylised facts from new national and financial accounts data. Austrian Institute for Economic Research, 47, 281–302. https://doi.org/10.1007/s10663-018-9416-8
- Ryo, H., Ryoji, O., & Kazuhiro, Y. (2005). Finance, technology and inequality in economic development. Munich Personal RePEc Archive working paper, Graduate School of Economics, Tohoku University Kawauch.
- Séraphin, P. Y., & Cyrille, K. K. (2022). Nonlinear effect of financial development on income inequality: The case of Ivory Coast. International Journal of Business and Management, 17.
- Sidek, N. Z. M. (2021). Do government expenditure reduce income inequality: Evidence from developing and developed countries. Studies in Economics and Finance, 38, 487–503.
- Solt, F. (2020). The standardized world income-inequality database. Social Science Quarterly, 90(2), 231–242. https://doi.org/10.1111/j.1540-6237.2009.00614.x
- Taghizadeh-Hesary, F., Yoshino, N., & Shimizu, S. (2018),” The impact of monetary and tax policy on income inequality in Japan.”, ADBI Working Paper 837. Asian Development Bank Institute. Available: https://www.adb.org/publications/impact-monetary-and-tax-policy-income-inequality-japan (16) (PDF) (accessed on 02 October 2022)
- Tan, H., & Law, S. (2012). Nonlinear dynamics of the finance-inequality nexus in developing countries. The Journal of Economic Inequality, 10(4), 551–563. https://doi.org/10.1007/s10888-011-9174-3
- Tanzi, V. (1974). Redistributing income through the budget in Latin America. Banca Nazionale del Lavoro (Rome). Quarterly Review, 26, 65–87. https://doi.org/10.13133/2037-3643/11450
- Teräsvirta, T. (1994). Specification, estimation, and evaluation of smooth transition autoregressive models. Journal of the American Statistical Association, 89, 208–218. https://doi.org/10.1080/01621459.1994.10476462
- Tita, A. F., & Aziakpono, M. J. (2016). Financial development and income inequality in Africa: A panel heterogeneous approach. Economic research South Africa Working Paper, university of Stellenbosch Business School, South Africa.
- Wahiba, N. F., & Weriemmi, M. (2014). The relationship between economic growth and income inequality. International Journal of Economics and Financial Issues, 4, 135–143. RePEc:eco:journ1:2014-01-13
- World Development Indicators. (2021). World Bank., available at: http://data.worldbank.org/data-catalog/world-development-indicators (accessed 05 October 2022)
- Younsi, M & Bechtini, B. (2018). Economic Growth, Financial Development and Income Inequality in BRICS Countries: Evidence from Panel Granger Causality Tests, MPRA Paper No. 85249, Tunisia. https://mpra.ub.uni-muenchen.de/85249/. (accessed on 20 October)
- Younsi, M., & Marwa Bechtini, M. (2020). Economic growth, financial development, and income inequality in brics countries: Does Kuznets’ inverted U-Shaped curve exist? Journal of the Knowledge Economy, 11(2), 721–742. https://doi.org/10.1007/s13132-018-0569-2
- Zungu, L. T., & Greyling, L. (2021). Financial development and income inequality: A nonlinear econometric analysis of 21 African countries, 1994-2015. Economic research South Africa Working Paper, University of Zululand, South Africa.
- Zungu, L. T., & Greyling, L. (2022). Exploring the dynamic shock of unconventional monetary policy channels on income inequality: A panel VAR approach. Social Sciences, 11(8), 369. https://doi.org/10.3390/socsci11080369
- Zungu, L. T., Greyling, L., & Mbatha, N. (2022). Nonlinear dynamics of the development-inequality nexus in emerging countries: The case of a prudential policy regime. Economies, 10(5), 120. https://doi.org/10.3390/economies10050120
- Zungu, L. T., Greyling, L., & Sekome, M. S. (2020). Government expenditure and economic growth: Testing for nonlinear effect among SADC countries, 1994-2017. African Journal of Business and Economic Research, 15(3), 37–69. https://doi.org/10.31920/1750-4562/2020/v15n3a2
