
 ?Mathematical formulae have been encoded as MathML and are displayed in this HTML version using MathJax in order to improve their display. Uncheck the box to turn MathJax off. This feature requires Javascript. Click on a formula to zoom.
Abstract
This paper aimed to examine the determinants of farmland degradation in the West Guji Zone. The study employed data collected in 2020 from a sample of 385 farm households selected using a simple random sampling technique. An ordered probit model was run to examine the association of explanatory variables with the severity of farmland degradation. Farm plot assessment results indicate that most farm plots were categorized as slightly degraded, followed by moderate, non-degraded, and severe degradation statuses. The study indicated that the main causes of farmland degradation were intensive cultivation without fallow, deforestation, high precipitation, overgrazing, steep slopes, and wind. The ordered probit results revealed that age of household heads, number of plots, and slope of the farmland positively and significantly influenced the severity of farmland degradation, while sex of household heads, soil conservation status, family size, education, land-to-labor ratio, and extension contact were negatively and significantly associated with the severity of farmland degradation. Therefore, the study suggests the provision of training to farming households, promotion of cost-effective modern feed resources and homemade biogas, implementation of a participatory management approach, scaling-up existing land management practices, ensuring the sustainability of natural resource use, and a close linkage between farmers and extension agents to minimize farmland degradation.
Public interest statement
Land degradation is posing a critical challenge to humans, the environment, and the economy. Its impacts are severe in Africa, where the vast majority of populations primarily rely on natural resources as means of livelihood. Thus, it is crucial to understand the underlying causes of farmland degradation to design and implement appropriate strategies that offset its impacts. To this effect, this study generated relevant information regarding the state of farmland degradation, the extent to which local farmers are participating to mitigate its impacts, and analyzed the socioeconomic, institutional, and biophysical causes of farmland degradation in the West Guji Zone. The study results are expected to be used by experts of the agricultural and natural resources office to address the problem of land degradation and maintain sustainable agricultural production.
1. Introduction
Land degradation has been a critical challenge for developing countries like Ethiopia. The causes of land degradation are complex and vary from place to place. The major drivers of land degradation are generally grouped into two proximate and underlying causes. The proximate causes are more or less natural factors such as biophysical conditions, topographic and climatic conditions, and inappropriate land management practices, whereas the underlying factors are mostly anthropogenic, which include population growth, land tenure, and other socioeconomic and policy-related factors (Belay et al., Citation2015). Farmland degradation is a global phenomenon that affects human societies at the local level where rural communities closely related to land resources are vulnerable. The main outcome of land degradation is a reduction in agricultural yields. Moreover, it results in biodiversity loss, food, energy security threats, land desertification, and disturbance in the socio-economic systems and human living environments (Salih et al., Citation2017).
Land degradation is rampant in Africa, accounting for 46% of the total land area. Available estimates show that land degradation affects 46% of Africa’s land area with at least 485 million (65%) people affected, which translates to USD 9.3 billion costs per annum. Additional estimates show that 75–80% of the continent’s cultivated area is reportedly degraded, with a loss of 30 to 60 kg of nutrients per hectare per year (AGNES, Citation2020). A global fact also shows adverse impacts of land degradation on productivity. According to Sonneveld et al. (Citation2016), irrespective of the use of fertilizer, yield reduction in Senegal is associated with higher levels of land degradation. Land degradation in terms of soil degradation is a major environmental issue posing a threat to sustainable livelihood in the semi-arid region of Central Myanmar (Tun et al., Citation2015). It also had a direct (soil salinization and acidification, desertification) and indirect (reduction of agricultural output and livestock production, weakened ecosystem services, increased dust and sandstorms, flood and landslides, and accumulation of silt in dams) consequences in China (Delang, Citation2018). Land degradation has been a critical challenge to sustainable development and is responsible for about 27% losses in agricultural profits in Central Asia (Mirzabaev et al., Citation2018). It is also a major challenge for the environment and natural resources leading to a serious threat to agricultural productivity in the mid-hills region of Nepal (Dinesh et al., Citation2021).
Likewise, land degradation is one of the major causes of low and declining agricultural productivity and continuing food insecurity and rural poverty in Ethiopia (Taddese, Citation2018). It had negative impacts on agricultural productivity due to loss of soil nutrients, soil erosion effects, reduction of crop yield, and silting up of reservoirs. This in turn affected the Ethiopian economy. For instance, in Ethiopia, GDP loss from reduced agricultural productivity is estimated at $130 million per year (AGNES, Citation2020). Moreover, cropland productivity loss of 0.5 to 1% per year was estimated suggesting a productivity loss of at least 20% over the last 40 years compared with a situation without soil degradation (Scherr & Yadav, Citation1996). Besides, environmental decline due to land degradation adversely affects the health, well-being, and livelihood opportunities of individuals (Abiye, Citation2019).
The key drivers of land degradation in Ethiopia in general in Oromia, in particular, are similar to that of a global scale which includes high demographic growth, weak incentive policy, poor legal and institutional frameworks, limited availability of grazing land, socioeconomic (agriculture), cultural forces, and extensive use of natural resources by the human that increase pressure on the environment, and poor knowledge regarding the environment (Hurni et al., Citation2005; Zamfir et al., Citation2020). There are different types of land degradation such as chemical, physical, and biological. In Ethiopia, particularly in the West Guji Zone, physical land degradation is the most common form of degradation. There is limited information regarding its causes. Besides, the West Guji Zone, where the study area is situated, is one of the degradation-prone areas and it is characterized by low agricultural productivity resulting from erosion and soil quality deterioration (Deresse, Citation2020). Therefore, a detailed analysis of socioeconomic and land-specific characteristics affecting farmland degradation should be carried out to identify its causes and ensure sustainable agricultural productivity, thereby supporting the farm households economically. In this regard, there are limited studies that address farm-level determinants of farmland degradation in the area. A study by Shimeles et al. (Citation2011), Damena (Citation2012), Adinew et al. (Citation2017), Assefa and Sigh (Citation2019), and Ewunetu et al. (Citation2021) heavily focused on part of land management with little emphasis on understanding farm-level causes of farmland degradation.
Moreover, Deresse (Citation2020) addressed only one district and kebele (with a sample size of 84) in his analysis of the causes of farmland degradation using the descriptive method. In terms of coverage, the aforementioned study is not sufficient to design strategies that would help to alleviate the impacts of farmland degradation at the zonal level, and besides, it failed to analyze the extent to which those factors are contributing to farmland degradation to assist different stakeholders in prioritizing important factors. Based on these justifications, this study was designed to generate detailed information regarding the socioeconomic, biophysical, and institutional factors associated with farmland degradation, the state of agro-pastoral farmers’ knowledge of farmland degradation and the degree to which they are participating to overcome the socio-economic and environmental impact of land degradation to point out measures to be taken to reduce the effects of farmland degradation in the face of rapid population growth and growing demand for the cultivation of land in the West Guji Zone. The findings of this study will assist local government to understand the state and causes of land degradation and take appropriate measures to minimize the impacts of land degradation on humans, the environment, and the economy.
2. Literature review
Now a day, land degradation has become an important global priority issue requiring immense attention by individuals, academic communities, governments, and non-governmental organizations because of its adverse impact on agricultural productivity, the environment, food security, and quality of life (Taddese, Citation2018). Besides, it severely affects agriculture, groundwater, nutrition, soil quality, soil organic matter, health conditions, and poverty (Fahad & Wang, Citation2020). Given its nature, land degradation is a complex phenomenon influenced by natural, social, and economic factors (Taddese, Citation2018). Barbier (Citation1997) and Quyet et al. (Citation2014) emphasize that the population growth in developing countries is occurring at an alarming pace, causing an inevitable consequence on cropland for commercial and subsistence agriculture. In their analysis, they emphasized that at the core of the land degradation problem are economic factors. As poor households are found in marginal agricultural areas, the households become stagnant, leaving the poor households with limited financial capital to extract additional resources, exposing them to increased land degradation and the expansion of agricultural activity. To respond to the likely effects of land degradation, poor households with limited holdings often face important labor, land, and cash constraints on their ability to invest in land improvements (Current et al., Citation1995). According to Quyet et al. (Citation2014), farmland degradation is not caused by a single factor, but by an interaction between biophysical and socio-ecological components. Their results indicate that land degradation is not very much due to selected natural variables; however, it occurs mainly due to demographic and economic variables. Moreover, farmland degradation is caused by socioeconomic and physical factors (Leta & Iticha, Citation2018).
Qasim et al. (Citation2011) in their study on socio-economic determinants of land degradation in the Pishin sub-basin in Pakistan, found that land degradation was influenced by factors such as household size, the number of educated male members in the household, frequency of visits of extension workers, security of tenure, access to credit, cropping pattern, and livestock population. Besides the effects of population pressure, the growth in agricultural production had strong and consistent effects on land degradation while the demographic variables affected differently. Fahad and Wang (Citation2018) found that soil fertility loss, water scarcity, changes in crop yields, and crop diseases were the main determinants of climate variability. Leta and Iticha (Citation2018) revealed that variables such as the slope of the farm plot, plot distance from homestead, the interval of crop rotation, frequency of growing cereal crops, and change in farm plot ownership affected farmland degradation, whereas factors such as household responsibility in society, livestock holding size, and soil and water conservation practices negatively influenced farmland degradation.
In Ethiopia, studies related to the socio-economic and biophysical causes of land degradation are scanty. The majority of the studies focused on analyzing the determinants of the adoption of land management practices. For instance, a study conducted in the northwestern part of Ethiopia by Adugna and Bekele (Citation2007) revealed that economic variables such as plot ownership, livestock holding, family size, and land-to-labor ratio influenced on the adoption of land conservation practices. Furthermore, the major socioeconomic factors that influence household’s decisions to adopt soil and water conservation measures in the Ethiopian highlands include the sex and education level of household heads, the availability of labor force, cattle holding, and off/non-farm income (Adimassu and Kessler, Citation2012). On the other hand, biophysical characteristics of plots, topography, and agro-ecological variations also influence the adoption decisions of soil and water conservation and other sustainable land management practices (Miheretu and Yimer, Citation2017). Assefa and Sigh (Citation2019) also found that livestock ownership, farmer’s perception of the profitability of the practices, age of the household head, land tenure security, method of farmland acquisition, farming experience, productive safety net program, relief, and policy support are key determinants of the adoption of sustainable land management practices. Moreover, Shimeles et al. (Citation2011), Damena (Citation2012), Adinew et al. (Citation2017), and Etsay et al. (Citation2019) identified various demographic, socioeconomic, and biophysical factors influencing the adoption of land management practices.
From the reviewed literature, it is possible to conclude that factors explaining both the status and the intensity of land degradation can be summarized as demographic, socioeconomic, biophysical, natural, and institutional factors. There are limited studies that address the causes of land degradation at the farm level. Especially literature related to land degradation in Ethiopia placed a heavy emphasis on identifying factors affecting the adoption of sustainable land management practices with a little focus on household-level determinants of land degradation. Therefore, this paper set out to assess farmers’ perception of farmland degradation and examine the contributing and retarding factors of farmland degradation in the West Guji Zone. Based on the reviewed literature, the conceptual model of the study is depicted below in Figure .
Figure 1. Conceptual framework of the study.Source: Own sketch.
3. Methods and materials
3.1. Research design and sources of the data
The study employed a cross-sectional survey design to assess the effects of biophysical, socio-economic, and institutional factors on the status of farmland degradation in the study area. The primary data was obtained through questionnaires and interviews. Before the data collection, the questionnaire was pre-tested and administered by enumerators, who were selected based on their educational background to evaluate the appropriateness of the design, clarity, and interpretation of the questions, the relevance of the questions, and the time-frame required for an interview. The training was given to the enumerators on methods of data collection, giving prime emphasis to interviewing techniques and the content of the questionnaire. The questionnaire covered different topics to capture relevant information related to the study objectives. A face-to-face interview, in which trained enumerators administered the structured questionnaires, was used to collect primary data.
The data were collected both at the household and plot level (field observation). At the household level, the data related to the socio-economic, the plot character, and institutional factors affecting farmland degradation were collected using a structured questionnaire through interviewing the household heads. Classifying the plot’s status of degradation using information obtained from the interviewed farmers may lead to subjective bias. To eliminate this subjectivity problem the researchers used experts from the natural resource department from the Agricultural and Rural Development Office together with farmers and visited all plots of the respondent to categorize each plot based on the severity/level of farmland degradation. Soil physical indicators were used to determine the status of farmland degradation. These include exposure of permanent matter, the magnitude of stone cover, the presence of sandy type and fragments of stones, the presence of rills within each plot, presence or absence of weeds grown in degraded plots, soil color, type of crop grown, whether the plot produce cereal crops without inorganic fertilizer or not, the presence and the amount of mud at the bottom of each plots, the depth of the plots to its ridges, etc. Finally, the average degradation status aggregated for all plots was considered as judged by the team of experts based on the mentioned physical characteristics.
Secondary data were collected by reviewing documents of secondary sources, namely: the West Guji Zone office of agriculture, rural land administration office, and others. Besides, published and unpublished documents were obtained from thesis, journal articles, and official reports to generate relevant secondary information.
3.2. Sampling techniques and procedures
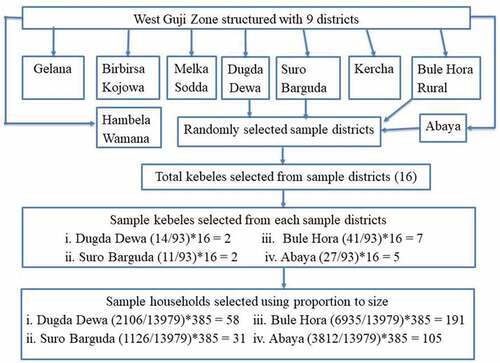
Before sampling households for the interview, discussions were held with the experts in the zonal and district agricultural offices on the condition of soil resources of the study area and the present condition of farmland degradation in the district. A multi-stage sampling technique was used to select sample farmers. In the first stage, out of nine districts of the West Guji Zone, four districts namely Dugda Dewa, Suro Barguda, Bule Hora, and Abaya were selected based on the degree of soil erosion, topographic variation, and other factors affecting farmland degradation. Secondly, a total of 16 sample kebelesFootnote1 were selected randomly from each sample district (2 kebeles from Dugda Dewa, 2 kebeles from Suro Barguda, 7 kebeles from Bule Hora, and 5 kebeles from Abaya). The sampled kebeles were proportionally distributed to the size of the kebeles in each district.
Thirdly, about 385 household heads were selected randomly from each district by accounting for the size distribution of households in the sampling frame. Random sampling is employed at this stage because all households own farmland, and degradation is a common problem for the entire farm in the West Guji Zone. Moreover, simple random sampling gives consistent estimates of the true population. The total sample size in each district was calculated by dividing the number of household heads in the sample kebeles by the total number of household heads in the sample districts and multiplying with the total sample size (385). For instance, the sample size for the Dugda Dawa district was estimated by dividing the total number of household heads in the Dugda Dawa (2,106) by the total number of household heads in the sample districts (13,979) and multiplying it by the total sample size (385). Accordingly, the number of samples drawn from Dugda Dewa, Suro Barguda, Bule Hora, and Abaya districts respectively were 58, 31, 191, and 105. The sample size was determined using a simplified formula provided by Cochran (Citation1977) in EquationEq. (1)(1)
(1) .
Where n designates the desired sample size; Z is the abscissa of a normal curve that cuts off an area α at the tail. In this study, a 95% confidence level was employed and hence, the value of Z equals 1.96. The p represents the estimated proportion of attributes present in the population, and q = 1—p. As explained in Singh and Masuku (Citation2014), the estimate of p and q should equally be fixed to 0.5 where variability in p is unknown. Thus, as there is no information regarding the variability of p from secondary sources in the study area, the researchers fixed the proportion of p and q to 0.5. Accordingly, a total of 385 sample household heads were covered to achieve study objectives. The overall sampling procedures are described as follows in Figure .
Figure 2. Sampling procedure. Source: Own sketch.
3.3. Methods of data analysis
Two types of data analysis, namely descriptive statistics and econometric analysis were used for analyzing the data collected from sample households. Descriptive analysis such as mean, standard deviation, ratio, frequency, and percentages was used to explain and interpret the data. The ordered probit model was employed to examine factors affecting the status of farmland degradation. Because, it accounts for an intrinsic order of response variables compared to other multi-response models like multinomial probit, multinomial logit, and multivariate probit (Teshome et al., Citation2016). In this regard, it is appropriate to employ an ordered probit model as the dependent variable under consideration (i.e. farmland degradation status) involves more than two categories with logical order. Besides, the ordered probit model was compared against the ordered logit model using the log-likelihood ratio test (EquationEq. 2)(2)
(2) . The computation of the likelihood ratio test was conducted using statistical relationships specified in EquationEq. (2)
(2)
(2) . The test result indicated that the null hypothesis that the ordered logit model is a better fit than the ordered probit model is rejected (p > χ2 = 0.7114).
Where, Γ = likelihood ratio statistic; ln = natural logarithm; Loprob and Lolog are likelihood values for ordered probit and ordered logit models respectively, χ2 = Chi-square distribution, and k is the number of explanatory variables. Following Maddala (Citation1999) and Greene (Citation2000), the ordered probit model that is built around a latent variable is given by EquationEq. (3)(3)
(3) .
Yi* is an unobserved latent variable for the level of farmland degradation, X’i represents vectors of explanatory variables affecting farmland degradation status, β is a vector of coefficient of explanatory variables (X’s) that are estimated. The parameter estimates β represent the effect of explanatory variables on the underlying order of status/severity of farmland degradation, ε is the disturbance term that captures excluded explanatory variables by researchers and measurement error. Since Yi* is a latent variable, we observe discrete values of Yi as specified below in EquationEq. (4)(4)
(4) , (Equation5
(5)
(5) ), (Equation6
(6)
(6) ), and (Equation7
(7)
(7) ).
The µ’s are unknown threshold parameters separating the adjacent categories to be estimated with β’s. They show the range of the normal distribution associated with the specific values of the response variable. Y is observed in the number of categories, in this case, farmland degradation statuses (Y = 0, un-degraded; Y = 1, slightly degraded; Y = 2, moderately degraded and Y = 3, severely degraded plot). The probability that the ordered dependent variable (i.e. farmland degradation status) assumes different possible outcomes can be estimated as follows in EquationEq. (8)(8)
(8) , (Equation9
(9)
(9) ), (Equation10
(10)
(10) ), and (Equation11
(11)
(11) ).
The strength of explanatory variables in determining farmland degradation can be measured by examining the variable elasticity that would result from a given percentage change in values of these variables. The computation of the marginal effects (elasticity) is meaningful for the ordered probit model because the estimated parameter coefficients do not represent the magnitudes of the effect of variable X on the intermediate categories of the dependent variable. So the marginal effects of changes in the regressors are estimated as follows as specified in EquationEq. (12)(12)
(12) , (Equation13
(13)
(13) ), (Equation14
(14)
(14) ), and (Equation15
(15)
(15) ).
Where, “” represents the cumulative normal distribution. The effect of each explanatory variable on the probability of land degradation is calculated by keeping the continuous variables at their mean values and the dummy or discrete variables at their most frequent values. Partial effect of X is invariant to the choice of response category j. The likelihood function implies that the estimated β should be the same regardless of which j is of concern. The contrast is always between the probability of belonging to the first up to the Jth category and the probability of belonging to the remaining categories.
The data were checked for specification errors like multicollinearity and heteroscedasticity in estimation procedure. The test of multicollinearity among the explanatory variables was conducted using the Variance Inflation Factor (VIF). The mean value of VIF for all explanatory variables in the regression model was 2.71 suggesting weak collinearity. Moreover, to account for the heteroscedasticity problem in the data, robust estimation was employed.
3.4. Model variables and hypothesis
Table presents the explanatory variables expected to associate with farmland degradation and the hypothesized direction of the association. These variables were identified based on the reviewed literature and existing economic theories.
Table 1. Description of explanatory variables used in the model
4. Results and discussions
4.1. Demographic and socioeconomic characteristics of sample respondents
The results of demographic and socioeconomic characteristics of sample households are presented in Table . The study indicated that the average age of the sample household heads was 42.67 years and it varied between 24 and 80 years. For all income streams in rural Ethiopia, the domestic family is the main source of labor. As observed from the survey result, the average family size of the respondents was 8.24 and it ranged from 3 to 18. This average value of family size is greater than the average family size at the national level of 4.7. The results revealed that the average education level of the sample household heads was 4.48 and it varied between 0 and 13 years of education, indicating that farmers in the study site are still poorly educated on average terms. The mean value of the number of the plots held by farm households is 2.67 plots and varies between 1 and 5 plots, implying that farm households in the study area owned more than two plots. Moreover, the mean values of owned and cultivated lands are 1.74 and 1.5 hectares respectively, indicating that the overall landholding per household varies among the farmers. This implies that due to farmland shortage, which is almost 1.5 hectares per household, there is over-cultivation which brings extensive land degradation. On average, a unit of labor is employed on 1.55 hectares.
Table 2. Socioeconomic characteristics of the respondents
Regarding the market distance from residence, the respondents revealed that they travel an average of 30 minutes (approximately) with corresponding standard deviations of 24.67 walking minutes from home to the place where they sell their product. The minimum and the maximum distance that respondents have to travel to the nearest market centers are 10 and 120 minutes (2 hr), respectively. Besides, they had an average of 20.5 years of farming experience in crop production and livestock rearing and it varied between 12 and 32. Even though the majority of the farmers had a better farming experience, due to farmland and pastureland shortages, the farmers are challenged to use land conservation practices such as fallowing, crop rotation, and private pastures.
The mean value of livestock holdings was 8.29 TLU varying between 0 and 71 tropical livestock units, indicating that farmers who own many livestock might consider their asset base as a mechanism of insuring any risk associated with land degradation. In addition, livestock serves as a source of additional income and food. The survey results also indicated that the average frequency of extension contact of the sampled households was 1.76 per month, with a standard deviation of 1.20 and varying between 1 and 5 per month. The sampled farmers reported that they have been receiving extension contact, especially on technical advice like soil and water conservation practices, land use system, seedling, transplanting, harvesting, spacing, compost preparation, post-harvest handling, storage, and input use like chemical and fertilizer application on different crops.
The sex of the household heads is also the most important factor in affecting farmland degradation due to the existing socioeconomic difference between male-headed and female-headed households. The result revealed that 97.66% of the respondents were male-headed households, whereas 2.34% of the respondents were female-headed, indicating that male-headed households dominate the sampling frame (Table ). Of the total respondents, about 98.44% were married, 1.3% were single, and 0.26% were divorced. Moreover, about 99.48% of total respondents received land management-related training, while the remaining 0.52% of the respondents did not receive land management-related training. This implies that the majority of the farm households have not taken training on land conservation practices in the study area.
Table 3. Summary statistics of categorical variables
Credit is distributed to farmers in the form of the regular and revolving funds with 8% interest rates. The regular loan is mainly used to purchase fertilizer and improved seed with a repayment period of one year, whereas revolving credit is provided for animal fattening, rearing, and purchasing post-harvest technologies. From the total of 385 sample respondents who were asked if they received credit for fertilizer, about 12.76% reported that they had access to agricultural credit. Many farmers are reluctant to use credit for fertilizer, as it is very expensive and their bad perception. However, while some agro- pastoralists had access to credit or utilization, others may not due to religious issues and the lack of an interest-free loan option. The land use pattern of respondents indicates that about 94.03% of the farmlands were used for crop production, whereas the remaining 5.71% and 0.56% were used as grassland and fallow land, respectively. Approximately 81.56% of the farmlands were owned by farmers while 18.44% were rented during the survey year.
Market access is an important means to improve the income of the respondents through the production of more marketable products. The survey results obtained from respondents indicated that 95.84% of total respondents had access to the market while the remaining 4.16% of the sampled households did not have access to the market. The result shows that the majority of the farmers can supply their agricultural products to the nearby market and can purchase agricultural inputs for their crop production.
4.2. Causes of farmland degradation in the West Guji Zone
The survey results in Table indicated that respectively 78.4%, 44.7%, 33.2%, 27.5%, 20%, and 3.5% of the sampled respondents identified intensive cultivation without fallow, deforestation, high and intensive precipitation, overgrazing, steep slopes, and wind as the major reasons of farmland degradation. The cultivation of the steep slopes and marginal land caused by the shortage of cultivated land is the main causes of the removal of vegetation; this is also the major cause of accelerated farmland degradation. On the other hand, respondents in the study area identified removal of the soil (39.5%), soil color changes (45.7%), rills (44.7%), gullies (58.2%), moisture-retaining capacity (31.7%), and plowing problems (70.9%) as perceived indicators of farmland degradation in the area. They also mentioned that the depth and volume of the gullies had increased at a high rate over the last 5 years.
Table 4. Indicators and causes of degradation
4.3. Traditional soil conservation practices
The study shows that farmers in the study area employed indigenous (traditional) methods of soil conservation developed over generations. Based on the survey carried out, different types of traditional soil conservation practices were identified. This includes: traditional stone bund (43.72%), traditional ditches (57.84%), trash lines (61.76%), traditional terracing (51%), manuring (51%), crop rotation (44%), and fallowing (19.2%; Table ). Even though the respondents used different traditional land management practices, still the problem of farmland degradation remains unsolved. This indicates that the traditional methods of soil and water conservation practices did not make ample contribution to reduce the problem of farmland degradation, and traditional systems were employed with no technical specifications, hence much variability in the application is observed. Most types of measures are adapted to cultivated land. Nevertheless, improved land management practices play a considerable role in reducing this problem.
Table 5. Traditional soil conservation structures employed by respondents
4.4. Improved soil conservation structures
The study indicated that different types of improved soil conservation practices were undertaken in the study area. The most widely used improved soil conservation technologies were improved soil bund, improved cutoff drain, and fanyajuu. Of the total of 385 sample households, 41% employed at least one type of improved soil conservation structure. The result indicated that 54.5%, 51.5%, 50.5%, and 46.95% of the total sample households employed improved soil bund, improved cutoff drain, fanyajuu, and gully measurements on their farm plots, respectively (Table ). Improved soil bund is the most widely and most intensively used soil conservation structure in the area.
Table 6. Improved soil conservation structures undertaken in the study area
4.5. Determinants of farmland degradation
The maximum likelihood estimates of the ordered probit model, as well as the marginal effects for the four categories of farmland degradation, are reported in Table . The model was strongly significant at 1%, suggesting at least one of the explanatory variables explained farmland degradation in the West Guji Zone. It also indicated that ten explanatory variables out of seventeen explanatory variables included in the model significantly influenced the severity of farmland degradation. Significant explanatory variables jointly accounted for 21.1% of the variation in the status of farmland degradation. The predicted probabilities that the farm plots are being non-degraded, slightly degraded, moderately degraded, and severely degraded, respectively was 19.68%, 48.5%, 27.95%, and 3.87%. It implies that farm plots in the study site were more likely to be less degraded compared to the rest of the farmland degradation status on the average term. The factors associated with the severity of farmland degradation are discussed as follows.
Table 7. Ordered probit robust estimation results
4.5.1. Sex of the household heads
It significantly and negatively influenced farmland degradation status at a 10% significance level. For male-headed household heads, the marginal effect on the probability of farmland being classified as non-degraded and less degraded increases by 18.4% and 9.8%, respectively, while that of being classified as moderately and severely degraded, respectively, decreases by 25.9% and 2.3%. This is because male household heads are more likely to have access to information, and are financially strong enough to employ soil conservation practices on their farm than female-headed households. The findings by Kirui and Mirzabaev (Citation2015) and Ewunetu et al. (Citation2021) indicated that male-headed households are more likely to adopt sustainable land management technologies in Ethiopia compared to their female counterparts.
4.5.2. Degree of slope
The finding also indicated that the coefficient of the degree of slope of the farmland (both moderately steep and steep) was strongly significant at 1% and had a positive effect on the severity of land degradation. The severity of farmland degradation increases with moderately steep and highly steep farmland compared to even farmland. For moderately and highly steep farmland, the probability that the farmland is non-degraded decreases by 23.1% and 32.6%, less degraded decreases by 12.2% and 17.3%, moderately degraded increases by 32.4% and 45.8%, and that of being severely degraded increases by 2.8% and 4%. Farmland with a steep slope is highly prone to the risk of soil erosion, which causes loss of topsoil and the formation of cracks. Besides, an increase in the slope of the land makes the investment in soil conservation technology and soil improvement activities costly. Berhanu and Swinton (Citation2003) also found a positive association between land degradation and the slope of the plot. Moreover, Leta and Iticha (Citation2018) demonstrated that increases in slope of the farmland from one rank to the next (flat to moderate and then to steep slope) increase the probability of the farmland being classified as degraded and moderately degraded land.
4.5.3. Soil conservation status
The state of soil conservation practices was also hypothesized to affect the severity of land degradation in the West Guji Zone. The coefficient of partially distracted soil conservation practices had a negative significant effect at a 1%. It means that the severity of land degradation decreases if soil conservation practices are partially distracted compared to completely distracted soil conservation practices. The reason is that un-conserved and totally distracted soil conservation measures fail to control the speed of runoff. The presence of conservation structures, such as terraces, grass strips, field bunds, etc. determines soil erosion (Adugna & Bekele, Citation2007). The result shows that a shift of soil conservation practices from a completely distracted to a partially distracted state will increase the likelihood that the farmland is being categorized as non-degraded and less degraded by 28.5% and 15.1% and increases the probability of being categorized as moderately and severely degraded by 40.1% and 3.5% respectively.
4.5.4. Land-to-labor ratio
Consistent with the hypothesized result, it is significantly and negatively associated with farmland degradation. It suggests that increases in the land-to-labor ratio reduce farmland degradation. A farm household with a high land-to-labor ratio owns more landholdings at given labor. Ownership of large size of land initiates the farmers to invest their resources and time to generate high income instead of looking for other sources of income. This indirectly contributes to the conservation and management of the land reducing the risk of land degradation. The findings of Adugna and Bekele (Citation2007) also suggest that a farmer with a high land-to-labor ratio spends more time managing his land, while a farmer with limited landholding prefers to spend a lot of his time on off-farm activities making the investment cost per unit area in terms of human labor invested and area lost to structures make the investment less costly and more rewarding.
4.5.5. Age of the household heads
The result also indicated that the severity of the farmland degradation is positively influenced by age of the farm households at 1%. It implies that an increase in the age of households increases the severity of farmland degradation. This is because as the farmer gets older and older, the ability to manage its farmland through adopting and implementing appropriate soil conservation practices will decrease. This could further exacerbate the depletion of soil nutrients which reduces crop productivity. The finding suggests that for every year increase in the age of the households, the probability that the household’s farmland is non-degraded and less degraded decreases by 4% and 2% respectively. Conversely, it increases the probability of the farmland being categorized as moderately and severely degraded by 6% and 0.1% respectively.
4.5.6. Education level
It also had a negative significant effect on the severity of farmland degradation. The negative coefficient implies the severity of farmland degradation decreases with an increase in the education level of farm households. The educated farm households are more likely to conserve and manage their farmland by investing resources because of their knowledge about the short and long-term impacts of farmland degradation. As a result, one of the most crucial factors for accepting and implementing land management activities was education as it enables farmers to tackle land degradation using various ways of soil fertility improving practices, traditional and introduced soil conserving technologies, as a result, increases farmers’ knowledge about the cause, severity, and consequences of land degradation. Conversely, non-educated or poorly educated farmers have less knowledge about the implications of land degradation on-farm productivity both in the short and long-term, thus, they give less attention to land management and conservation. This would further impact their farmland and contribute to poor farm profitability. The marginal effect indicates the probability of farmland classified as non-degraded and less degraded increases by 1.1% and 6% while it decreases its probability of being moderately and severely degraded by 1.5% and 0.1% respectively. The result confirm to the findings of Teklewold et al. (Citation2013) and Adinew et al. (Citation2017) that argue formal education increases the adoption of improved technologies and land management and can reduce the severity of land degradation.
4.5.7. Family size
It was negatively related to farmland degradation at 5%. The result suggests that an increase in family size decreases the severity of farmland degradation. A unit increase in family size increases the probability of the farmland being non-degraded and moderately degraded by 1.1% and 6% while it decreases its probability of being moderately and severely degraded by 1.5% and 0.1% respectively. The negative association between land degradation and family size is due to the fact that land conservation is a laborious task; households with a larger family size can have better access to labor to implement soil conservation measures. This is prominently practiced in smallholder farming, where family labor is more employed than hired labor. The finding conformed to the results of Kassie et al. (Citation2013) who found larger households have more labor and thus contribute to land conservation, resulting in decreased degradation. On the contrary, Qasim et al. (Citation2011) and Fentie et al. (Citation2013) found that household size had a positive relationship with land degradation. They argue that the increased number of household members requires more agricultural land to meet their food requirements, and they even cultivate marginal land for this purpose with little emphasis on land conservation.
4.5.8. Number of plots
The number plots of owned by farm households found to be positively associated with land degradation. The severity of land degradation increases with an increase in the number of plots. This is because the greater the number of plots owned the more effort in terms of walking time and energy is required to manage the farmland. As plots are fragmented across the farm, the chance of obtaining timely agronomic practices such as animal manures, timely weeding, protection from diseases and pests, frequent supervision from wild animals, and soil conservation measures becomes reduced with an increase in the number of farm plots (Kirui & Mirzabaev, Citation2015). As a result, farmlands are more likely to face severe degradation. The results indicate that with one unit increase in the number of the farm plots, the probability of the plot being classified as non-degraded and less degraded will be decreased by about 4% and 2.1%, whereas the probability of the plot being classified as moderately and severely degraded land will be increased by about 5.6% and 0.5% respectively. Adugna and Bekele (Citation2007) and Etsay et al. (Citation2019) also argued that ownership of more plots may undermine farmers’ interest in undertaking some type of land management. In dispersed and distant plots, the cost of hauling manure or organic materials may not be rewarding. The larger the number of parcels of plots a farmer owns and manages, the greater the time lost in traveling from plot to plot and the smaller the time left for putting manure on soil and other soil conservation activities.
4.5.9. Frequency of extension contact
Consistent with the findings of Qasim et al. (Citation2011) and Etsay et al. (Citation2019), the frequency of extension visits negatively influenced farmland degradation at 10%. The finding indicates increased contact with extension service providers decreases the likelihood of land degradation. With an increase in farmers’ contact with extension agents by one day, the probability of the farmland being categorized as non-degraded and less degraded increases by 3.4% and 1.8% and it decreases the probability of the farmland being classified as moderately and severely degraded by about 4.8% and 0.43%, respectively. This is because the more farmers have contact with extension agents; the more they have exposure to information about agricultural technology usage and land management measures. This helps them recognize the land’s value and preserve their land by applying conservation measures with the knowledge and skills they gained from extension agents. The result confirms the findings of Paudel and Thapa (Citation2004) that allege access to agricultural extension services enhances the adoption of land management practices, thereby contributing to fewer risks of land degradation. And it opposes the findings of Nkonya et al. (Citation2010) that argues depending on the capacity and orientation of the extension providers, access to extension services could also lead to land degrading practices.
5. Conclusion
This paper aimed at exploring farmers’ knowledge of farmland degradation, its causes and effects, the current state of soil conservation practices employed by local farmers, and identify demographic and socioeconomic factors affecting the status of farmland degradation. Farm plot assessment results indicate that most farm plots were slightly degraded, followed by moderate degradation status. The severity of farmland degradation in the study site will be exacerbated if combined conservation approaches are put forth by farmers, governmental, and non-governmental organizations. The main causes of farmland degradation were intensive cultivation without fallow, deforestation/removal of vegetation, and high precipitation. Moreover, the study indicated that increases in the age of household heads, number of plots owned, and slope of the farmland from even to moderately steep and steep increases the likelihood of farmland degradation while being a male-headed household, minimizing of damages to soil conservation structures (a shift from complete distraction to partial distraction), increases in family size, education level, land-to-labor ratio, and frequency of extension contact decreases the severity of farmland degradation.
Therefore, to minimize the severity of farmland degradation, farm households should be trained and educated about cost-effective methods of soil conservation under different farm slopes, intergenerational economic and environmental benefits of preserving soil resources, and the causes and consequences of farmland degradation on a sustainable basis. The study also calls for the promotion of alternative livestock feed resources and homemade biogas as alternative sources of energy. Moreover, a participatory approach has to be followed by the local government to address the problem of deforestation. Coordination of crop scientists and natural resource specialists working as extension agents in rural areas has also paramount importance in creating awareness, disseminating information, and making necessary technologies readily available to farming households. Besides, population policy measures in rural areas should balance per household family size with land resources to minimize population-inflated pressure on land in terms of intensive cultivation. Special support should also be given to female households to build capacity and reduce their vulnerability.
With physical land degradation being the common form of land degradation, the study focused on physical land degradation to examine the severity and its causes with the help of farmers’ and experts’ knowledge. The authors believe that studying the soil’s chemical and nutrient composition also has paramount importance in providing detailed information about the implications for crop productivity. Therefore, future research studies should emphasize studying soil chemical properties.
Ethical considerations
As this study employed a survey approach, ethical approval and informed consent were not required for this study. This is because ethical approval and informed consent are most often reported by experimental research involving human and animal subjects in Ethiopia. In this study, participants were included based on their willingness to participate after the details of the purpose of the study were briefed before the interview, including a promise to keep the confidentiality of information provided by them. Moreover, codes were assigned to the samples during the survey with a little emphasis on the participants’ names. Materials from other sources other than the findings of the study have been duly acknowledged through citation.
Disclosure statement
No potential conflict of interest was reported by the author(s).
Additional information
Funding
Notes on contributors
Mengistu Bululta
Mengistu Bululta is a lecturer at Bule Hora University, Ethiopia. He has a BSc and an MSc degree in Agricultural Economics. His areas of research are farm management, value chain analysis, agribusiness management, and food security.
Haile Tamiru
Haile Tamiru is a lecturer at Bule Hora University, Ethiopia. He has a BSc degree in Geography and Economics, and an MSc degree in Agricultural Economics. His area of research includes food security, farm management, resource economics, climate change, and technical efficiency analysis. He has published papers in different journals.

Tariku Ayele
Tariku Ayele is a lecturer at Bule Hora University, Ethiopia. He is graduated with a BSc degree in Agricultural Resource Economics and Management and an MSc degree in Agricultural Economics. His areas of research are agribusiness management, agricultural marketing, agricultural technology adoption, economic efficiency, and impact analysis. He has published papers in different journals.
Notes
1. The smallest administration unit in Ethiopia.
References
- Abiye, W. (2019). Review on impacts of land degradation on agricultural production in Ethiopia. Journal of Resources Development and Management, 57, 21–20. https://doi.org/10.7176/JRDM/57-03
- Adimassu, Z, & Kessler, A. (2012). Farmers’ investments in land management practices in the Central Rift Valley of Ethiopia. Paper presented at the 8th International Symposium Agro Environ 2012, Wageningen.
- Adinew, M., Shibiru, A., & Gebresilasie, G. (2017). Determinants of households’ participation in degraded land rehabilitation around Dire-Dawa City administration. Imperial Journal of Interdisciplinary Research (IJIR), 3(11), 266–276. https://www.researchgate.net/publication/338774184_Determinants_of_Households'_Participation_in_Degraded_Land_Rehabilitation_around_Dire-Dawa_City_Administration
- Adugna, G., & Bekele, W. (2007). Determinants of land degradation in the Lake Tana Basin and its implications for sustainable land management: The case of Angereb and Gish-Abbay watersheds. Ethiopian Journal of Agricultural Economics, 6(2), 70–100. https://www.researchgate.net/publication/269106965_Determinants_of_Land_Degradation_in_the_Lake_Tana_Basin_and_its_Implication_for_Sustainable_Development_The_case_of_Angereb_and_Gise-Abbay_watersheds_Ethiopian_Journal_of_Agricultural_Economics_Volume
- AGNES. (2020). Land degradation and climate change in Africa. Policy Brief No, 2. https://agnes-africa.org/wp-content/uploads/2020/07/Policy-brief-2_Land-Degradation_Final_09032020.pdf
- Assefa, A., & Sigh, K. N. (2019). Factors affecting the adoption of sustainable land management practices at farmlevel in the Northeastern highlands of Ethiopia. The Teleyayen Sub-watershed case study. Journal of Environmental Pollution and Management, 21, 1–12. http://article.scholarena.com/Factors-Affecting-the-Adoption-of-Sustainable-Land-Management-Practices-at-Farm-Level-in-the-Northeastern-Highlands-of-Ethiopia-The-Teleyayen-Sub-Watershed-Case-Study.pdf
- Barbier, E. B. (1997). The economic determinants of land degradation in developing countries. Philosophical Transactions of the Royal Society Biological Science, 352(1356), 891–899. https://doi.org/10.1098/rstb.1997.0068
- Belay, K. T., Van Rompaey, A., Poesen, J., Van Bruyssel, S., Deckers, J., & Amare, K. (2015). Spatial analysis of land cover changes in Eastern Tigray (Ethiopia) from 1965 to 2007: Are there signs of a forest transition? Land Degradation and Development, 26(7), 680–689. https://doi.org/10.1002/ldr.2275
- Berhanu, G., & Swinton, S. M. (2003). Investment in soil conservation in Northern Ethiopia: The role of land tenure security and public programmes. Journal of Agricultural Economics, 29(1), 69–84. Michigan State University, USA. https://doi.org/10.1111/j.1574-0862.2003.tb00148.x.
- Cochran, W. G. (1977). Sampling Techniques (2nd) ed.). John Wiley and Sons, Inc.
- Current, D., Lutz, E., & Scherr, S. (eds). (1995). Costs, benefits and farmer adoption of agroforestry: Project experience in Central America and the Caribbean. World Bank Environment Paper No. 14. Washington DC: The World Bank.
- Damena, D. (2012). Determinants of farmers’ land management practices: The case of Tole district, South West Shewa Zone, Oromia National Regional State, Ethiopia. Journal of Sustainable Development in Africa, 14(1), 76–96. https://jsd-africa.com/Jsda/Vol14No1-Spring2012A/PDF/Determinants%20of%20Farmers%20Land%20Management%20Practices.Heyi%20and%20Mberengwa.pdf
- Delang, C. (2018). The consequences of soil degradation in China: A review. Sciendo, 92–103.https://doi.org/10.2478/geosc-2018-0010
- Deresse, T. (2020). Assessing community participation on soil conservation and its influences on poverty reduction: The case of Bule Hora Woreda, West Guji Zone, Ethiopia. Palarch’s Journal of Archaeology of Egypt/Egyptology, 17(9), 4889–4903. https://archives.palarch.nl/index.php/jae/article/view/4682/4630
- Dinesh, B., Rajeev, J., Raju, R., & Nripesh, A. (2021). Assessment of soil erosion and its impact on agricultural productivity by using the RMMF model and local perception: A case study of Rangun watershed of Mid-Hills, Nepal. Applied and Environmental Soil Science, 1-10. https://doi.org/10.1155/2021/5747138
- Etsay, H., Negash, T., & Aregay, M. (2019). Factors that influence the implementation of sustainable land management practices by rural households in Tigrai region, Ethiopia. Ecological Processes, 8(14), 2–16. https://doi.org/10.1186/s13717-019-0166-8
- Ewunetu, A., Simane, B., Teferi, E. F., & Zaitchik, B. (2021). Relationships and the determinants of sustainable land management technologies in North Gojjam Sub-Basin, Upper Blue Nile, Ethiopia. Sustainability, 13(6365), 1–19. https://doi.org/10.3390/su13116365
- Fahad, S., & Wang, G. (2018). Farmers’ risk perception, vulnerability, and adaptation to climate change in rural Pakistan. Land Use Policy, 79, 301–309. https://doi.org/10.1016/j.landusepol.2018.08.018
- Fahad, S., & Wang, G. (2020). Climate change, vulnerability, and its impacts in rural Pakistan: A review. Environmental Science and Pollution Research, 27(2), 1334–1338. https://doi.org/10.1007/s11356-019-06878-1
- Fentie, D., Fufa, B., & Bekele, W. (2013). Determinants of the use of soil conservation technologies by smallholder farmers: The case of Hulet Eju Enesie district, East Gojjam Zone, Ethiopia. Asian Journal of Agriculture and Food Sciences,1(4), 119–138. https://192.99.73.24/index.php/AJAFS/article/download/163/275
- Greene, W. H. (2000). Econometric Analysis. Prentice-Hall.
- Hurni, H., Tato, K., & Zeleke, G. (2005). The implications of changes in population, land use, and land management for surface runoff in the Upper Nile Basin Area of Ethiopia. Mountain Research and Development, 25(2), 147–154.
- Kassie, M., Jaleta, M., Shiferaw, B., Mmbando, F., & Mekuria, M. (2013). Adoption of interrelated sustainable agricultural practices in smallholder systems: Evidence from rural Tanzania. Technological Forecasting and Social Change, 80(3), 525–540. https://doi.org/10.1016/j.techfore.2012.08.007
- Kirui, O. K., & Mirzabaev, A. (2015). Drivers of land degradation and adoption of multiple sustainable land management practices in Eastern Africa. A paper contributed at 29th International Conference of Agricultural Economists on Agriculture in an Interconnected World, Milan, Italy.
- Leta, A., & Iticha, B. (2018). Determinants of farmland degradation and its implication on crop productivity and sustainability. Journal of Applied Science and Environmental Management, 22(8), 1225–1232. https://www.ajol.info/index.php/jasem/article/view/177413/166767.
- Maddala, G. S. (1999). Limited dependent variable in econometrics. Cambridge University Press.
- Miheretu, B.A., &Yimer, A.A. (2017). Determinants of farmers’ adoption of land management practices in Gelana sub-watershed of Northern highlands of Ethiopia. Ecol Process 6(19):1–11. https://doi.org/10.1186/s13717-017-0085-5
- Mirzabaev, A., Strokov, A., & Krasilnikov, P. (2018). The impact of land degradation on agricultural profits and poverty in Central Asia. A contributed paper at the 30th International Conference of Agricultural Economists, Vancouver.
- Nkonya, E., Phillip, D., Mogues, T., Pender, J., & Kato, E. (2010). From the ground up: Impacts of a pro-poor community-driven development project in Nigeria. International Food Policy and Research Institute. https://doi.org/10.2499/978089629179
- Paudel, G. S., & Thapa, G. B. (2004). Impact of social, institutional, and ecological factors on land management practices in mountain watersheds of Nepal. Applied Geography, 24(1), 35–55. https://doi.org/10.1016/j.apgeog.2003.08.011
- Qasim, S., Shrestha, R. P., Shivakoti, G. P., & Tripathi, N. K. (2011). Socioeconomic determinants of land degradation in Pishin sub-basin, Pakistan. International Journal of Sustainable Development & World Ecology, 18(1), 48–54. https://doi.org/10.1080/13504509.2011.543844
- Quyet, M. V., Quang, B. L., Emmanuel, F., & Paul, L. G. (2014). Socio-economic and biophysical determinants of land degradation in Vietnam: An integrated causal analysis at the national level. Land Use Policy, 36, 605–617. https://doi.org/10.1016/j.landusepol.2013.10.012
- Salih, A., Ganawa, E., & Elmahl, A. (2017). Spectral mixture analysis (SMA) and change vector analysis (CVA) methods for monitoring and mapping land degradation/desertification in arid and semiarid areas (Sudan), using Landsat imagery. Egyptian Journal of Remote Sensing and Space Science, 20, S21–S29. http://drr.ikcest.org/static/upload/58/5850f82e-a607-11ea-907b-00163e0618d6.pdf
- Scherr, S. J., & Yadav, S. (1996). Land degradation in the developing world : Implications for food, agriculture, and the environment to 2020. Food, agriculture, and the environment discussion paper 14. https://doi.org/10.22004/ag.econ.42280
- Shimeles, A., Janekarnkij, P., & Wangwacharakul, V. (2011). Analysis of factors affecting adoption of soil conservation measures among rural households of Gursum District, Ethiopia. Kasetsart Journal of Social Science, 32, 503–515. https://www.thaiscience.info/journals/Article/TKJS/10800993.pdf
- Singh, A. S., & Masuku, M. B. (2014). Sampling techniques & determination of sample size in applied statistics research: An overview. International Journal of Economics, Commerce and Management, 2(11), 2348–2386. https://ijecm.co.uk/wp-content/uploads/2014/11/21131.pdf
- Sonneveld, B. G., Keyzer, M. A., & Ndiaye, D. (2016). Quantifying the impact of land degradation on crop production: The case of Senegal. Solid Earth, 7(1), 93–103. https://doi.org/10.5194/se-7-93-2016
- Taddese, S. (2018). The impacts of land degradation on crop productivity in Ethiopia. A review. Journal of Environment and Earth Science, 8(11), 102–106. https://www.researchgate.net/profile/Arvind-Singh-21/post/What_effect_does_land_degradation_has_on_crop_productivity/attachment/5eaabf2df155db0001f883a0/AS%3A885992013705216%401588248365098/download/1.pdf
- Teklewold, H., Kassie, M., & Shiferaw, B. (2013). Adoption of multiple sustainable agricultural practices in rural Ethiopia. Journal of Agricultural Economics, 64(3), 597–623. https://doi.org/10.1111/1477-9552.12011
- Teshome, A., de Graaff, J., & Kassie, M. (2016). Household-level determinants of soil and water conservation adoption phases: Evidence from North-Western Ethiopian Highlands. Environmental Management, 57(3), 620–636. https://doi.org/10.1007/s00267-015-0635-5
- Tun, K., Rajendra, P., & Avishek, D. (2015). Assessment of land degradation and its impact on crop production in the Dry Zone of Myanmar. International Journal of Sustainable Development & World Ecology, 22(6), 533–544. https://doi.org/10.1080/13504509.2015.1091046
- Zamfir, R. H., Smiraglia, D., Quaranta, G., Salvia, R., Salvati, L., & Morera, A. G. (2020). Land degradation and mitigation policies in the Mediterranean Region: A Brief Commentary. Sustainability, 12(8313), 1–17. https://doi.org/10.3390/su12208313