?Mathematical formulae have been encoded as MathML and are displayed in this HTML version using MathJax in order to improve their display. Uncheck the box to turn MathJax off. This feature requires Javascript. Click on a formula to zoom.
Abstract
Price stability is the ultimate objective of the State Bank of Vietnam (SBV). In addition, in a small export-led economy, such as Vietnam, the study of exchange rate volatility is crucial for the country’s economy due to its impact on inflation via exchange rate pass-through (ERPT). This study investigated ERPT in Vietnam by employing both autoregressive distributed lag (ARDL) and nonlinear-ARDL (NARDL) approaches with data spanning from January 2009 to May 2020. Our main findings suggest that the exchange rate and money supply are the two most important factors influencing the consumer price index (CPI) and explain the change in the CPI structure using the threshold model. In addition, the transition to a central-rate mechanism successfully lowered the inflation rate in Vietnam. Furthermore, the NARDL model displays short- and long-run exchange rate asymmetries. Based on this evidence, several policy implications are provided to support price-level stability.
PUBLIC INTEREST STATEMENT
The impact of exchange rate volatility on inflation is of great interest to economists and all citizens. Considering the different effects between devaluation and appreciation of domestic currency on the consumer price index (CPI) is important for the monetary authority. In addition, other macro factors, such as money supply and oil price, also affect CPI. Inconsistent conclusions on the impact of exchange rates on inflation are the driving force behind investigating exchange rate pass-through in Vietnam. The results highlighted the significance of the devaluation of VND and money supply on the CPI in Vietnam. Moreover, the transition to a central-rate mechanism successfully lowered the inflation rate in Vietnam. Furthermore, this study shows that both the exchange rate and money supply influence changes in the CPI structure. Based on these results, several policy implications are provided to support price-level stability.
1. Introduction
The ultimate objective of the State Bank of Vietnam (SBV) is to maintain the currency value or inflation rate stability because price stability is a crucial aspect of the economy (Lado, Citation2015). Rodrik (Citation2008) advocated that domestic currency devaluation boosts economic growth in developing countries. Nevertheless, Burstein et al., Citation2007) stated that open trade countries should consider exchange rate volatility in terms of inflation. As a small, developing, and export-led economy, Vietnam imports numerous intermediate goods for production before reexporting them. Thus, exchange rate devaluation is crucial for Vietnam because of its impact on exports and inflation via exchange rate pass-through (ERPT). Therefore, understanding ERPT to ensure a stable price level is paramount for SBV, thereby assisting policymakers in designing effective policies that contribute to the success of the monetary policy in Vietnam. If the ERPT is high, Vietnam would be affected by exchange rate shocks from trading partners; thus, monetary authorities should implement appropriate policies to reduce inflation. Conversely, if the ERPT is relatively low, Vietnam would be less vulnerable to inflation imported from its trading partners. Hence, policymakers can improve trade balance by adjusting the exchange rate.
Goldberg and Knetter (Citation1997) defined ERPT as the percentage change in import prices in the local currency when the exchange rate changes by 1% (Stage 1). The definition was later expanded to include the percentage change in producer prices or consumer price index (CPI) for a 1% change in exchange rate (Stage 2). Exchange rate fluctuation is one of the causes of change in import prices, which then lead to changes in the CPI. Consequently, a low ERPT effect is required to control inflation. Environmental inflation also plays a vital role in determining the degree of ERPT (Cheikh & Louhichi, Citation2016; Soon et al., Citation2018).
Since the late 1980s, economists and researchers have been interested in the relationship between ERPT and inflation. The ERPT is a priority for monetary policymakers because exchange rate fluctuations cause a significant increase in import prices or inflation. This stems from ineffective monetary policies. On the contrary, an effective monetary policy denotes low ERPT to inflation and, thus, the ability to stimulate economic progress. Therefore, monetary authorities should assess the extent of the ERPT when designing monetary policies (Anh et al., Citation2018; Choudhri & Hakura, Citation2006). Monetary policy dependence decreases when a country easily implements inflation targeting.
Figure illustrates the monthly variation in CPI and exchange rate in Vietnam from January 2009 to May 2020. Both the CPI and exchange rate exhibited an upward trend, indicating a strong correlation between the two. This is clear evidence of the ERPT in Vietnam. Furthermore, two structural changes are evident on the CPI curve in June 2011 and March 2016, verified using the Wald test.Footnote1 The CPI tends to rise rapidly in the early stages, but the growth rate progressively decreases from one period to the next. The figure shows that stages one, two and three increased by 34.41%, 20.76%, and 13.55%, respectively. The change in the trend in 2016 coincided with the transition of the Vietnamese exchange rate regime from a conventional fixed peg arrangement to a central exchange rate.
Figure 1. Consumer price index and exchange rate in Vietnam from January 2009 to May 2020. Source: International Financial Statistics (IFS).

Empirical research demonstrates a strong relationship between exchange rates and inflation. However, previous research has not focused on the changes in the exchange rate mechanism. Therefore, this study primarily investigates the effects of the exchange rate mechanism on inflation. This study is significant in two respects. First, it examines the ERPT in Vietnam using autoregressive distributed lag (ARDL) and nonlinear-ARDL (NARDL) approaches with monthly data updated from 2000:1 to 2020:5. Second, to the best of our knowledge, this is the first study to assess the impact of exchange rate mechanism transition on CPI and to identify the reasons for the change in the CPI structure in Vietnam.
The remainder of this paper is structured as follows: Section 2 presents the literature, and Section 3 describes the methodology applied in this study. This paper ends with Section 4 reporting the study results and providing policy-related implications.
2. Literature review
2.1. Empirical literature review
Empirical studies on the ERPT emerged in the late 1990s from developing to developed countries. The degree of the ERPT can be determined based on several micro and macro factors. Microelements are related to the industrial structure of an economy. Dornbusch (Citation1987) supported the theory that pass-through is affected by micro factors, such as substitute products and market structure.
Taylor (Citation2000) developed a microeconomic and an economy-wide models, making them the world’s most influential ERPT models to date. The author supported the decline in the US ERPT since 1990 due to the low inflation of the US economy, which has also been noted across many other developed countries. The author also advocated that changes in monetary policy and expectations impact the ERPT. Similarly, Campa and Goldberg (Citation2002) pointed out that macroeconomic variables influence ERPT because of competition among exporters pursuing market share. When the nominal exchange rate is highly volatile, exporters maintain their market share by lowering their selling prices. Accordingly, the ERPT can be reduced.
Campa and Goldberg (Citation2002) investigated the micro and macro factors that influence ERPT using data obtained from 25 OECD countries. The results indicated that the structure of imports influences the pass-through level. For example, pass-through decreases when a country switches from a highly elastic import industry to a low-elasticity sector. Raw materials are more volatile than manufactured goods in terms of exchange rate volatility because manufactured goods have a higher degree of cohesion. At the macroeconomic level, there is no statistically significant relationship between inflation or money supply and ERPT in the long run. Nonetheless, ERPT is lower in countries with lower short-term exchange rate volatility.
Both theoretical and empirical results have demonstrated that many macroeconomic factors, such as exchange rate, monetary policy, oil price, and output gap, can influence the degree of ERPT. Exchange rate fluctuations can have a positive or negative impact on transmission. However, high exchange rate volatility may cause importers to adjust mark-up, resulting in lower ERPT (Corsetti et al., Citation2008; Przystupa & Wróbel, Citation2011). McCarthy (Citation2007) and Phuc and Duc (Citation2019) discovered that ERPT is highly correlated with exchange-rate fluctuations. The ratio of ERPT to CPI also seemed to vary between developing and developed countries. According to Frankel et al. (Citation2012), developing countries have a faster and larger ERPT than that of developed countries. Similarly, Kurtović et al. (Citation2018) asserted that transitioning countries should have a higher level of pass-through than developed countries. In contrast, Kassi et al. (Citation2019) found a higher ERPT in emerging Asian countries than in other developing countries. Furthermore, conclusions on the ERPT for countries with inflation targeting have been mixed. Caselli and Roitman (Citation2019) and Soon et al. (Citation2018) advocated the low ERPT, whereas Nasir and Vo (Citation2020) stated that the United Kingdom and New Zealand increased the degree of ERPT.
An appropriate monetary policy maintains a low-inflation environment, which results in low ERPT. Carriere-Swallow et al. (Citation2016) pointed out that a credible monetary policy can serve as an anchor for expected inflation and is an effective method for reducing ERPT. Kabundi and Mlachila (Citation2019) reported that the reduction in ERPT in South Africa was mainly due to the improvement of the monetary policy, which reduces volatility of the monetary policy target. Mendonça and Tiberto (Citation2017) applied the money supply divided by GDP to represent views of monetary authority and discovered that increasing money supply placed upward pressure on inflation.
Oil price (representing a supply shock) is one of the main factors influencing inflation change. Anh et al. (Citation2018) reported that the change in oil prices explained 13%, 8%, and 20% of inflation in Malaysia, the Philippines, and Singapore, respectively. Similarly, Pham et al. (Citation2020) suggested that oil prices have a vital role in price stabilization in the ASEAN 5.
The output gap reflects a country’s economic cycle and is a proxy for import demand. When the output gap is positive (i.e., real GDP exceeds potential GDP), which usually increases domestic demand, foreign exporters often shift ERPT into commodities. As a result, ERPT increases. Nevertheless, when foreign exporters face enormous competition, they are willing to absorb and reduce the level of ERPT. Therefore, Cheikh and Rault (Citation2017) claimed that the output gap can be used as proxy for the mark-up of foreign exporters. Phuc and Duc (Citation2019) found that the output gap had a relatively weak impact on CPI in Australia and Japan. Meanwhile, Jiménez-Rodríguez and Morales-Zumaquero (Citation2016) described output gaps as having negative and extremely low effects in France and Italy, as opposed to positive and low effects in Canada and Japan. Anh et al. (Citation2018) found that the output gap is crucial in explaining inflation in Malaysia and the Philippines (two out of the five countries that were assessed). In contrast, the output gap has no statistical significance or impact on CPI, as discovered from the research by Tho and Trang (Citation2016) in Vietnam and Ozkan and Erden (Citation2015) in developed economies between 1990 and 2012. This is because developed economies had a low stable inflation rate during that period.
Inflation is also affected by other factors including economic openness, interest rates, and exchange rate mechanisms. Razafimahefa (Citation2012) agreed that countries with a fixed exchange rate regime have a higher level of pass-through to import prices than those with a floating exchange rate regime in the long run. In certain developing countries, inflation is controlled by floating exchange rates (Calvo & Mishkin, Citation2003). By contrast, a fixed exchange rate mechanism acts as a nominal anchor to control inflation. Levy-Yeyati and Sturzenegger (Citation2003) reported a positive relationship between exchange rate regimes and inflation in developing countries, indicating that the long-run fixed exchange rate mechanism has a positive effect on inflation. However, in the short term, the exchange rate mechanism is ineffective at lowering inflation. Beirne and Bijsterbosch (Citation2011) studied nine central and eastern EU countries and discovered that the exchange rate mechanism led to changes in inflation. ERPT is higher in countries with a fixed exchange rate regime than in those with a flexible exchange rate regime. Similarly, Civcir and Akcaglayan (Citation2010) found that the crawling peg regime in Turkey had a higher ERPT than the floating exchange rate regime. However, Liu et al. (Citation2017) revealed that after China switched from a hard peg to a managed floating exchange rate regime in 2005, inflation became more sensitive. Nonetheless, Comunale and Simola (Citation2018) reported no link between the exchange rate mechanism and the degree of exchange rate transfer in the Commonwealth of Independent States.
The NARDL model was developed by Shin et al. (Citation2014). According to Arize et al. (Citation2017), some advantages of the NARDL approach are as follows: (1) it provides different estimation coefficients in response to the negative or positive change of the dependent variable both in the short and long run; and (2) the NARDL model requires time-series variables to be integrated at level I(0) or first difference, I(1). Kassi et al. (Citation2019) deployed the NARDL approach to investigate the effects of exchange rates on consumer prices in emerging and developing Asian countries. The empirical results reported by the researchers indicated that asymmetric ERPT exists in the short run for both emerging and developing countries. However, in the long run, asymmetric ERPT has existed in emerging countries. Samuel Elias Kayamo (Citation2021) employed NARDL to examine the impact of exchange rate volatility on inflation in Ethiopia and concluded that the real exchange rate is asymmetric and statistically significant for short- and long-term inflation. The empirical result of Pham et al. (Citation2020) advocated an asymmetric ERPT in three out of five economies in ASEAN. In addition, oil prices and money supply have a vital impact on inflation in ASEAN 5.
Hansen (Citation1999) introduced the threshold model, which has been widely applied in economics. Abdulqadir and Chua (Citation2020) used a panel threshold regression with the threshold as an inflation variable to examine the impact of ERPT on wages in 15 sub-Saharan African countries. The results showed that the threshold value for inflation was 15.12 and an asymmetric ERPT to wages when inflation is greater than the threshold value. In addition, Yi and Xiao-li (Citation2018) found that when the threshold variable is regional economic development, and ranges from 0.301 to 0.438, technological innovation strongly affects regional sustainable development in 31 Chinese provinces. If it is outside this range, the influence of regional technological innovation on sustainable development is very low. In summary, the threshold model was used to determine the cause of a change in the structure of a variable, which is extremely important for policymaking. To the best of our knowledge, no study has revealed the reason for the structural change in Vietnam’s CPI. To fill this gap, we employed a threshold model to answer this question.
However, few studies have assessed the extent of ERPT in Vietnam. Minh (Citation2009) discovered that in the short term, ERPT was 0.61; however, after 15 months, the change in the exchange rate no longer affected inflation. In other words, no ERPT was observed in Vietnam in the long term. Similarly, Elgammal and Eissa (Citation2016) reported that exchange rate volatility is positively correlated with short-run inflation. In addition, past inflation was the most crucial factor that exerted an impact on inflation in Vietnam. Tho and Trang (Citation2016) investigated the impact of ERPT in an inflationary environment using a nonlinear Threshold Vector Autoregression model and showed that ERPT is absent in Vietnam. By contrast, using a vector autoregression (VAR) model, Pham (Citation2019) found that the exchange rate is crucial in explaining the volatility of inflation. Furthermore, some factors such as expectations and money supply contributed to the increase in inflation. The study by Pham (Citation2019) is supported by the findings of Vo et al. (Citation2019), who also concluded that Vietnam had an incomplete ERPT. In contrast, Kassi et al. (Citation2019) supported long-term nonlinear ERPT in Vietnam, where statistical significance was found for the depreciation exchange rate only. In particular, the 1% depreciation exchange rate increased inflation by 1,206%. This study enriches the existing literature in two ways. It discovers the role of the exchange rate regime in inflation and the factors that affect changes in Vietnam’s CPI structure.
2.2. Theoretical literature with the hypothesis development
Prasertnukul et al. (Citation2010) argued that whether ERPT occurs in a small open economy is an important question because it contributes to the determination of the country’s monetary policy. If ERPT is high, exchange rate volatility has a substantial impact on inflation. By contrast, a low ERPT allows policymakers to pursue a flexible monetary policy while maintaining an inflation target (Choudhri & Hakura, Citation2006). Studies have shown that ERPT exists in Vietnam (see, Pham, Citation2019; Vo et al., Citation2019) and other countries worldwide (see, Nasir & Vo, Citation2020; Roitman, Citation2019; Soon et al., Citation2018). In addition, the different effects of exchange rates appreciation and depreciation on inflation are important for monetary policy decisions (Przystupa & Wróbel, Citation2011). Many studies have supported the existence of an asymmetric ERPT (see, Pham et al., Citation2020; Samuel Elias Kayamo, Citation2021). Therefore, the first hypothesis is as follows:
Hypothesis 1a (H1a): The exchange rate has a positive effect on the CPI
Hypothesis 1b (H1b): There is an existence of asymmetric ERPT
Currently, economists agree that “inflation increases when the government prints too much money.” Empirical studies by Mendonça and Tiberto (Citation2017) for developing countries and Pham (Citation2019) for Vietnam supported the impact of money supply changes on inflation. Therefore, the second hypothesis of this study is formulated as follows:
Hypothesis 2 (H2): Money supply has a positive relationship with inflation
Oil prices represent supply shocks, and Anh et al. (Citation2018) supported oil prices as a major factor affecting inflation in Southeast Asian countries. In contrast, Phuc and Duc (Citation2019) showed that oil prices play a small role in inflation in Asia-Pacific countries. Studies in Vietnam by Vo et al., Citation2019) and Pham (Citation2019) showed a positive relationship between oil prices and inflation. Therefore, the third hypothesis of this study is formulated as follows:
Hypothesis 3 (H3): Oil price has a positive relationship with inflation
Empirical studies show that the output gap has a minor impact on CPI (see, Jiménez-Rodríguez & Morales-Zumaquero, Citation2016; Phuc & Duc, Citation2019) or no impact on CPI, such as Ozkan and Erden (Citation2015) for developed economies and Tho and Trang (Citation2016) for Vietnam. Due to the stability and low inflation in Vietnam during the study period (except in 2011), the following hypothesis is proposed:
Hypothesis 4 (H4): There is no relationship between the output gap and inflation
During the period 2008–2015, when the SBV conducted the crawling bands mechanism (2008–2011) and the conventional fixed peg arrangement mechanism (2012–2015), inflation fluctuated sharply at some points. After applying the central rate mechanism in 2016, inflation in Vietnam was well-controlled. Therefore, the crawling bands mechanism (2008–2011) and the conventional fixed peg arrangement mechanism (2012–2015) cause inflation higher than the central rate mechanism (2016–present). Furthermore, the central rate mechanism should have a lower ERPT because it has a more flexible exchange rate than the conventional fixed peg arrangement mechanism and crawling bands mechanism (Ho & Idir, Citation2020). Based on these exhibits, the following two hypotheses are proposed:
Hypothesis 5 (H5): The crawling-band mechanism has a positive relationship with inflation
Hypothesis 6 (H6): The conventional fixed-peg-arrangement mechanism has a positive relationship with inflation
3. Methodology and data
3.1. Methodology
The CPI serves as the dependent variable used to examine the factors that influence CPI in Vietnam. The nominal exchange rate (ER), money supply (M2), oil price (Oil), and output gap (OG) were the independent variables used in this study. As this study assessed the impact of either exchange rate, Vietnamese changes in the exchange rate mechanism, or both aspects on the CPI, two dummy variables, namely, D1 = 1 from 2009:1 to 2011:12 (crawling band mechanism) and D2 = 1 from 2012:1 to 2015:12 (conventional fixed peg arrangement mechanism) were incorporated, along with base category = 0 (central rate mechanism). The CPI equation is expressed as follows:
Both sides of EquationEquation 1(1)
(1) have a log form, except the dummy variables.
EquationEquation (1)(1)
(1) represents the long-run equation. Thus, the ARDL method proposed by Pesaran et al. (Citation2001) was applied to investigate both short- and long-term changes.
To determine whether the effect of the exchange rate on CPI is nonlinear, POS (representing the depreciation of VND) and NEG (expressing the appreciation of VND) were generated as follows:
Following the instructions of Shin et al. (Citation2014), EquationEquation (4)(4)
(4) was obtained by substituting the POS and NEG from EquationEquation (3)
(3)
(3) into the ER in EquationEquation (2)
(2)
(2) .
EquationEquation (4)(4)
(4) expresses NARDL. The estimated coefficient allows for the analysis of the effects of variables in both the short and long run. The NARDL method also allows us to consider whether the exchange rate change on CPI is symmetric or asymmetric; it is symmetric if the effects of POS and NEG are the same, and asymmetric if they differ.
The threshold model was used to determine the variables that caused two structural changes in June 2011 and March 2016 on the CPI curve.
The threshold model with m thresholds and m + 1 regions has the following equation:
or
where yt is the CPI; xt represents ER, M2, Oil, and OG; β is a regional-invariant parameter; and wt is a threshold variable.
are order thresholds.
is an indicator for the jth region.
The threshold estimation was conducted in two steps: the existence of threshold variables in the regression model was determined; and subsequently, a threshold estimationFootnote2 was conducted to verify the threshold variable.
3.2. Data
The Vietnam Industrial Production Index was used as a proxy variable for Vietnam’s GDP because of limited data. The output gap is the difference between real and nominal GDP calculated using the Hodrick (HP) filter method. The exchange rate is defined as VND/USD; therefore, an increase in the exchange rate indicates Vietnamese currency devaluation. The following data were collected from the SBV, IMF International Financial Statistics (IFS), and Mundi between January 2009 and May 2020. Please see for more detail.
Table 1. Data sources
The time series regression with ARIMA noise, missing observations, and outliers (TRAMO) method was used to fill in three missing values in the money supply (2011:6, 2011:11, and 2012:3) because this was the best method to address missing data in time series (Lan et al., Citation2019). Eview 12 was used for the TRAMO method as well as to estimate the ARDL and NARDL. Stata 15 was used as a threshold model.
4. Results and policy implication
4.1. Results
4.1.1. Unit root test
A stationarity test was required for this study, using time-series data for the model. To test for stationarity at the level and first difference, augmented Dickey (ADF), Phillips (PP), and Kwiatkowski–Phillips (Schmidt) Shin tests were performed.
Table tabulates the level and first-difference stationarity of variables. At the 1% statistical significance level, the ADF test revealed that OG was stationary, while the other variables were stationary at the first difference. Both the PP and KPSS tests favored variables that were stationary at the level or the first difference. Hence, all ADF, PP, and KPSS tests showed that no variable was stationary at the second difference.
Table 2A. Unit root test
Time series variables, such as CPI, exchange rate, and money supply, may undergo a structural change over time because of a change in economic policy, business cycle, or financial cycle. Therefore, a stationary structure with a break should be tested. The ADF breakpoint unit root test was conducted using the ADF test (Nasir, Citation2021). The outcomes are shown in Table .
Table 2B. ADF breakpoint unit root test (innovational outlier and additive outlier)
Table indicates that the result of the ADF breakpoint unit root test for innovational outliers is similar to the results of the additive outliers. CPI, OG, and Oil have unit roots at the level of 1% or 5%. In addition, ER and M2 had unit roots at the first difference. Consequently, all the variables are cointegrated in order I(1). Both the unit root test and ADF breakpoint unit root test support all variables cointegrated at I (1); therefore, the ARDL model can be implemented for this study.
4.1.2. Optimal lag length criteria
As no variable was cointegrated at I(2), determining the optimal lag was the next step before executing ARDL and NARDL. The optimal lag was determined based on five criteria: sequential modified LR test statistic (LR), final prediction error (FPE), Akaike information criterion (AIC), Schwarz information criterion (SC), and Hannan-Quinn information criterion (HQ). The above criteria had similar powers. The lag of the AIC criterion was selected when no lag prevailed upon adhering to previous studies (see, Khachatryan & Grigoryan, Citation2020; Olowofeso et al., Citation2017).
Table presents the optimal lag of the model. The second lag was chosen based on the AIC and FPE criteria, whereas the first lag was selected based on the SC and HQ criteria. As previously stated, the second lag was chosen as the optimal lag based on the AIC criteria.
Table 3. Optimal lag length
4.1.3. Linear Autoregressive distributed lag model
Table summarizes the results of the ARDL model for both the short and long terms. Except for D1, all the variables were statistically significant in the short run. A 1% VND devaluation caused the CPI to increase by 0.097% at lag 0; however, the CPI decreased by 0.058% at lag 1. An increment in the money supply of 1% caused the CPI to increase by 0.064%. A world oil prices hike only increased the CPI at lag 0, but the CPI decreased at lag 2. This is ascribed to the action taken by the government to control the prices of important commodities such as petrol. Since the variable D2 was statistically significant at the 10% level, the transition from the conventional fixed peg arrangement mechanism to the central rate mechanism lowered inflation in Vietnam by 0.003% in the short term.
Table 4. ARDL model results. Number of observations: 135 after adjustments
Both the exchange rate and money supply were statistically significant at the 1% level in the long run. When the local currency depreciated by 1%, the CPI increased by 1.34% (c. p.). Evidently, the impact of VND devaluation on inflation, or in other words, the occurrence of high ERPT, was very high. Similarly, when the government increased the money supply by 1%, the CPI rose by 0.127% (c. p.).
If the world oil price increased by 1%, the CPI in Vietnam rose by 0.041% (c. p.). In contrast to the results of Anh et al. (Citation2018) and Pham et al. (Citation2020) but similar to Tho and Trang (Citation2016), fluctuations in world oil prices had a minor impact on the CPI in Vietnam because the Vietnamese government controlled the prices of necessary goods, such as gasoline, oil, electricity, and water.
The output gap has a statistical insignificance or no impact on CPI. This result is similar to those of Tho and Trang (Citation2016) in Vietnam and Ozkan and Erden (Citation2015) in developed economies due to stability and low inflation in Vietnam during the study period (except 2011).
In the long run, the transition from the conventional fixed peg arrangement regime to the central rate regime lowered CPI in Vietnam by 0.042%. This is similar to the study by Du et al. (Citation2021), who pointed out that the reform of the exchange rate mechanism into a basket of currencies in 2005 helped slightly reduce China’s inflation. Apparently, the exchange rate emerged as the most crucial factor affecting Vietnam’s CPI. Variable D2 was statistically significant, thus explaining the change in the CPI trend in March 2016.
4.1.4. Nonlinear autoregressive distributed lag model
To determine whether the exchange rate had a symmetric or asymmetric effect on the CPI, NARDL was performed. The results are shown in .
Table 5. NARDL model results
The NARDL model favors the exchange rate impact on CPI asymmetry in both the short and long run. In the short term, a 1% increase in the exchange rate led to a 0.093% increase in the CPI (c. p.). In contrast, when the exchange rate decreased by 1%, the CPI increased by 0.583% (c. p.). This finding is similar to that reported by Kassi et al. (Citation2019) in the context of the Philippines and Indonesia. This outcome is attributable to the appreciation of VND, which causes the price of imported goods to increase in the short term. As domestic enterprises failed to find alternative sources of goods, they continued to accept escalated prices, resulting to a higher CPI in the short run.
In the long term, when VND depreciated by 1%, CPI increased by 1.432% (c. p.). ERPT, which is higher than one, is suitable for the research by Campa and Goldberg (Citation2002), Campa & Goldberg, Citation2005), Dash and Narasimhan (Citation2011), and Yanamandra (Citation2015) due to the “hysteresis induced effect” explained by Yanamandra (Citation2015). This effect implies that exchange rate change leads to an adjustment in the market structure. As a result, this change has increased import prices in the long term. In addition, when persistent and expected inflation occurs in importing countries, exporters can change from local currency pricing (LCP) to producer currency pricing (PCP), possibly leading to further price increases. This result is consistent with the findings of Kassi et al. (Citation2019) in the context of Vietnam. The long-term estimation states that VND depreciation (POS) has a positive impact on CPI at the 1% level of statistical significance. In contrast, VND appreciation (NEG) has no impact on CPI due to its statistical insignificance. Therefore, the effect of the exchange rate on CPI is asymmetric. This conclusion is similar to that of the empirical research by Nasir, Citation2020).
4.1.5. Diagnostic check
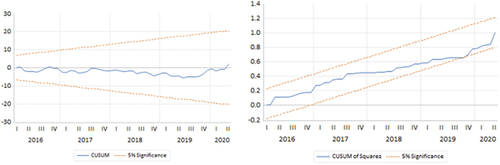
The diagnostic results for ARDL and NARDL are tabulated in Table . The F-bound test exceeded the critical bound support of the equation cointegration. The Error Correction Model (ECM) displayed a negative sign at the 1% significance level, implying a long-run relationship between the explanatory and explained variables. Next, to detect serial correlation in the ARDL model, the Breusch–Godfrey serial correlation LM test was used with the null hypothesis and determined that there was no serial correlation. As the value of Obs*R-squared is 3.13 or the probability is 0.21 larger than 5%, the null hypothesis was accepted and there was no serial correlation. The Breusch-Pagan-Godfrey test was used to detect heteroskedasticity with the null hypothesis and concluded that homoskedasticity exists. As the value of Obs*R-squared is 11.01 or the probability is 0.52 larger than 5%, this indicates that the null hypothesis was accepted or there was no heteroskedasticity. Similar results were obtained when applying the tests to the NARDL model. The serial correlation and heteroscedasticity tests appeared to be insignificant, indicating the absence of serial correlation and heteroscedasticity in both ARDL and NARDL models. The cumulative sum of recursive residuals (CUSUM) and CUSUM of squares test (CUSUMQ) were combined to examine parameter stability. The outputs indicated that the parameters were stable at CUMSUM and CUSUMQ.Footnote3 In summary, all the models satisfied all the indicators of the test, and for this reason, all the models were good.
Table 6. Diagnostic statistics
4.1.6. Threshold model
The existence of the threshold model was investigated based on the following hypothesis:
H0: Regression model does not exist in threshold
H1: Regression model exists in threshold
As indicated in , the bootstrap P-value for the four independent variables was less than 1%, the null hypothesis was rejected, and the alternative hypothesis was accepted. The model included thresholds for the exchange rate, money supply, oil, and output gap variables.
Table 7. The existence of the threshold model for exchange rate and money supply
To determine which factors caused the change in the CPI structure, a threshold estimation was conducted. The threshold time was detected based on the threshold value.
Table presents the number of orders and the threshold values of all variables, explaining the change in the CPI trend of Vietnam following Hansen’s (Citation1999) threshold regression technique. At the first threshold, the exchange rate was 9,938 and the money supply was 14.7505 in March 2011. Consequently, changes in the exchange rate and money supply affected the structural shift in CPI trends in June 2011. At Threshold 2, the change in money supply was worth 15.6150 in December 2015, before the structural shift in CPI by three months (March 2016). In contrast, the threshold values of the oil and output gap variables were not suitable for explaining the structural change in CPI because the time of the threshold was further from the structural change of CPI. In summary, changes in both the exchange rate and money supply indicated a change in the CPI structure with a 3-month lag. This conclusion is consistent with the results of the ARDL model and suggests that exchange rate and money supply are the two most crucial factors driving the change in inflation in Vietnam.
Table 8. Results of the threshold model with the threshold exchange rate and money supply variables
4.2. Conclusion and policy implications
Over the past few years, inflation control has been a priority in Vietnam. For this reason, the study of ERPT is important to Vietnam because it helps policymakers to develop solutions to stabilize the price level of the economy. We explored the relationship between the main determinants, such as exchange rate, money supply, oil price, output gap, and CPI. We also considered the change in the exchange rate mechanism to CPI. The NARDL model was applied to examine the asymmetry in the impact of the exchange rate on inflation in Vietnam. The empirical results of this study suggest that exchange rate is the most significant factor contributing to inflation in Vietnam. Specifically, a 1% depreciation of VND increased the CPI by 1.347% (c. p.). Next, a 1% increase in money supply increased the CPI by 0.127%. Changing the exchange rate mechanism from the conventional fixed peg arrangement to the central exchange rate lowered inflation by 0.042%. Additionally, a 1% increase in oil prices caused the CPI to increase by 0.041% (c. p.). Finally, changing the CPI structure is explained by the exchange rate and money supply.
The study provides the following policy implications based on the findings.
First, the ERPT is larger than one, which implies that depreciation of the Vietnamese currency would challenge price level stability. Therefore, policymakers should employ appropriate exchange rate tools to limit devaluation of the local currency.
Second, money supply has a significant impact on changes in Vietnam’s CPI. Hence, it is crucial to regulate money supply to reduce inflation and effectively regulate imports.
Finally, the government should maintain price controls on essential commodities such as gasoline and oil to reduce volatility of domestic CPI in the face of global economic shock.
Acknowledgements
“This research is funded by University of Economics and Law, Vietnam National University Ho Chi Minh City/VNU-HCM”
Disclosure statement
No potential conflict of interest was reported by the author(s).
Additional information
Funding
Notes on contributors
Nga Nguyen Hong
Nga Nguyen Hong is an Associate Professor in the Faculty of Economics, University of Economics and Law, Vietnam National University Ho Chi Minh City. His research interests include international economics and development economics. He has published several papers in quality domestic and international journals.
Loan Vo Thi Kim
Loan Vo Thi Kim is a Ph.D. at the Faculty of Basic Science, Van Lang University, Ho Chi Minh City, Vietnam. Her research interests include international economics, development economics, banking, and human resource management. She has published several papers in acclaimed domestic and international journals.
An Pham Hoang
An Pham Hoang is a Ph.D. at the Faculty of Accounting and Finance, Van Hien University, Ho Chi Minh City, Vietnam. His research interests include international economics, financial management, banking, and risk management.
Cuong Tran Quoc Khanh
Cuong Tran Quoc Khanh Tran is a lecturer at the Faculty of Business Administration, Van Lang University. His research interests include international economics, development economics, and international trade. He has published several papers in acclaimed domestic and international journals.
Notes
1. Please see Appendix 1 for more detail.
2. The estimation of the threshold model is conducted following the manual instruction of Stata at the website: https://www.stata.com/manuals/tsthreshold.pdf
3. Please see the appendix 2 for more detail.
References
- Abdulqadir, I. A., & Chua, S. Y. (2020). Asymmetric impact of exchange rate pass-through into employees’ wages in sub-Saharan Africa: Panel non-linear threshold estimation. Journal of Economic Studies, 47(7), 1629–17. https://doi.org/10.1108/JES-03-2019-0128
- Anh, V. T., Quan, L. T. T., Phuc, N. V., Chi, H. M., & Duc, V. H. (2018). Exchange rate pass-through in ASEAN countries: An application of the SVAR model. Emerging Markets Finance and Trade, 57(1), 21–34. https://doi.org/10.1080/1540496X.2018.1474737
- Arize, C. A., Malindretos, J., & Igwe, U. E. (2017). Do exchange rate changes improve the trade balance: An asymmetric nonlinear cointegration approach. International Review of Economics and Finance, 49, 313–326. https://doi.org/10.1016/j.iref.2017.02.007
- Beirne, J., & Bijsterbosch, M. (2011). Exchange rate pass-through in central and Eastern European EU Member States. Journal of Policy Modeling, 33(2), 241–254. https://doi.org/10.1016/j.jpolmod.2010.11.001
- Burstein, A., Eichenbaum, M., & Rebelo, S. (2007). Modeling exchange rate pass-through after large devaluations. Journal of Monetary Economics, 54(2), 346–368. https://doi.org/10.1016/j.jmoneco.2005.08.013
- Calvo, G., & Mishkin, F. (2003). The mirage of exchange rate regimes for emerging market countries. Journal of Economic Perspectives, 17(4), 98–120. https://doi.org/10.1257/089533003772034916
- Campa, M. J., & Goldberg, S. L., 2002. Exchange rate pass-through into import prices: A macro or micro phenomenon? (NBER Working Paper No. 8934). https://www.nber.org/papers/w8934.
- Campa, M. J., & Goldberg, S. L. (2005). Exchange rate pass-through into import prices. The Review of Economics and Statistics, 87(4), 679–690. https://doi.org/10.1162/003465305775098189
- Carriere-Swallow, Y., Bertrand, G., Magud, E., & Valencia, F., 2016. Monetary policy credibility and exchange rate pass-through. (IMF Working Papers 16/240). IMF Working Paper. https://www.imf.org/external/pubs/ft/wp/2016/wp16240.pdf
- Caselli, F. G., & Roitman, A. (2019). Nonlinear exchange-rate pass-through in emerging markets. International Finance, 2019, 1–28. https://doi.org/10.1111/infi.12344
- Cheikh, B. N., & Louhichi, W. (2016). Revisiting the role of inflation environment in exchange rate pass-through: A panel threshold approach. Economic Modelling, 52, 233–238. https://doi.org/10.1016/j.econmod.2014.11.004
- Cheikh, B. N., & Rault, C. (2017). Investigating first-stage exchange rate pass-through: Sectoral and macro evidence from euro area countries. The World Economy, 40(12), 2611–2638. https://doi.org/10.1111/twec.12499
- Choudhri, E. U., & Hakura, D. S. (2006). Exchange rate pass-through to domestic prices: Does the inflationary environment matter? Journal of International Money and Finance, 25(4), 614–639. https://doi.org/10.1016/j.jimonfin.2005.11.009
- Civcir, I., & Akcaglayan, A. (2010). Inflation targeting and the exchange rate: Does it matter in Turkey? Journal of Policy Modeling, 32(3), 339–354. https://doi.org/10.1016/j.jpolmod.2010.03.002
- Comunale, C., & Simola, H. (2018). The pass-through to consumer prices in CIS economies: The role of exchange rates, commodities and other common factors. Research in International Business and Finance, 44(2018), 186–217. https://doi.org/10.1016/j.ribaf.2017.07.076
- Corsetti, G., Dedola, L., & Leduc, S. (2008). High exchange rate volatility and low pass-through. Journal of Monetary Economics, 55(6), 1113–1128. http://dx.doi.org/10.1016/j.jmoneco.2008.05.013
- Dash, A. K., & Narasimhan, V. (2011). Exchange rate pass-through: How much do exchange rate changes affect the prices of Indian exports and imports. South Asia Economic Journal, 12(1), 1–23. https://doi.org/10.1177/139156141001200101
- Dornbusch, R. (1987). Exchange rates and prices. American Economic Review, 77(1), 93–106. http://www.nber.org/papers/w1769.pdf
- Du, Z., Li, J., & Pei, P. (2021). The impacts of China’s exchange rate regime reform in 2005: A counterfactual analysis. Rev Dev Econ. 25(1), 430– 448. https://doi.org/10.1111/rode.12718
- Elgammal, M. M., & Eissa, A. M. (2016). Key determinants of inflation and monetary policy in the emerging markets: Evidence from Vietnam . Afro-Asian Journal of Finance and Accounting, 6(3), 210–223. https://doi.org/10.1504/AAJFA.2016.079256
- Frankel, J., Parsley, D., & Wei, J. (2012). Slow pass-through around the World: A new import for developing countries? Open Economies Review, 23(2), 213–251. https://doi.org/10.1007/s11079-011-9210-8
- Goldberg, P. K., & Knetter, M. M. (1997). Goods prices and exchange rates: What have we learned? Journal of Economic Literature, 35, 1243–1272. http://www.nber.org/papers/w5862.pdf
- Hansen, B. (1999). Threshold effects in non-dynamic panels: Estimation, testing, and inference. Journal of Econometrics, 93(2), 345–368. https://doi.org/10.1016/S0304-4076(99)00025-1
- Ho, S. H., & Idir, A., 2020. Asymmetric exchange rates pass-through: New evidence from Vietnam. MPRA Paper 98651, University Library of Munich, Germany.
- Jiménez-Rodríguez, R., & Morales-Zumaquero, A. (2016). A new look at exchange rate pass-through in the G-7 countries. Journal of Policy Modeling, 38(5), 985–1000. https://doi.org/10.1016/j.jpolmod.2016.06.007
- Kabundi, A., & Mlachila, M. (2019). The role of monetary policy credibility in explaining the decline in exchange rate pass-through in South Africa. Economic Modelling, 79, 173–185. https://doi.org/10.1016/j.econmod.2018.10.010
- Kassi, F. D., Sun, G., Ding, N., Rathnayake, N. D., & Assamoi, R. G. (2019). Asymmetry in exchange rate pass-through to consumer prices: Evidence from emerging and developing Asian countries. Economic Analysis and Policy, 62, 357–372. https://doi.org/10.1016/j.eap.2018.09.013
- Khachatryan, G. A., & Grigoryan, A. (2020). Export growth dynamics and real exchange rate: Evidence from Armenia. International Economic Journal, 34(3), 493–509. https://doi.org/10.1080/10168737.2020.1750045
- Kurtović, S., Siljković, B., Denić, N., Petković, D., Mladenović, S. S., Mladenović, I., & Milovancevic, M. (2018). Exchange rate pass-through and Southeast European economies. Physica A: Statistical Mechanics and Its Applications, 503, 400–409. https://doi.org/10.1016/j.physa.2018.03.005
- Lado, E. P. Z. (2015). Test of the relationship between exchange rate and inflation in South Sudan: Granger-causality approach. Economics, 4(2), 34–40. https://doi.org/10.11648/j.eco.20150402.13
- Lan, T. M. N., Papyrakis, E., & Bergeijk, A. G. P. (2019). Assessing the price and output effects of monetary policy in Vietnam: Evidence from a VAR analysis. Applied Economics, 51(44), 4800–4819. https://doi.org/10.1080/00036846.2019.1602708
- Levy-Yeyati, E., & Sturzenegger, F. (2003). To float or to fix: Evidence on the impact of exchange rate regimes on growth. American Economic Review, 93(4), 1173–1193. https://doi.org/10.1257/000282803769206250
- Liu, Y. H., Chen, L. X., & Elliott, C. (2017). The imported price, inflation and exchange rate pass-through in China. Cogent Economics & Finance, 5(1), 1–13. https://doi.org/10.1080/23322039.2017.1279814
- McCarthy, J. (2007). Pass-through of exchange rates and import prices to domestic inflation in some industrialized economies. Eastern Economic Journal, 33(4), 511–537. http://dx.doi.org/10.1057/eej.2007.38
- Mendonça, H. F., & Tiberto, B. P. (2017). Effect of credibility and exchange rate pass-through on inflation: An assessment for developing countries. International Review of Economics & Finance, 50, 196–244. https://doi.org/10.1016/j.iref.2017.03.027
- Minh, V. V., 2009. Exchange rate pass-through and its implications for inflation in Vietnam, (VDF Working Paper No. 0902). VDF Working Paper. http://www.vdf.org.vn/workingpapers/vdfwp0902
- Nasir, M. A. (2021). Zero lower bound and negative interest rates: Choices for monetary policy in the UK. Journal of Policy Modeling, 43(1), 200–229. https://doi.org/10.1016/j.jpolmod.2020.03.014
- Nasir, M. A., Huynh, T. L. D., & Vo, X. V. (2020). Exchange rate pass-through & management of inflation expectations in a small open inflation targeting economy. International Review of Economics & Finance, 69, 178–188. https://doi.org/10.1016/j.iref.2020.04.010
- Nasir, M. A., & Vo, X. V. (2020). A quarter century of inflation targeting & structural change in exchange rate pass-through: Evidence from the first three movers. Structural Change and Economic Dynamics, 54, 42–61. https://doi.org/10.1016/j.strueco.2020.03.010
- Olowofeso, O. E., Adeboye, A. A., Adejo, V. T., Bassey, K. J., & Abraham, O. (2017). Agricultural sector credit and output relationship in Nigeria: Evidence from nonlinear ARDL. CBN Journal of Applied Statistics, 8(1), 101–122.
- Ozkan, I., & Erden, L. (2015). Time-varying nature and macroeconomic determinants of exchange rate pass-through. International Review of Economics & Finance, 38, 56–66. https://doi.org/10.1016/j.iref.2015.01.007
- Pesaran, M. H., Shin, Y., & Smith, R. J. (2001). Bounds testing approaches to the analysis of level relationships. Journal of Applied Econometrics, 16(3), 289–326. https://doi.org/10.1002/jae.616
- Pham, V. A. (2019). Exchange rate pass-through into inflation in Vietnam: Evidence from VAR model. Journal of Economics and Development, 21(2), 144–155. https://doi.org/10.1108/JED-07-2019-0013
- Pham, T. A. T., Nguyen, T. T., Nasir, M. A., & Huynh, T. L. D. (2020). Exchange rate pass-through: A comparative analysis of inflation targeting & non-targeting ASEAN-5 countries. The Quarterly Review of Economics and Finance. https://doi.org/10.1016/j.qref.2020.07.010
- Phuc, V. N., & Duc, H. V. (2019). Macroeconomics determinants of exchange rate pass-through: New evidence from the Asia-Pacific Region. Emerging Markets Finance and Trade, 1–16. https://doi.org/10.1080/1540496X.2018.1534682
- Prasertnukul, W., Kim, D., & Kakinaka, M. (2010). Exchange rates, price levels, and inflation targeting: Evidence from Asian countries. Japan and the World Economy, 22(3), 173–182. https://doi.org/10.1016/j.japwor.2010.03.002.
- Przystupa, J., & Wróbel, E. (2011). Asymmetry of the exchange rate pass-through. Eastern European Economics, 49(1), 30–51. https://doi.org/10.2753/EEE0012-8775490103
- Razafimahefa, F. I., 2012. Exchange rate pass-through in Sub-Saharan African economies and its determinants? (IMF Working Paper No. WP/12/141). IMF Working Paper. https://www.imf.org/external/pubs/ft/wp/2012/wp12141.pdf.
- Rodrik, D. (2008). The real exchange rate and economic growth. Brookings Papers on Economic Activity, 2, 365–412.
- Samuel Elias Kayamo. (2021). Asymmetric impact of real exchange rate on inflation in Ethiopia: A non-linear ARDL approach. Cogent Economics & Finance, 9(1). https://doi.org/10.1080/23322039.2021.1986931
- Shin, Y., Yu, B., & Greenwood-Nimmo, M. (2014). Modelling asymmetric cointegration and dynamic multipliers in a nonlinear ARDL framework. In Robin C. Sickles, & William C. Horrace (Eds.), Festschrift in honor of Peter Schmidt (pp. 281–314). Springer.
- Soon, V. S., Baharumshah, Z. A., & Wohar, E. M. (2018). Exchange rate pass-through in the Asian countries: Does inflation volatility matter? Applied Economics Letters, 25(5), 309–312. https://doi.org/10.1080/13504851.2017.1319553
- Taylor, J. B. (2000). Low inflation, pass-through, and the pricing power of firms. European Economic Review, 44(7), 1389–1408. https://doi.org/10.1016/S0014-2921(00)00037-4
- Tho, N. T., & Trang, N. T. N. (2016). Exchange rate pass-through in Vietnam under the impact of inflationary environment. Journal of Economic Development, 23(3), 89–109. https://doi.org/10.24311/jed/2016.23.3.08
- Vogelsang, T. J. (1993). Essays on testing for nonstationarities and structural change in time series models. Princeton University. Ph.D. Dissertation.
- Vo, A. T., Ho, C. M., & Vo, D. H. (2019). Understanding the exchange rate pass through to consumer prices in Vietnam: The SVAR approach. International Journal of Emerging Markets, 15(5), 971–989. https://doi.org/10.1108/IJOEM-10-2018-0551
- Yanamandra, V. (2015). Exchange rate changes and inflation in India: What is the extent of exchange rate pass-through to imports? Economic Analysis and Policy, 47, 57–68. https://doi.org/10.1016/j.iref.2020.07.009
- Yi, S., & Xiao-li, A. (2018). Application of threshold regression analysis to study the impact of regional technological innovation level on sustainable development. Renewable and Sustainable Energy Reviews, 89, 27–32. https://doi.org/10.1016/j.rser.2018.03.005
Appendix 1
The Wald test for investigating the structural change of CPI in 06/2011 and 03/2016, with the null hypothesis H0 and the alternative hypothesis H1, is as follows:
H0: There is no structural change in June 2011 and March 2016
H1: There is a structural change in June 2011 and March 2016
Chi2(4) = 66.0275
Prob > chi2 = 0.0000
As the probability of chi square is 0.00 < 0.05, the null hypothesis is rejected. As a result, a structural change occurred between June 2011 and March 2016.
Appendix 2
Cumulative sum of recursive residuals (CUSUM) and CUSUM of squares test (CUSUMQ) in ARDL and NARDL models
Figure A1. CUSUM and CUSUMQ in ARDL model.
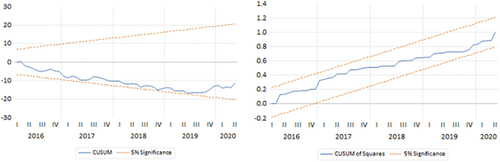
Figure A2. CUSUM and CUSUMQ in NARDL model. As the CUSUM and CUSUMQ lines were within the 5% significance level, the outputs signified that the parameters were stable.