
 ?Mathematical formulae have been encoded as MathML and are displayed in this HTML version using MathJax in order to improve their display. Uncheck the box to turn MathJax off. This feature requires Javascript. Click on a formula to zoom.
Abstract
Government spending on human capital continues to increase over the years. However, knowledge of the efficiency of such spending is limited. Using data from World Bank’s World Development Indicator and World Governance Indicator from 2006 to 2017 and Data Envelopment Analysis and DEA Bootstrapping models, the study examined the relative technical efficiencies of public spending on human capital and their correlates in Africa. The study found public spending on health and education in Africa to be inefficient. Efficiency was much higher in health spending than in educational spending. Factors such as institutional quality, economic growth, government expenditure, foreign direct investment, and trade openness were found to influence the efficiency of public spending on human capital. Government should put in place measures to stimulate trade, ensure institutional quality and growth of urbanization to help improve efficiency in public spending.
1. Introduction
Public spending on human capital development through education and health in developing countries has captured the attention of numerous researchers and development partners due to its critical role in economic growth (Fahimi et al., Citation2018), individual well-being (Currie, Citation2009), economic development (Suri et al., Citation2011), and poverty reduction in general (Okorie Nathan, Citation2016). Human capital is an intangible asset that workers require to increase productivity and well-being (Goldin, Citation2016). This study seeks to examine public spending on human capital in Africa from 2006 to 2017 with the purpose of contributing to the debate on efficiency of public spending on health and education sectors in Africa.
Human capital is defined as the knowledge and skills acquired via education, experience, and health care (Becker, Citation1962; Schultz, Citation1961). The difficulty in measuring new learning and training calls for the use of education and health status as the common measure of human capital in the literature (Ogundari & Abdulai, Citation2014; Ogundari & Awokuse, Citation2018a). Education and health are significant components of human capital since they have direct and indirect effects on productivity and economic growth.
The value placed on human capital has resulted in an increase in resource allocation to education and health in African countries (Eggoh et al., Citation2015; Ogundari & Awokuse, Citation2018b). In April 2001, African Union member states pledged to invest at least 15% of their annual budget to health sector improvement and urged donor countries to step up support (Union, Citation2007). In Africa, public health expenditure is projected to be between 1% and 16% of GDP. Sierra Leone spent between 15% and 16% of GDP between 2002 and 2011, while Ghana spent between 4% and 7% of GDP on the health sector during the same period (WDI, 2014). Public investment in education has also increased significantly in recent years. African countries place a high premium on education, allocating an average of 16% of their budgets to it. Between 2006 and 2009, Ghana budgeted 23.1% of its resources in the educational sector. This increased to 30% and 37.52% in 2011 and 2012, respectively.
However, the outcomes in these sectors still need improvement when compared to other regions. According to the WHO report in African Bulletin (2019), maternal and child mortality rates are high in the African region. Globally, 19 of the 20 countries with the highest maternal mortality rates are in Africa, while 50% of children under 5 who die from pneumonia, diarrhea, measles, HIV, tuberculosis, and malaria are of African descent (Organization, Citation2019). According to a report from UNESCO, Africa has the highest rate of educational exclusion, although it spends a large part of its GDP on education (UNESCO, Citation2016). Over a fifth of children between the ages 11 and 16 do not attend school, followed by a third of young people between ages 12 and 14.
This indicates that increasing spending on health and education alone does not necessarily bring positive results, but the effective and efficient use of these resources (Chan & Karim, Citation2012; Chan et al., Citation2017; Esanov & Kuralbayeva, Citation2011). Efficiency of public spending is defined as the ability of a government to maximize its economic activities to the level of spending or the ability of the government to minimize its spending to the level of economic activity (Afonso & Fernandes, Citation2003; Gupta & Verhoeven, Citation2001). The government needs to spend the money raised by taxpayers efficiently in important sectors of the economy as it is accountable to its citizens. In this context, the concept of efficiency evaluates the allocation of resources in a country, which is developing human capital.
Government spending on human capital (Health and Education) continues to increase over the years (Eggoh et al., Citation2015); however, little is known about the efficiency of such spending (Gupta & Verhoeven, Citation2001). The inadequate information about governments spending efficiency on human capital does not only undermines a critical evaluation of the outcomes of such spending but also raises concerns on the size of government. The few empirical papers on public spending efficiency (e.g., Afonso & Kazemi, Citation2017; Dutu & Sicari, Citation2016; Herrera Aguilera & Ouedraogo, Citation2018; Kosor et al., Citation2019), have generally not focused on Africa (Gupta & Verhoeven, Citation2001), making it difficult to properly situate issues concerning efficiency of public spending in the African context. To help address this problem and fill the gap created in the empirical literature, this study employ a dataset from 2006–2017 to determine the efficiency of public spending on human capital in Africa. Again, previous studies have only determined the average efficiencies due to th lack of data (Afonso et al., 2010; Afonso & Fernandes, Citation2003; Afonso & St. Aubyn, Citation2011; Gupta & Verhoeven, Citation2001), making it difficult to appreciate the dynamics relationship over time. The study fills this gap by determining the annual differences in the efficiency of public spending on human capital to appreciate the dynamics relationship over time. The study is the first to employed the DEA bootstrapping approach proposed by Simar and Wilson (Citation2020) to determine the correlates of public spending efficiency in Africa. This study concentrated on human capital (education and health) due to the critical role human capital plays in economic growth and development.
2. Literature review
It is interesting to note that, studies on spending efficiency have centered on Europe, Latin America, and Asia with little emphasis on Africa. For instance, Kosor et al. (Citation2019) covered 28 European countries on the efficiency of public spending on higher education. Using the DEA and the latest available data, the study found that average spending efficiency is high, although there were large differences between countries in efficiency ratings. The study identified Bulgaria, Hungary, Ireland, Luxembourg, and Malta as the five most efficient countries. Even though this study makes a great contribution to literature, data limitations prevented the researchers from making functional cross-country comparisons. Also, Ouertani, Naifar, Ben Haddad et al. (Citation2018) assessed the efficiency of government spending on education, health, and infrastructure, by measuring the relative efficiency of Saudi Arabia’s public spending over the period 1988–2013 using a non-parametric approach.
Using the DEA bootstrap, the result of the study indicated that, on average, public spending is inefficient, implying Saudi Arabia can improve its health, education, and infrastructure performance without increasing spending. An empirical explanation of the inefficiency results using the DEA bootstrap analysis showed that unemployment and broad money negatively impact government spending, mainly in the case of infrastructure and health care.
Again, Mohanty and Bhanumurthy (Citation2018) attempted to measure the efficiency of government spending on the social sector, particularly health and education, among Indian states using various DEA approaches. Their results suggest that states spend their resources more efficiently on education than on health and all of the social sector spending. It also found that both the quality of governance and economic growth affect the effectiveness of education, health, and the social sector, with governance having a greater impact than growth.
Added to the above, Smaoui and Kammoun (Citation2019) also argued that the education sector generates economic growth with appropriate use of the allocated costs. Therefore, the mission of the university is no longer limited to the production and dissemination of knowledge and skills but extends to training and professional integration. For this reason, public spending on educational services is a very important part of total public spending in Tunisia. Using the DEA model and higher education data to calculate efficiency scores for the 1971/2015 period, the study found that educational services are inefficient and therefore public spending in these sectors is not of good quality.
Afonso and Kazemi (Citation2017) looked at the public spending of 20 OECD countries for the period 2009 to 2013 from an efficiency perspective. The study produced indicators of public sector performance and public sector efficiency and used DEA. The results showed that the only country performing at the efficiency frontier were Switzerland, Canada, Japan, Luxembourg and the United States, which were also more efficient. The average input-oriented efficiency value is 0.732. That is, states were able to cut public spending by an average of 26.8% and still get the same public performance. The average efficiency-based score is 0.769, which means that the countries in the sample increased their performance by an average of 23.1% using the same public spending.
Ahec Šonje et al. (Citation2018) examined the efficiency of public spending on secondary and higher education in the new Member States (NMS) in the EU. Using DEA to assess the relative technical efficiency of public spending on secondary and higher education in the new Member States, the result showed that inefficiency is high for public spending on education in Croatia.
Jakovljevic et al. (Citation2021) in their qualitative study of the global south report that the participation of the international pharmaceutical sector, whose long-term market access strategies continue to focus on investments in East Asia and ASEAN countries, added to the remainder. The creation of effective health policies for the present still requires an understanding of the past. Since these nations’ early modern health systems were established, political economics has shaped the development of the health funding landscape. Earlier Jakovljevic et al. (Citation2020), evaluated how well-leading Asian economies used their healthcare budgets. Based on the strength of their economic output and long-term real GDP growth rates using healthcare systems from 1996 to 2017. The findings of the study show that Japan performs better than the other countries in the sample in terms of key healthcare performance measures, with South Korea coming in second.
3. Methods
3.1. Data envelopment analysis (DEA)
The study used the nonparametric Data Envelopment Analysis (DEA) to estimate the technical efficiency values for decision-making units (DMUs) with similar inputs and outputs. The advantage of using DEA is that inefficiency results can be evaluated without specifying a normally unknown threshold function. The DEA approach can also be used with multiple inputs and multiple outputs. This technique helps evaluate and compare how efficient DMUs use available resources to generate a range of results. DMUs can include corporations, colleges, industry, banks, schools, hospitals, government agencies, tax authorities, and prisons, among others.
Following Ouertani et al. (Citation2018), this study used the African countries as the DMUs. Farrell (Citation1957) first introduced the approach but later formalized by Charnes et al. (Citation1978). Initially known as the CCR Model (Charnes, Cooper and Rhodes), now known as the Constant Return to Scale (CRS). This has been demonstrated by Banker et al. (Citation1984) to include Variable Returns to Scale (VRS). This study used the variable returns to scale DEA approach since it is an improvement on the CRS. There are two orientations in the DEA model: input-oriented and output-oriented DEA. With input-oriented, the linear programming model is formed to determine how much input DMU usage can be contracted when used efficiently to achieve the same output level, while the output-oriented determines the potential output DMU achieved to its inputs when effectively acting as a DMU on the verge of best practice frontier.
This study took an input-oriented approach as the government is seen to have more control over inputs (public spending) than the outcomes. The approach is based on the convexity of the production frontier. The estimated frontier thus “envelopes” all available observations, and any deviation from this frontier is interpreted as an inefficient combination of inputs and/or outputs. Following Afonso and Kazemi (Citation2017) and Ouertani et al. (Citation2018) the study assumes there are I Decision-Making Units (DMU), and each DMU uses k inputs to produce M outputs. If X is the k × I input matrix and Y is the M × I output matrix for all the I DMUs, then is an input column vector and
is an output column vector for the ith DMU. So for a given DMU, the DEA model is as follows:
Where is a scalar that satisfies measure the distance between a country and the efficiency frontier, defined as a linear combination of the best practice observations. If
denotes inefficiency, and the year (DMU) is inside the frontier while a shows efficiency and it means the year (DMU) is on the frontier. The vector
measures the weights employed to compute the location of an inefficient DMU if it were to become efficient, hence, maximizing productivity. The inefficient DMU can theoretically be on the production frontier as a linear combination of those weights, related to the peers of the inefficient DMU. The peers are other DMUs that are more efficient and used as references for the inefficient DMU. The constraint
is the convexity restriction imposed on the variable returns to scale DEA model.
3.2. Input and output variable selection
The selection of input and output variables is very important in the frontier approach as they influence decision-making. This study followed the works of Herrera Aguilera and Ouedraogo (Citation2018) and Ouertani, Naifar, Ben Haddad et al. (Citation2018) to select input and output variables. Country comparisons require a certain homogeneity of production technology for health and education across countries. There are two specific aspects where the assumption of homogeneity is important. First, the comparison assumes that there are a small number of production factors that are the same in all countries. Second, the comparison requires that the quality of the inputs be the same, with the efficiency estimates skewed in favor of countries where the quality is higher. Factor heterogeneity is not a problem if it is evenly distributed across countries. It will be problematic if there are differences between countries in the average quality of the factors (Farrell, Citation1957). This study does not impose this restriction as all countries are located on the African continent and it is assumed that the majority of both production technologies are used equally in all countries.
Studies such as Herrera Aguilera and Ouedraogo (Citation2018) used public spending on health and education as the input variable, while life expectancy, maternal mortality rate and infant mortality ratio were used as output variables for the health sector and gross enrollment in primary school, gross enrollment in secondary schools as output variables for the education sector. The rationale for selecting these variables is based on the fact that public spending on health and education has a significant effect on both health and education outcomes (Bein, Citation2020).
3.3. Simar and Wilson DEA Bootstrapping Method
Many empirical works have used OLS technique (Fonchamnyo & Sama, Citation2016b), Tobit estimation technique (Dobdinga et al. Citation2016) or the fractional logit estimation technique (Papke & Wooldridge, Citation1996) to determine the correlates of technical efficiency scores. Following the works of Ouertani, Naifar, Ben Haddad et al. (Citation2018), Fonchamnyo and Sama (Citation2016b), and Simar and Wilson (Citation2007), DEA model is used to estimate the technical efficiency scores, then the correlates of technical efficiency scores are determined as stated in Equationequation (2)(2)
(2) .
where represent the variable returns to scale technical efficiency score. It ranges from zero (0) representing complete inefficiency to one (1) representing complete efficiency. Urban represents urban population which indicates people living in urban areas as defined by national statistical offices. Economic Growth (Growth) shows the annual percentage growth rate of GDP per capita based on constant local currency. The study included the squared term of the growth variable (GrowthSQ) to determine how public spending efficiency on human capital changes throughout a country’s stages of growth and development. This variable was included to determine the long-run effect of economic growth on public spending efficiency. Government Expenditure (GovtExp) was used to proxy for the size of the public sector in this study. Inflation, as measured by the consumer price index, reflects the annual percentage change in the cost to the average consumer of acquiring a basket of goods and services that may be fixed or changed at specified intervals, such as yearly (). Foreign Direct Investment (FDI) reflects the net inflows of investment to acquire a lasting management interest of 10% or more of voting stock in an enterprise operating in an economy other than that of the investor. Trade openness (Openness) (exports and imports as a share of GDP). This indicator proxies the degree of international competition over labour and capital that would penalize public inefficiency disproportionately. An additive index was created from the six governance indicators (control of corruption, voice and accountability, political stability, governance effectiveness, regulatory quality and rule of law) to control for institutional quality variable (). This variable measures the extent to which a country’s policy and institutional frameworks can ensure efficient allocation of resources. The study included the squared term of institutional quality (Inst_QtySQ) to indicate how public spending efficiency changes with time with better institutional policies and frameworks. This is because as institutions grow and become better, it should have the ability to fight against social vices such as corruption which diverts public spending from social priorities, mismanagement of resources, depletion of nation’s wealth and transfers state resources into private gains at the expense of the collective masses (Malyniak et al., Citation2019)
Table 1. Input and output variables
Table 2. Summary of variable definition, expected sign and data source
When technical efficiency ratings are examined using the conventional two-step process, two main issues typically surface. Specifically, improper censored regression and false conclusions are caused by a lack of a well-specified data generation procedure. Simar and Wilson (Citation2007) suggested a twofold bootstrapping DEA method that is based on statistical theory to address these issues. The two-step approach, which is preferred to the conventional two-step approach, uses a properly informed data generating process and a parametric bootstrap approach. The following is an analysis of the correlates of public spending efficiency on human capital in Africa conducted by the study using the algorithm I as given by Simar and Wilson (Citation2007):
Compute
for all DMUs I = 1, …, N using DEA
Use those K (with
Loop over the following steps I to III B times to obtain a set of B bootstrap estimates
(I)For each DMU
(II)Calculate artificial efficiency scores
(III)Run a truncated regression (left truncated at 1) of
Calculate confidence intervals and standard errors for
The study presented the Tobit regression model alongside the Simarwilson DEA bootstrapping model for robustness check.
3.4. Source of data
This study mainly used data from the World Bank’s world development indicator (WDI) to analyze the objectives. However, variables used to create an index to proxy for institutional quality were sourced from the world governance indicator (WGI). The study used data from 2006 to 2017 for its analysis. The study relied on 16 African countries for its analysis because of data availability. These are Burkina Faso, Burundi, Cape Verde, Cameroon, Ethiopia, Ghana, Guinea, Madagascar, Mali, Mauritania, Mauritius, Niger, Rwanda, Sao Tome and Principe, Senegal and Tunisia. These countries were selected based on data availability.
4. Results
4.1. Technical efficiency scores for health and education
Table presents the technical efficiency scores estimated for public health spending and public expenditure on education in Africa. The efficiency scores range from zero signifying total inefficiency to one implying complete efficiency. The overall average efficiency score for public spending on health was found to be 0.692 (69.2%) which is higher than the overall average efficiency score of 0.510 (51.0%) for education in the selected African countries. Tunisia ranked first in health efficiency with a score of 97.2% but ranked eighth in education efficiency with a score of 46.5%. Mauritania ranked second in health efficiency with a score of 95.6% but ranked sixth in education efficiency with a score of 62.5%. Mauritius ranked third in both health and education efficiencies with a score of 91.9% and 73.3% respectively. On education efficiency, Madagascar tops the rank, but it is ranked 11th on health spending efficiency, while Guinea takes the 2nd position on education spending efficiency and still ranked 4th in health spending efficiency. Thus, Mauritius seem to have a high-efficiency level in both health and education spending and are more likely to have high efficiency in overall human capital spending than Tunisia and Madagascar which tops one side but performs poorly (or averagely) on the other side.
Table 3. Technical efficiency scores on human capital development
Figure presents efficiency of public spending on health trend from 2006 to 2017 for the selected countries. It indicated that few countries were able to achieve complete efficiency with a score of one (1) in some of the years. However, countries such as Burkina Faso, Burundi, Cape Verde, Cameroon, Ethiopia, Ghana, Madagascar, Niger, Rwanda, and Sao Tome and Principe were found have efficiency score below one, representing inefficiency in all the years under review. None of the countries showed a monotonic trend except Rwanda which showed an increasing trend in efficiency of public spending on health.
Figure 1. Efficiency of public spending on health.
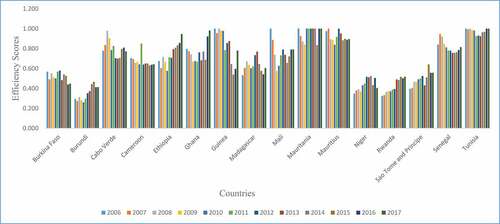
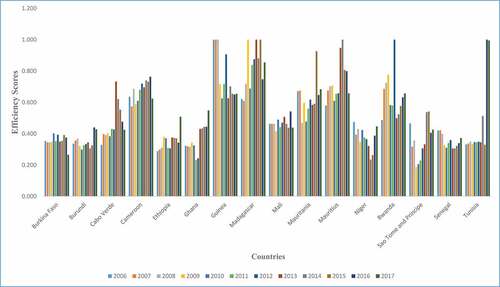
Figure also shows the trend analysis for efficiency of public spending on education in Africa. Similar to the health efficiency, few countries were found to achieve efficiency scores of one in some of the years for education. This includes countries such as Guinea, Madagascar, Mauritius, Rwanda and Tunisia. All the other countries were found to have efficiency score below 1 representing inefficiency in any of the years.
Figure 2. Efficiency of public spending on education.
4.2. Regression results of efficiency of public spending on human capital
Table presents the Simarwilson DEA bootstrapping model results. The Tobit regression model was presented alongside for robustness check. The dependent variables are efficiency of public spending on health and education as presented in all the models. The results from the Tobit and Simarwilson DEA truncated estimations show that the model is robust since the signs and significant levels for all the variables are the same. Table presents differences in the number of observations for the Tobit and Simar and Wilson model. The Tobit model presents 175 as the number of observation because of the missing values for the openness variable which is 175. Also, the differences in the number of efficient DMUs (Countries) in the Simar and Wilson truncated DEA model explains the differences in the number of observations in the Simarwilson model for health and education in Table .
Table 4. Regression results on efficiency of public spending on health and education
From Table , urbanization was found to have a positive significant relationship with efficiency of public spending on health at a 1% significant level. Additionally, at 5% significant level, economic growth was found to have a negative relationship with the efficiency of public expenditure on health; however, the squared term for economic growth was found to have a positive significant relationship with efficiency of public spending on health at 10% significant level. A percentage increase in economic growth decreases the efficiency of public spending on health by 0.081% but a percentage increase in the squared term of economic growth increases efficiency of public spending on health by 12.479%.
Government expenditure was also found to have a negative significant effect on the efficiency of public spending in both health and education. The result indicates that a percentage increase in government expenditure will lead to a decrease in efficiency of public spending on health outcomes by 2.012% and education outcomes by 1.243%, suggesting that public sector inefficiency may be higher in the educational sector than health sector for the study sample. Also, the study found foreign direct investment (FDI) to have a negative significant relationship with the efficiency of the public spending in the health sector at 5% level but was not significant for public spending efficiency on education. Trade openness was positively associated with efficiency of public spending on health at 1% alpha level and education at 5% alpha level. International trade tends to make countries more competitive hence the need to be efficient in spending. A percentage increase in openness has the tendency to improve efficiency of public spending on health and education by 0.596% at 1% significant level and 0.252% at 5% significant level, respectively, all other things being constant.
Finally, institutional quality was found to have a negative significant relationship with public spending on education at 5% significant level. However, the squared term of institutional quality has a positive significant relationship with public spending efficiency on education. As shown in Table , a percentage increase in institutional quality leads to a decrease in efficiency of public spending on education by 1.471% at 1% alpha level, but a percentage increase in the squared term of institutional quality leads to an increase in efficiency of public spending on education by 1.467% at 1% alpha level, all other things being constant.
Also, Figure shows a graphical presentation of the relationship between economic growth and efficiency of public spending on health. The results show that as economic growth increases with time, efficiency of public spending on health also increases.
Figure 3. Margins plot showing the relationship between economic growth and efficiency of public spending.
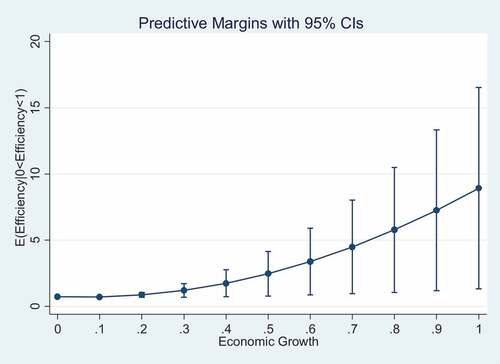
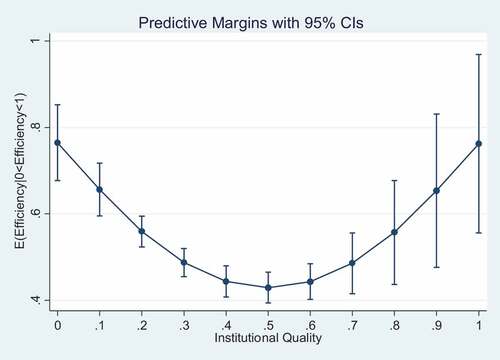
Figure shows the relationship between institutional quality and efficiency of public spending on education. The results indicate that institutional quality initially shows a negative relationship with efficiency of public spending on education; however, at 50% level of institutional quality, the relationship changes to positive indicating that institutional quality can improve efficiency of public spending on education from 50% and above.
Figure 4. Margins plot showing the relationship between institutional quality and efficiency of public spending.
5. Discussions
This study used data from 2006 to 2017 to examine public spending efficiency on human capital using DEA. The results of the study show higher technical efficiency score for public expenditure for health compared to education can be attributed to the fact that health issues are considered a priority in many African countries since it bothers on life. Further, the health sector is subjected to stricter monitoring compared to the educational sector, hence, the higher efficiency compared to the educational sector. The health sector permit lower wastage of resources compared to the educational sector. Based on this, therefore, governments are likely to be stricter and design more strengthen regulations and monitoring systems of the funds allocated to that sector compared to the education sector. Further, the study report that the overall spending on health and education was not efficient. This finding is consistent with other studies such as António Afonso et al. (2010); Fonchamnyo and Sama (Citation2016a); Herrera and Pang (Citation2005) which also found public spending on health and education to be inefficient in developing economies. This study also found the efficiency of public spending on health to be higher than efficiency of public spending on education. This implies that funds allocated to the health sector are more efficiently utilized than funds allocated to the education sector. The study showed that, Mauritius seem to have a high-efficiency level in both health and education spending and are more likely to have high efficiency in overall human capital spending than Tunisia and Madagascar which tops one side but performs poorly (or averagely) on the other side.
The low values of institutional quality show that institutions on the African continent are not of a good quality and are not transparent. This finding is consistent with a report by Transparency International (2020) on the quality of institutions in Africa which indicated that Africa is the worst-performing region on their institutions; hence, the high level of corruptions and on the Corruption Perception Index (CPI). Furthermore, most part of the African continent is predominantly rural which goes to confirm why the African continent is identified to be agrarian in nature.
The positive significant effect of urbanization on efficiency of public spending on health is consistent with those conducted by Herrera Aguilera and Ouedraogo (Citation2018) who found a positive significant relationship between efficiency of public spending and urbanization. The result indicates that the clustering of agents makes it cheaper to provide certain services in urbanized areas.
Economic growth has a negative relationship with public spending efficiency on health, but the squared (economic growth) has a positive significant on the efficiency of public spending on health. At the initial levels of economic growth, much attention is not given to the efficiency of public spending, nevertheless, to consolidate economic growth with time, attention is given to the efficiency of public health expenditure.
Government expenditure has a negative significant effect on the efficiency of public spending in both health and education, but public sector inefficiency is higher in the educational sector than health sector for selected African countries. This study confirms the findings of Jarasuriya and Woodon (Citation2003) who also found a negative relationship between government expenditure and public spending efficiency. Thus, the lesser the size of the government, the more the efficiency of government spending. However, the findings of this study contradict a study conducted by Xu et al. (Citation2003) who found a positive relationship. Filmer and Pritchett (Citation1999) also found no significant impact between government expenditure and public spending efficiency.
Foreign direct investment (FDI) has a negative significant relationship with the efficiency of the public spending in the health sector but not on the efficiency of public spending on education. This is because when a foreign investor squeezes out domestic firms and becomes monopolized, it can lead to productive inefficiency since they can easily cost to cover up their inefficiencies by setting higher prices. However, these findings are not consistent with most of the studies in the literature (Zhang et al. Citation2019). Zhang et al., (Citation2019) found a positive relationship between FDI and efficiency of government environmental spending. The study indicated that FDI that comes in the form of technology transfer tends to improve health and education outcomes in the host country (Zhang et al. Citation2019).
Institutional quality has a negative significant effect on the efficiency of public spending on education, but the squared term of institutional quality has a positive significant effect on efficiency public spending on education. This shows that institutional quality at the initial stages may have a negative relationship with public spending efficiency; however, with time, as institutions grow and become better, public spending efficiency can be ensured.
6. Conclusion and recommendations
The study examined the efficiency of public spending on health and education and also determined the correlates of efficiency of public spending on health and education. The DEA results revealed that the overall efficiency of public spending on both health and education was not efficient; however, individually, the efficiency of public spending on health was found to be higher than efficiency of public spending on education. The Simarwilson DEA bootstrapping model also found variables such as government expenditure and trade openness to be significant for both efficiency of public spending on health and education, however, variables such as urbanization, economic growth, foreign direct investment were found to have a statistically significant relationship with public spending efficiency on health, while institutional quality was found to have a statistically significant relationship with efficiency of public spending on education. Inflation was found not to have a significant relationship with both public spending efficiency on health and education. The study recommends that the central government and the ministry of education should put in place appropriate measures to strengthen institutions and also sustain economic growth to improve efficiency in spending. African governments must ensure the growth of urbanization since it was found to improve efficiency. Urban citizens are normally enlightened as compared to their rural counterparts, hence, are in the best position to put the government in check regarding its spending. Government should put in place measures to stimulate trade to help improve efficiency in productivity and spending.
Disclosure statement
No potential conflict of interest was reported by the author(s).
Additional information
Funding
References
- Afonso, A., & Fernandes, S. (2003). Efficiency of local government spending: Evidence for the Lisbon Region. Available at SSRN 470481. https://www.repository.utl.pt/bitstream/10400.5/2732/1/wp92003.pdf
- Afonso, A., & Kazemi, M. (2017). Assessing public spending efficiency in 20 OECD countries. In Inequality and finance in macrodynamics (pp. 7–15). Springer: University of Lisbon.
- Afonso, A., & St. Aubyn, M. (2011). Assessing health efficiency across countries with a two-step and bootstrap analysis. Applied Economics Letters, 18(15), 1427–1430. https://doi.org/10.1080/13504851.2010.541149
- Ahec Šonje, A., Deskar-Škrbić, M., & Šonje, V. (2018). Efficiency of public expenditure on education: Comparing Croatia with other NMS. Munich Personal RePEc Archive (MPRA).
- Asaju, K. (2012). Human capital development and poverty alleviation in Nigeria: A symbiotic overview. ERIC Institute of Educational Science.
- Banker, R. D., Charnes, A., & Cooper, W. W. (1984). Some models for estimating technical and scale inefficiencies in data envelopment analysis. Management Science, 30(9), 1078–1092. https://doi.org/10.1287/mnsc.30.9.1078
- Becker, G. S. (1962). Investment in human capital: A theoretical analysis. Journal of Political Economy, 70(5, Part 2), 9–49. https://doi.org/10.1086/258724
- Bein, M. (2020). The association between medical spending and health status: A study of selected African countries. Malawi Medical Journal, 32(1), 37–44. https://doi.org/10.4314/mmj.v32i1.8
- Chan, S.-G., & Karim, M. A. Z. (2012). Public spending efficiency and political and economic factors: Evidence from selected East Asian countries. Economic Annals, 57(193), 7–23. https://doi.org/10.2298/EKA1293007C
- Chan, S.-G., Ramly, Z., & Karim, M. Z. A. (2017). Government spending efficiency on economic growth: Roles of value-added tax. Global Economic Review, 46(2), 162–188. https://doi.org/10.1080/1226508X.2017.1292857
- Charnes, A., Cooper, W. W., & Rhodes, E. (1978). Measuring the efficiency of decision making units. European Journal of Operational Research, 2(6), 429–444. https://doi.org/10.1016/0377-2217(78)90138-8
- Coxhead, I., & Jayasuriya, S. (2003). The open economy and the environment: Development, trade and resources in Asia. Edward Elgar Publishing Ltd.
- Currie, J. (2009). Healthy, wealthy, and wise: Socioeconomic status, poor health in childhood, and human capital development. JoUrnal of EconomIc LIteratUre, 47(1), 87–122. https://doi.org/10.1257/jel.47.1.87
- Dutu, R., & Sicari, P. (2016). Public Spending Efficiency in the OECD: Benchmarking health care, education and general administration. https://read.oecd-ilibrary.org/economics/public-spending-efficiency-in-the-oecd_5jm3st732jnq-en#page1
- Eggoh, J., Houeninvo, H., & Sossou, G.-A. (2015). Education, health and economic growth in African countries. Journal of Economic Development, 40(1), 93–97. https://doi.org/10.35866/caujed.2015.40.1.004
- Esanov, A., & Kuralbayeva, K. (2011). Plundered Nations?: Successes and Failures in Natural Resource Extraction (pp. 151). Palgrave Macmillan.
- Fahimi, A., Saint Akadiri, S., Seraj, M., & Akadiri, A. C. (2018). Testing the role of tourism and human capital development in economic growth. A panel causality study of micro states. Tourism Management Perspectives, 28, 62–70. https://doi.org/10.1016/j.tmp.2018.08.004
- Farrell, M. J. (1957). The measurement of productive efficiency. Journal of the Royal Statistical Society: Series A (General), 120(3), 253–281. https://doi.org/10.2307/2343100
- Filmer, & Pritchett. (1999). Also found no significant impact between government expenditure and public spending efficiency. https://doi.org/10.1016/S0277-9536(99)00150-1
- Fonchamnyo, D. C., & Sama, M. C. (2016). Determinants of public spending efficiency in education and health: evidence from selected CEMAC countries. Journal of Economics and Finance, 40(1), 199–210. https://doi.org/10.1007/s12197-014-9310-6
- Fonchamnyo, D. C., & Sama, M. C. (2016a). Determinants of public spending efficiency in education and health: Evidence from selected CEMAC countries. Journal of Economics and Finance, 40(1), 199–210. https://doi.org/10.1007/s12197-014-9310-6
- Fonchamnyo, D. C., & Sama, M. C. (2016b). Determinants of public spending efficiency in education and health: Evidence from selected CEMAC countries. Journal of Economics and Finance, 40(1), 199–210. https://doi.org/10.1007/s12197-014-9310-6
- Goldin, C. (2016). Human capital. In C. Diebolt & M. Haupert (Eds.), Handbook of Cliometrics. La Crosse, WI (pp. 407-434.). Springer.
- Gupta, S., & Verhoeven, M. (2001). The efficiency of government expenditure: Experiences from Africa. Journal of Policy Modeling, 23(4), 433–467. https://doi.org/10.1016/S0161-8938(00)00036-3
- Herrera Aguilera, S., & Ouedraogo, A. (2018). Efficiency of public spending in education, health, and infrastructure: An international benchmarking exercise. The World Bank.
- Herrera, S., & Pang, G. (2005). Efficiency of public spending in developing countries: An efficiency frontier approach. SSRN Electronic Journal. https://doi.org/10.2139/ssrn.2018832
- Jakovljevic, M., Liu, Y., Cerda, A., Simonyan, M., Correia, T., Mariita, R. M., … Varjacic, M. (2021). The Global South political economy of health financing and spending landscape–history and presence. Journal of Medical Economics, 24(sup1), 25–33. https://doi.org/10.1080/13696998.2021.2007691
- Jakovljevic, M., Sugahara, T., Timofeyev, Y., & Rancic, N. (2020). Predictors of (in) efficiencies of healthcare expenditure among the leading asian economies–comparison of OECD and non-OECD nations. Risk Management and Healthcare Policy, 13, 2261. https://doi.org/10.2147/RMHP.S266386
- Kosor, M. M., Perovic, L. M., & Golem, S. (2019). Efficiency of public spending on higher education: A data envelopment analysis for eu-28. Problems of Education in the 21st Century, 77(3), 396. https://doi.org/10.33225/pec/19.77.396
- Malyniak, B. S., Martyniuk, O. M., & Kyrylenko, O. P. (2019). The impact of corruption on the efficiency of public spending across countries with different levels of democracy. Financial and Credit Activity: Problems of Theory and Practice, 1(28), 290–301. https://doi.org/10.18371/fcaptp.v1i28.163927
- Mohanty, R. K., & Bhanumurthy, N. R. (2018). Assessing public expenditure efficiency at Indian states. National Institute of Public Finance and Policy, New Delhi, NIPFP Working Paper, 225.
- Ogundari, K., & Abdulai, A. (2014). Determinants of household’s education and healthcare spending in Nigeria: Evidence from survey data. African Development Review, 26(1), 1–14. https://doi.org/10.1111/1467-8268.12060
- Ogundari, K., & Awokuse, T. (2018a). Human capital contribution to economic growth in Sub-Saharan Africa: Does health status matter more than education? Economic Analysis and Policy, 58, 131–140. https://doi.org/10.1016/j.eap.2018.02.001
- Ogundari, K., & Awokuse, T. (2018b). Human capital contribution to economic growth in Sub-Saharan Africa: Does health status matter more than education? Economic Analysis and Policy, 58, 131–140. https://doi.org/10.1016/j.eap.2018.02.001
- Okorie Nathan, M. (2016). Human Resource Development, Panacea to Poverty Alleviation in a Developing Economy (A Case Study of NDE). University of Nigeria, Nsukka.
- Organization, W. H. (2019). Trends in maternal mortality 2000 to 2017: Estimates by WHO, UNICEF, UNFPA, World Bank Group and the United Nations Population Division. World Health Organisation.
- Ouertani, M. N., Naifar, N., & Ben Haddad, H. (2018). Assessing government spending efficiency and explaining inefficiency scores: DEA-bootstrap analysis in the case of Saudi Arabia. Cogent Economics & Finance, 6(1), 1493666. https://doi.org/10.1080/23322039.2018.1493666
- Ouertani, M. N., Naifar, N., Ben Haddad, H., & Zhang, X. (2018). Assessing government spending efficiency and explaining inefficiency scores: DEA-bootstrap analysis in the case of Saudi Arabia. Cogent Economics & Finance, 6(1), 1493666. https://doi.org/10.1080/23322039.2018.149366
- Papke, L. E., & Wooldridge, J. M. (1996). Econometric methods for fractional response variables with an application to 401 (k) plan participation rates. Journal of Applied Econometrics, 11(6), 619–632. https://doi.org/10.1002/(SICI)1099-1255(199611)11:6<619::AID-JAE418>3.0.CO;2-1
- Schultz, T. W. (1961). Investment in human capital. The American Economic Review, 51(1), 1–17. http://links.jstor.org/sici?sici=0002-8282%28196103%2951%3A1%3C1%3AIIHC%3E2.0.CO%3B2-4
- Simar, L., & Wilson, P. W. (2007). Estimation and inference in two-stage, semi-parametric models of production processes. Journal of Econometrics, 136(1), 31–64. https://dial.uclouvain.be/pr/boreal/object/boreal%3A122906/datastream/PDF_01/view
- Simar, L., & Wilson, P. W. (2020). Hypothesis testing in nonparametric models of production using multiple sample splits. Journal of Productivity Analysis, 53(3), 287–303. https://doi.org/10.1007/s11123-020-00574-w
- Smaoui, F., & Kammoun, N. (2019). The efficiency of public spending on education in Tunisia and the challenges of integrating graduates. International Journal of Social Science and Economic Research, 4(1). http://ijsser.org/files_2019/ijsser_04__39.pdf
- Suri, T., Boozer, M. A., Ranis, G., & Stewart, F. (2011). Paths to success: The relationship between human development and economic growth. World Development, 39(4), 506–522. https://doi.org/10.1016/j.worlddev.2010.08.020
- UNICEF. (2016). Education 2030: Incheon declaration and framework for action: Towards inclusive and equitable quality education and lifelong learning for all. https://unesdoc.unesco.org/ark:/48223/pf0000245745
- Union, A. (2007). Africa health strategy: 2007–2015.
- Xu, K., Evans, D.B., Kawabata, K., Zeramdini, R., Klavus, J., Murray, C. 2003. Household catastrophic health expenditure: a multicountry analysis. Lancet, 362, 111–117. https://doi.org/10.1016/S0140-6736(03)13861-5
- Zhang, M., Liu, X., Ding, Y., & Wang, W. (2019). How does environmental regulation affect haze pollution governance?—An empirical test based on Chinese provincial panel data. Science of the Total Environment, 695, 133905. https://doi.org/10.1016/j.scitotenv.2019.133905