
 ?Mathematical formulae have been encoded as MathML and are displayed in this HTML version using MathJax in order to improve their display. Uncheck the box to turn MathJax off. This feature requires Javascript. Click on a formula to zoom.
Abstract
Suitable agro ecology and tremendous soybean potential of Ethiopia is the key to produce the crop in large-scale and maintaining a steady supply on the market. Although its demand rises quickly for export and local processing, the current production status is much below the market demand. The factors influencing the supply of soybeans in Northwestern Ethiopia were the main subject of this study. The sample households were chosen using a multistage sampling technique. In this study, data were gathered from 228 respondents that were randomly drawn. The data were obtained mainly from sampled soybean growers via structured interviews with key informant interviews and focus groups for triangulation. Descriptive statistics and multiple linear regression models were employed to analyze the data including one way ANOVA and t-tests. The findings showed that soybean producers’ average productivity was 1.21 tons ha−1, much below the national average of 2.15 tons ha−1, due to the sparse usage of improved seed, fertilizer, and other recommended packages. According to the model results, productivity, lagged price, market information, prior experience with soybean farms, cultivated land, weekly extension contacts, education (preparatory school completion), and credit access all had a positive and significant impact on the quantity of soybean market supply. The results showed that soybeans are the most lucrative and important cash crop for producers in the study area. The availability of improved soybean technologies with full recommended packages boosts their productivity and enables them to guarantee sustainable market supply in order to meet the increased market demand.
PUBLIC INTEREST STATEMENT
Soybean is a miracle legume crop in many parts of the world due to its excellent nutrient composition to improve human and animal nutrition. Its market demand amazingly increasing in the domestic and international markets. Ethiopian soybean food and feed processing firms are expanding rapidly. Although opportunities exist to grow soybean in large-scale, the production status is so limited and this leads to limited market supply below the market demand. Hence, this study investigates the determinants of soybean market supply in North-western Ethiopia. Hence, to enhance the quantity of market supply, bureau of agriculture should provide appropriate extension services, research institutes in collaboration with concerned bodies should deliver improved varieties with full recommended packages to enhance production and productivity further to ensure market supply.
1. Introduction
Soybean is one of the most important food plants worldwide grown as an industrial and versatile crop(Afework & Adam, Citation2018; Shea et al., Citation2020). Global soybean production has expanded 8.4 times as a result of genetic breakthroughs and improved production techniques, while productivity has nearly doubled. Between 1968 and 2018, the global soybean production area increased from 28.8 to 125 million hectares. The top five soybean-producing nations—the United States, Brazil, Argentina, India, and China—produce around 90% of the world’s production. Additionally, the crop has become a global commodity, and 170 countries trade soybeans internationally through imports or exports, with an estimated total value of 58 billion US dollars in 2017 (De Maria et al., Citation2020).
Soybean production is crucial in Ethiopia to addressing the issue of malnutrition particularly smallholder farmers who cannot afford animal source proteins. Oromiya, Benishangul Gumuz, Amhara, and to a lesser extent Southern Nation Nationality and Peoples are the main regions of Ethiopia for soybean production (Achamyelh et al., Citation2020). Moreover, different parts of the country are in the midst of establishing soybean processing industries that require it for the processing of food and feed. However, the majority of the crop’s requirements for domestic processing and byproduct consumption were met by imports, resulting in a 13,800 tons trade deficit in the nation (Hailu & Kelemu, Citation2014). The Ministry of Trade and Industry report, 2019 showed that 101,703.81 tons of soybeans were delivered to the market, of which 92.63% of the grain was exported and 7.37% was utilized for domestic oil processing. Because of how little is being produced at this level, soybean production must be raised in order to meet the nation’s expanding market need.
The quantity of market supply is determined by socioeconomic, demographic, and institutional factors. The previous findings indicated that the amount produced, the distance to the nearest market, the sex of the household head, the frequency of contact with agricultural extension agents, and cooperative membership affected the quantity of market supply (Achamyelh et al., Citation2020). Moreover, producers’ main constraints to sustainable soybean production were soybean price volatility and marketing (Fentahun, Citation2019). Farmers won’t grow soybeans unless they can sell their crop for a good profit (Hasan et al., Citation2015). The issues with soybean marketing were a lack of necessary inputs, credit bureaucracy, subpar silos, a low market price, and weak producer bargaining power (Achamyelh & Hailemariam, Citation2020).
Soybean brought to Benishangul Gumuz in 1985 during the massive resettlement program of the Dreg regime (Getahun & Tefera, Citation2016). The regional government’s 2019 annual report states that 31,670 hectares of land were used to cultivate 83,675.4 tons of soybeans. Although the crop’s productivity is far below the national average due to low levels of input application that are below the recommended rate and poor agronomic practices, producers in Benishangul Gumuz nonetheless make money from it (Afework & Adam, Citation2018). Moreover, the region has more than 156,000 hectares of land that can be used for soybean farming. As the area with the most potential for producing soybeans, Metekel has seen a large influx of commercial farmers in addition to small-scale farmers. Since the area is well renowned for its soybean potential, Pawe district is one of the largest soybean growers in the Metekel zone, and there are several traders in all 20 kebeles. The primary commercial crop in the area is soybean, which practically all farmers grow to varying degrees for marketing purposes. Despite the potential and opportunities for soybean, the market’s current supply is much lower than the current demand. As a result, it was suggested in this market study to determine the factors influence the supply of soybeans.
Numerous research have been conducted on the factors that influence the amount of supply on the market in various regions of the nation with a focus on cereal crops such bread wheat, maize, teff, and sesame from low land oil crops. Researchers also looked into the limitations on soybean production and marketing. Less focus has been placed on the causes of the soybean market’s inadequate supply. A scant amount of research has been done on the factors that influence the supply of the soybean commodity on the market. Although there are numerous prospects to produce soybeans on a large scale in the study area, the market supply currently falls well short of the market demand. Additionally, the study area had not yet conducted any research or compiled any records on the decisive factors that led to a limited market supply of soybeans. Hence, the current study on “determinants of soybean market supply in Pawe district of Northwestern Ethiopia” was proposed in an effort to close the gaps.
2. Literature review
On the basis of market demand, effective supply chain management may enhance the marketing process and the volume of market supply (Fredendall & Hill, Citation2000). Empirical research revealed that institutional, socioeconomic, and demographic factors affect the market’s supply and participation levels. Age of the household head, distance to the nearest market, distance to the nearest urban market, access to training, contract farming, and access to agricultural extension services are all strongly correlated with market supply and participation (Taye et al., Citation2018). The quantity of maize on the market is positively and significantly correlated with yield, off-farm income, sex, and farm experience. The results of this study showed that when the amount of money from off-farm sources and productivity increased by one birr and one quintal correspondingly, the amount of market supply increased by 1.404 and 0.521 quintals. Indeed, there was a negative and significant correlation between the number of family members per household and the supply of goods on the market (Edosa, Citation2018; Mirie & Zemedu, Citation2018). The amount of market supply was positively associated with the producers’ farming experience (Giziew, Citation2018). The finding implies that for every additional year of farming experience in onion production, the amount of market supply of onions grew by 0.0185 quintal.
According to the research done by (Usman, Citation2016), the amount of the commodity produced, the size of the landholding, the number of livestock held, and the size of the household are the key determinants that affect the amount of the product given to the market. The quantity of wheat on the market grew by 0.623, 4.25, and 0.37 quintals for each unit increase in quantity produced (quintal), land size (ha), and livestock owned, based on the study’s robust regression results (TLU). When a household travels an extra kilometer to reach the nearest market, the amount of supply on the market falls by 0.24 quintal (Goshme et al., Citation2018).
2.1. Empirical literature review and hypothesis development
The farming system of the studied area, empirical evidence from a review of related literature, and consideration of the laws of supply and demand all played a role in the listing and selection of the explanatory variables for this study. The quantity of market supply was found to be affected by demographic, socioeconomic, and institutional factors at various levels, either favorably or unfavorably depending on the situation. The principles of supply and demand also stipulated that, in addition to other considerations, the market demand for a particular item determines how much is available on the market.
Quantity of soybean market supply: This dependent variable, which is measured in tons, indicates the supply of soybeans on the market made by households during the 2019 marketing season.
Productivity: The amount of soybeans produced in tons per hectare during the 2018/19 production seasons is a continuous variable. Productivity is considerably and positively correlated with the supply of sesame on the market (Gebremedhn et al., Citation2019). This implies that households with higher yields per hectare can supply a greater volume of goods to the market. Therefore, it is hypothesized that soybean productivity can have a positive and a significant effect on the volume of its market supply.
Lagged price: It is a continuous variable measured in birr per ton. It represents the typical price for soybeans that farmers received the year before. Farmers are encouraged to produce more because of the favorable pricing of the commodity in the previous year in order to supply the market. The determining factor for market supply is the market price of the provided commodity. The findings of(Dibaba, Citation2021; Mirie & Zemedu, Citation2018) found a positive relationship of tef market supply and lagged price. Farmers are forced to grow extra soybeans for marketing purposes because soybeans had an attractive market price the previous year. Therefore, it is hypothesized that the market price of soybean in prior years has a favorable and considerable impact on the volume of its supply on the market.
Education level: It is a categorical variable (1 unable to read and write, 2 read and write, 3 primary school completed, 4 secondary school completed, 5 preparatory school completed & 6 TVET and above). Farmers with higher formal education were more productive and able to produce more for the market than their rivals (Tefaye & Beshir, Citation2014). Education raises farmers’ knowledge levels, enabling them to produce goods with a market. Education improves a producer’s abilities in the whole production and marketing of a given commodity. The researchers put out the hypothesis that education significantly and positively influences the amount of soybean market supply.
Age: It is a continuous variable expressed as the age of the household head in years. Due to their rigidity and difficulty accepting new agricultural technologies, the elderly produce less per hectare of land. Farmers’ productivity also declined with older age. Compared to older farmers, young farmers tend to adopt a production method that is more focused on the market and can produce more goods for the market (Taye et al., Citation2018). Following the study’s findings, farmers’ market participation decreased by 0.2% for every year that the household head’s age increased. As a result, it is hypothesized that the household head’s age has a negative influence on the quantity of soybeans on the market.
Frequency of extension contact: It is a categorical variable that is measured in terms of how frequently farmers interact with extension agents throughout the 2018/19 growing season, ranging from 1 rarely, 2 monthly, 3 twice a month, 4 weekly, and 5 daily. The higher the knowledge and market information have acquired, the more frequently the extension agent is contacted. With better market pricing, extension service increases farmers’ awareness of production and market excess (Abrha et al., Citation2020; Usman, Citation2016). Therefore, it is hypothesized that regular extension contact can have a favorable and considerable impact on the amount of soybean market supply.
Market distance: The distance in hours between a home and the closest market is a continuous variable. The quantity given to the market decreases when the household’s houses are farther apart (Melaku & Ashalatha, Citation2016). Therefore, it is assumed that the proximity of households to the closest market has a favorable impact on the volume of soybean market supply.
Cooperative membership: It has been set as a dummy variable (1 if a cooperative membership and 0 for non-membership). If farmers are organized into a cooperative, they can produce more outputs in huge amounts. Because forming a cooperative allows more people to buy agricultural inputs and produces surplus outputs that can be sold on the market. Positive correlation between cooperative membership and supply on the market (A. W. Belayneh et al., Citation2022). It is therefore hypothesized to have a positive and significant impact on the volume of soybean market supply.
Credit access: It has been set as a dummy variable (1 for those farmers who accessed credit service and 0 otherwise). Credit services strengthen farmers’ ability to purchase agricultural inputs for production, which increases the quantity of products available on the market. Farmers’ ability to borrow in full boosts their ability to produce surplus soybeans for marketing (Ali & Awade, Citation2019). Therefore, the researchers proposed that credit availability may have a positive effect on the amount of soybeans on the market.
Sex: It has been assigned as a dummy variable (1 for male head household and 0 for the female head household). Being a male head of household has a positive and significant influence on selling surplus teff (Nitsuh, Citation2019). Men are more familiar with new agricultural technologies than women are because they take part in more training programs and field day activities. This increases the production of surplus agricultural products for the market and increases the rate at which different agricultural technologies are adopted. Maleness is therefore thought to have a positive and significant influence on the supply of soybeans on the market.
Training participation: It is a dummy variable that took the value 1 in the case of farmers who received training in soybean production methods and management and 0 in the absence of such training. Training has a positive and significant impact on the supply of soybeans on the market (Banda et al., Citation2017). Farmers may produce more while reducing yield loss if they receive the proper training in crop management, pest control, and pre- and post-harvest handling techniques. This variable is therefore anticipated to have a positive and considerable impact on the volume of soybean market supply.
Off-non farm income: It has been set as a dummy variable (1 for farmers who participated in off-non-farm income activities and 0 otherwise). The availability of other income streams for farmers outside of their own agricultural endeavors raises the purchasing power of various agricultural inputs, which then causes the production surplus to increase further so that more outputs can be supplied to the market. Therefore, it is hypothesized that non-farm income can have a positive influence on the quantity of soybean market supply.
Family size: This is a continuous variable measured in terms of the number of family members per household head. As family size rose by one, the quantity of wheat on the market decreased by 0.005 tons (Usman, Citation2016). Family size can sometimes have a positive impact on the market supply in terms of labor demand. In light of this, the researchers proposed that family size may have an impact on the amount of soybeans available on the market, either negatively or positively.
Access to market information: This dummy variable had a value of 1 if the farmer had access to market information and a value of 0 if not. Due to their inadequate access to market information, smallholder producers are unable to produce surplus outputs for the market. Increased market supply of potatoes results from access to market information (Wondim & Desselgn, Citation2019). Due to the lack of precise market information, farmers begin to accept price reductions for their crops. The researchers therefore proposed the hypothesis that market information availability has a positive and considerable influence on the volume of soybean market supply.
Soybean farming experience: It is a continuous variable determined by how long the household head has been involved in soybean farming. Because they have a thorough understanding of the market, seasoned households can produce surplus outputs for sale. Farming experience positively and significantly increased the quantity of sesame market supply (Girma et al., Citation2017; Giziew, Citation2019). It is therefore hypothesized that experience has a positive and considerable influence on the quantity of soybean market supply.
Cultivated land: It is a continuous variable that refers to the total amount of farmland that was cultivated in 2018/19, expressed in hectares. The amount of market supply is positively and strongly correlated with the size of the household’s land (Abele & Tefera, Citation2015; Abera et al., Citation2016; B. Belayneh et al., Citation2018). Therefore, it is believed that cultivated land has a positive and significant effect on how much soybeans are available on the market.
3. Research methodology
3.1. Description of the study area
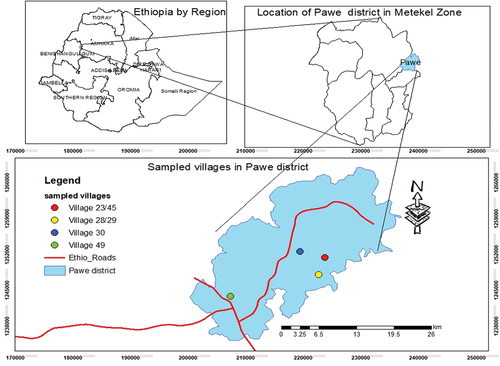
The investigation was carried out in Northwestern Ethiopia focusing on the Pawe district of the Metekel zone. The distance between the district and Addis Ababa is 575 kilometers. Its total area is 64,300 hectares, of which 50.4% are arable and used for crop cultivation. Latitude 110 09’ N and Longitude 360 03’ E are the coordinates for the district. It is located approximately 1120 meters above sea level. The average temperature and annual rainfall in Pawe over the past 30 years have been 32.7 °C and 1582 mm, respectively, according to metrology data from the Pawe Agricultural Research Center. Approximately 67,862 people call Pawe their home, with males and females making up 52.17% and 47.83% of that total, respectively.
The district’s farming practices include both crop cultivation and livestock keeping. Its primary agricultural products are maize, soybeans, rice, sorghum, sesame, and groundnuts. Three of these necessary commodities—soybean, sesame, and ground nuts—are largely produced for marketing, with soybean making up the majority of production. Because of the district’s potential, more than 35% of the cultivated area was set aside for soybeans (Ayalew et al., Citation2018). The district has excellent prospects to produce soybeans on a wide scale due to the favorable land conditions, climate, and rainfall patterns. Additionally, the Pawe Agricultural Research Center and other collaborating research centers have released about 29 new soybean cultivars. These kinds are divided into three maturation categories—early, medium, and late—and each has a maturity date that has been confirmed by the research centers. Only six of them have reached the end users, and most of the released types have not been warmly received by the producers. In addition to these important crops, cattle and goats are the principal revenue generators, especially for smallholder farmers. Butter from cow byproducts serves as the farmers’ primary source of revenue and pays for their regular living expenditures. As indicated in , the study focused at Pawe district of Metekel zone, Northwestern Ethiopia due to its great potential in soybean production.
Figure 1. Map of the study area (Pawe district).
3.2. Sampling techniques and procedures
The study area’s sample households were chosen using a multistage sampling procedure. Due to its potential for soybean production, the Pawe district was purposefully chosen for the initial stage. Similar to the first stage, 16 of the district’s 20 kebeles were purposefully selected for second stage due to their excellent soybean production potential. From those 16 prospective kebeles, 4 were chosen at random in the third stage using a simple random sampling technique because they had comparable rainfall patterns, soil types, and temperatures. Finally, using a simple random selection technique and the prepared sampling frame based on proportional size to the population, sample households were selected from each sample kebele.
3.3. Sample size determination
The households that grew soybeans throughout the 2018/19 production season served as the main sampling units. Data about the farmers on this list who grow soybeans were gathered from each kebele agriculture office. With a precision level of 7%, the Yamane (Citation1967) formula was used to determine the required sample size. There isn’t much variation in soybean production among farmers in Pawe because practically all of them grow soybeans and have similar agro ecologies, that is why a margin error of 7% was used. The sample size required depends on how homogeneous (less variable) the population is (Yamane, Citation1967). Therefore; the required sample size was calculated as follows.
Where, n is the required sample size
N is the total population size
e is the level of precision/margin error
A total of 191 farm households were selected by a simple random selection procedure in the sampling frame based on the calculation made using the formula above. Also included as compensation were 19 respondents for non-response rate and 18 for invalid data. Last but not least, 228 respondents out of 3050 total households in the studded kebeles used the quantitative primary data. Socioeconomic factors such as education level, cultivated land size, access to credit service, training on pre- and post-harvest handling system, lagged price, productivity of soybean, and participation of households in off-farm activities are also included in the data collection. Institutional factors include frequency of extension contact between farmers and development agents, access to market information, and cooperative membership market distance of households from home residence. Details of the sampling design indicated in Table below.
Table 1. Distribution of sampled households in the studded kebeles
3.4. Methods of data collection
Data were gathered in both the quantitative and qualitative forms as a result. In addition to the quantitative data, development agents assisted in gathering qualitative data from 8 key informants through interviews in 4 sampled kebeles and 4 focus group discussions with 6 participants each group. Farmers were chosen for the focus groups based on their experience and expertise in the production and marketing of soybeans. In-depth data was collected during focus group discussions and used to triangulate the quantitative primary data. For this investigation, both primary and secondary data were employed. Reviewing published journals, proceedings, books, reports, and to some extent, unpublished data, secondary data were acquired. Each sampled respondent was personally interviewed and household surveys were used to gather the primary data. From the commencement of this study until its conclusion, there was a close and cordial contact with each sampled kebele development agent and district expert in order to gather the necessary data. Before the enumerators went into the field, the researchers with development agents completed every step of the data collection process early. To cut down on time wasting, clear arrangements were set up with the respondents detailing where and when the data were gathered. Even though some respondents found the assigned time uncomfortable, other appointments were made in their place because it was challenging to collect the required data in a setting that wasn’t pleasant for them.
3.5. Methods of data analysis
Accordingly, statistical analysis (descriptive & inferential) and Econometric analysis were undertaken to analyze the primary data through STATA (version 15) and SPSS (version 26) software packages.
3.5.1. Descriptive and inferential statistical analysis
Standard deviation, mean, percentage, maximum, and minimum were employed as descriptive statistics. To evaluate the significance of the parameters to be estimated and to look for heteroscedasticity, inferential statistics like the t-test and the Breusch-Pagan/Cook-Weisberg test were used. For continuous and dummy/discrete independent variables, respectively, the presence of the multicollinearity problem was tested using the variance inflation factor (VIF) and the contingency coefficient (CC). Additionally, analysis of variance (ANOVA) was used appropriately.
3.5.2. Econometric analysis
Factors affecting soybean market supply: If and only if every household or respondent takes part in the marketing of the given commodity, the OLS model can be used to estimate the variables that influence the quantity of soybean market supply. However, employing the OLS model and removing the non-participants from the study results in selectivity biases in the model if all of the participants are not involved in the marketing of the chosen product. Tobit, Double-Hurdle, and Heckman two stage techniques are preferable in this situation to solve the issue. In this situation, the Probit and logit models can solve the issues if our goal is in analyzing the probability of selling. Multiple linear regression analysis is a statistical method for estimating the reasonable relationship between the dependent variable and multiple predictor variables while taking into account the data’s normality, linearity, extreme values, and missing values (Uyanık & Güler, Citation2013). Since direct eating of soybean as food is not widespread, nearly all of the farmers in 16 kebeles in the Pawe district of the Metekel zone grow soybeans for marketing. Since the quantity of soybean market supply is continuous and every sample respondent in the sampling frame produced and supplied their soybean products to the market in the 2018/19 cropping season, multiple linear regression analysis was used to study the factors affecting soybean market supply in the study area. A similar study was carried by (Abrha et al., Citation2020) to estimate the determinants of onion market supply through multiple linear regression models. The study conducted by(A. W. Belayneh et al., Citation2022) also analyzed the determinant factors affecting the quantity of sesame market supply using multiple linear regression model. Hence, multiple linear regression model is appropriate and practical to analyze the factors affecting the quantity of soybean market supply. The econometric model of specification for this supply function in matrix notation is given below.
Where, Y = the quantity of soybean supplied to the market
X = the explanatory variables that affect soybean market supply
β = are the parameters to be estimated
U = the disturbance term i.e., unobserved factors to the researcher but affects market supply
4. Results
4.1. Demographic and socio-economic characteristics of respondents
The socioeconomic and demographic characteristics of sampled households in the study area are depicted in the survey results shown in Table . The respondents’ average family size was 5.75, with family sizes ranging from 2 to 10. The sample households’ average age was 44.99 years, with a minimum and maximum age of 25 and 75, respectively. In general, respondents have an average of 23.20 years of farming experience, and they have been growing soybeans for an average of 9.28 years. People were had to travel about 2.5 hours to get to their local marketplaces. It was difficult for the majority of small-scale producers to reach their nearest markets, which required an average walking distance of 44 minutes. More cultivated land is allotted for soybean production by farmers, and the average size of respondents’ cultivated land was 3.39 hectares, with a standard deviation of 1.51. The lands that the sampled households allotted for soybean farming ranged in size from 0.25 to 5.50 hectares, with a mean land size of 1.34 hectares. According to this, of all the crops grown in the area, soybeans accounted for 28.33% of the total. Although much below the national average of 2.15 tons per hectare, the mean productivity of the sample farms was 1.21 tons per hectare. The main reasons limiting output were lack of usage of improved seed and fertilizer as well as other suggested agronomic packages. Each household in the study produced between 0.2 and 17.50 tons of soybeans, with an average of 1.68 tons. The amount of soybeans delivered to the market by each household included in the sample ranged from 0.2 to 16.7 tons, with a 1.56 ton average supply. The selling price of soybeans fluctuated widely, averaging 11,250.13 Birr per ton (SD = 2013.66). Additionally, 5.89 TLU (Tropical Livestock Unit) of livestock were kept by the sampled households, who depend on it as a living and a source of revenue.
Table 2. Socio-economic and demographic characteristics of sample households
The proportion of female headed households constituted 3.95% of the total sample households. The average amount of soybean market supply for the male and female sample households was 1.59 and 0.99 tons, respectively, as shown by the data in Table . The t-value of (t = 1.086) does not indicate that there is a statistically significant difference between the two groups in terms of the supply of soybeans on the market. The survey’s findings revealed that during the 2018–19 production season, 58.33% of sample households participated in training on soybean production and management techniques, compared to 41.67% of sample households who did not. The respective average quantity of soybean supplied to the market by sample households who took and didn’t take training was 1.6 and 1.5 ton. In terms of the amount of soybean market supply, the t-result test’s (0.454) indicated that there is no statistical evidence for the presence of a mean difference between the two groups. The majority (67.11%) of the sampled households had access to market data on soybean and other commodity selling prices. The market received 2.07 tons of soybeans on average from selected households that had access to market information. Only 0.56 tons of soybeans were supplied to the market by sample households who did not have access to market information. According to the t-test (7.40***) result, there was a significant mean difference in the amount of soybean market supply between the two groups at (p 0.01).
Table 3. Relationship of quantity of soybean market supply with categorical variables
According to the survey’s findings, 42.54% of the studied households were not members of a cooperative, while 57.46% of them were members. For cooperative members and non-members of the sample households, the average market supply of soybean was 1.96 tons and 1.03 tons, respectively. The t-test (4.41***) shows that there is a statistically significant difference in the mean quantity of soybean product delivered to the market between cooperative members and non-members at (p 0.01). The findings shown in Table , 47.4% of the sample households had access to credit in the neighborhood and 52.6% of them did not use credit facilities for their farming operations. The result shows the average soybeans delivered to the market was 1.61 tons from sample households with access to credit facilities, compared to 1.51 tons from households without credit. The t-test result of 0.46 is not evidence that there is a statistical mean difference in the quantity of soybean market supply between the two groups. Most sampled households (78.5%) were not involved in any form of non-farm activity. Only 21.5% of the respondents engaged in activities that were not related to farming. 1.83 tons of soybeans were produced by households engaged in non-farm work for the market. 1.49 tons of soybeans were sold by nonparticipant households. Off-farm participant sample households comparatively supplied more outputs to the market than their counterparts, even if the t-test result (−1.316) is not statistical evidence for the presence of a significant mean difference between the two groups in terms of the quantity of market supply.
The survey’s findings revealed that the majority of the sample households (45.61%) had completed primary school and that 27.63% were illiterate. Respondents who can read & write, and have completed secondary education accounted a share of 18.42% and 5.70%, respectively. Households with completion of preparatory schooling and technical vocational education training at or above levels each had a 1.3% share.
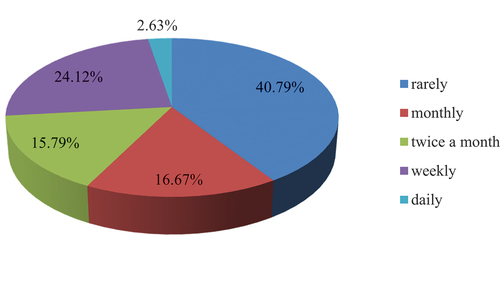
The findings revealed that the majority of farmers (40.79%) had little contact with development agents. The study’s findings showed that DAs contacted 24.12%, 16.67%, and 15.79% of the sampled households on a weekly, monthly, and twice-monthly basis respectively. Only 2.63% of the studied farmers received daily DAs asking for information exchange and help on marketing and farming strategies. shows that the frequency of extension contact of farmers with development agents to get advise regarding their farming opertaions.
Figure 2. Frequency of extension contact of farmers to development agents.
The analysis of variance ANOVA result shown in Table (F = 18.555, p = 0.000) shows evidence that there is a statistically significant mean difference in the amount of soybean market supply between the groups of extension contacts. With regarding to the education levels, there was no statistical support for a significant mean difference between the groups in terms of the amount of soybeans delivered to the market, according to the ANOVA result (F = 0.536, p = 0.749). As depicted in , the education level of the sample households ranged from illiterate to technical vocational education training and above in which majority of them completed their primary school education.
Table 4. Education level of soybean producers
Table 5. ANOVA results of frequency of extension contact & education level
4.2. The determinant factors affecting soybean market supply
The determinant factors affecting the quantity of soybean market supply were examined using the multiple linear regression model (OLS). According to the findings in Table , each independent variable’s coefficient was shown, demonstrating the amount of change in the supply of soybeans for a change in each of the explanatory variables taken into account in the model. The model’s explanatory power is also reflected by the coefficient of determination (R2). The OLS model’s results show that the coefficient of determination (R2) was 0.9011. This indicates that the independent variables that were used in the model account for 90.11% of the variation in the dependent variable, or the quantity of soybean market supply. The overall model is shown to be significant at (p < 0.01) by the F-statistics calculated value (F = 78.35, p > 0.0000). Through the variance inflation factor (VIF) for continuous explanatory variables, the multicollinearity issue was evaluated. The reported findings vary from 1.01 to 1.97, demonstrating that multicollinearity among the explanatory variables is not a concern. The contingency coefficient (CC) was used to test for multicollinearity for dummy/categorical variables, and the results show that it is less than 0.75. This suggests that the dummy/categorical variables that were included in the model do not have a multicollinearity issue. Similar to this, the Breusch-Pagan/Cook-Weisberg test was used to examine the heteroscedasticity issue. Robust regression was used to rectify the result because it indicated the presence of heteroscedasticity.
Table 6. Regression results of factors affecting quantity of soybean market supply
5. Discussion
When cultivating crops for marketing, it is crucial for growers to have access to accurate market price information. In terms of the quantity of soybean market supply, there was a significant mean difference between the sample households with access to and without access to market information at (p < 0.01). The results indicate that each sample household that obtained and did not access market pricing information delivered 2.07 tons and 0.56 tons of soybeans to the market, respectively. This suggests that market information is essential for providing the market with more outputs. To lessen market imperfections and confidently deliver outputs on the correct market at the right time, the availability of trustworthy market information is crucial (Ahlers et al., Citation2013; Degefa et al., Citation2020). The results of focus group discussions also show that for the majority of the households in the study area, friends and neighbors served as the primary sources of information about market prices. The availability of trustworthy market data enables farmers to select a lucrative method of transaction and forces farmers to increase output for marketing.
Cooperatives are important, especially for input supply and bulk product purchases in the study area. According to the study’s findings, there was a significant mean difference in the quantity of soybean market supply between cooperative members and non-members at (p < 0.01). This indicates that cooperative members have a greater capacity to supply the market with soybeans than do their counterparts. By reducing the number of middlemen in the marketing channels, cooperatives help farmers satisfy market demands and receive a fair price for their produce (Oljira & Goshu, Citation2017; Siddique, Citation2015). Agricultural cooperatives help farmers integrate production and market supply, sale, and credit options, which protects their ability to profit financially from the sale of their produce (Lopoyetum et al., Citation2014; Zhang et al., Citation2021). However, according to data gathered from focus group discussions and key informant interviews, the cooperatives and unions did not satisfactorily serve the local communities in terms of marketing. Even cooperative members chose to supply local merchants with their soybeans and other items rather than the cooperative. Cooperatives were unable to deliver various services and receive payment for their goods on schedule. The majority of producers are enticed to supply their goods to local traders because they can offer free sacks for their soybean output and credit for money and other inputs like seed during times of shortage.
The Ethiopian government established one farmers’ training center (FTC) and five development agents (DAs) for each kebele administration to narrow the knowledge gaps among farmers and combat poverty. Farmers mostly receive extension services from development agents, who are also supposed to assist farmers in their regular farming tasks. To improve the delivery of extension services and information transfer across groups, various farmer organizations have been formed, including the development group and one to five groups. However, according to the data gathered from FGDs and KIs, the farmers’ organization is not operating in line with its goals. Although DAs are supposed to help farmers with just agricultural tasks, they are frequently required to carry out political and other tasks that are unrelated to their line of work, which has an impact on how well farmers do in terms of output and productivity. Extension agents are supposed to support farmers by staying in touch with them regularly during their daily lives. However, more regular extension interaction between farmers and DAs may not always produce the desired results; it is preferable to supply the necessary extended services through service providers.
The analysis of variance ANOVA result shown in Table (F = 18.555, p = 0.000) provides proof that there is a statistically significant mean difference in the quantity of soybean market supply between the groups. The finding by(Goshme et al., Citation2018) also confirmed that the frequency of extension contact significantly affects the quantity of sesame market supply at (p < 0.01). Findings of(Dibaba, Citation2021) also showed that frequency of extension contact of teff producer farmers to development agents had a significant and positive effect on farmers’ market participation and their outlet choices to supply their product in the right market. In the process of improving farmers’ living conditions generally, the provision of effective agricultural extension services plays an important role. By utilizing scientific information, it helps farmers increase their output and productivity. Agricultural extension initiatives are crucial for boosting farmers’ productivity and income by supplying the market with more products (Danso-Abbeam et al., Citation2018). Agricultural extension agents educate farmers on farming practices in an effort to raise their production and level of living (Maulu et al., Citation2021; Raidimi & Kabiti, Citation2019; Shah et al., Citation2013). Farmers can implement scientific findings with the close cooperation of DAs and experts. Those who benefited from modern agricultural extension services were more productive than farmers who did not (Zoogah & Nakuja, Citation2020). The role of agricultural extension services is vital in persuading farmers to adopt new agricultural technologies. It makes it possible for farmers to be aware of and better grasp the study results that raise their output and productivity levels. It is crucial for promoting and distributing new technologies to the majority of farmers.
Productivity: The quantity of soybeans on the market is positively and significantly influenced by productivity at (p < 0.01), as predicted. If the households produce higher yields per hectare, the amount of soybean provided to the market could be increased. According to the results of the multiple linear regression model, when productivity increased by a ton, the amount of soybeans on the market grew by 0.403 tons. This implies that a gain in productivity encourages growers to produce soybeans more intensely, which raises the quantity of supply on the market. The finding is similar to(Gebremedhn et al., Citation2019) who found that quantity of sesame market supply increased by 0.350 ton for a unit increase of sesame productivity.
Lagged price
It is a continuous variable with a birr per kilogram measurement unit. The quantity of soybean market supply is significantly and positively affected by the commodity’s lagged price at (p < 0.01), as expected. Farmers that allocate more of their lands for soybean do so because the previous year’s high price of soybean encourages them to produce more and supply the market with more goods the following year. The OLS model’s findings show that while the market price of the crop grew by 1 birr per kilogram the previous year, the supply of soybeans increased by 2.450 tons. The result agrees with(Ayele et al., Citation2021) who showed that the quantity of wheat market supply was increased by 0.03 ton as the lagged price of wheat increased by one Ethiopian birr. The finding is similar with(Dibaba, Citation2021; Mirie & Zemedu, Citation2018) and(Ademe et al., Citation2018)who confirmed that tef and maize marketed surplus positively and significantly correlated with the lagged price.
Education level: In order to supply more products to the market, farmers’ productivity and production levels might be further influenced by their education level. Only farmers who completed their preparatory school education positively and significantly influenced the volume of soybean market supply out of the five education levels of farmers. According to the OLS model’s findings, the supply of soybeans on the market has grown by 0.223 tons for households with children who have finished preparatory school (grades 11–12). Farmers with greater education can more quickly embrace new agricultural technologies to boost their output and productivity, which increases the supply on the market. One of the possible explanations for the existence of a positive and significant link between literate households and the volume of market supply is that educated households adhere to a market-oriented production system. The finding agrees with(TadeleMelakuChalla & PaulMansingh, Citation2016) who found that the existence of positive and significant correlation of education and quantity teff and wheat market supply.
Frequency of extension contact
It is a categorical variable that describes how frequently sampled farmers interacted with development professionals throughout the 2018–19 growing season. The quantity of soybean market supply as predicted was significantly and positively impacted by the frequency of appropriate extension contact. Weekly and daily extension contacts with farmers had a substantial impact on the volume of soybean market supply compared to monthly, twice-monthly, weekly, and daily farmer contacts. The amount of soybeans delivered to the market was significantly and favorably influenced by farmers’ weekly extension contacts with extension agents (P < 0.01). According to the findings of multiple linear regression models, extension agents’ weekly contact with farm households increases the amount of soybean market supply by 0.154 tons. This may be the result of farmers’ improving knowledge and expertise in farming operations, which raises output and productivity. The model’s output also showed that regular interactions between farmers and extension personnel had a negative and substantial impact on the amount of soybean market supply at (p < 0.05). The outcome showed that for farmers who regularly interacted with extension agents, the amount of soybean market supply was decreased by 0.237 ton. In order to receive services and guidance, farmers may not always contact extension staff. Farmers may waste time and have detrimental effects on farming operations as a result of their daily interactions. Because there aren’t any everyday innovations that benefit farmers, this could be one of the causes of the negative association between farmers’ daily interactions and the quantity of the market’s supply. When taking into account the current circumstances and marketing, providing farmers with appropriate and targeted agricultural extension services can increase production and productivity. Farmers can be persuaded to use these technologies if they regularly communicate with development agents at the appropriate times and receive a variety of information on various soybean varieties with full recommended packages. Utilizing recommended soybean packages and better soybean varieties boosts farmers’ output and productivity, which increases the supply of soybeans on the market. The finding agrees with(Abrha et al., Citation2020; Usman, Citation2016)who found that the existence of significant and positive relationship between onion and wheat market supply and extension service. The result is also in line with(Achamyelh et al., Citation2020; Byron et al., Citation2014) who confirmed positive correlation of extension contact and market participation of soybean producer farmers with surplus outputs. The findings of (Ademe et al., Citation2018) also confirmed that the quantity of maize market supply is increased by 0.1404 ton when farmers frequently contacted with extension agents at the right time.
Market distance
It is a continuous variable that describes how many hours it takes the household to go to the closest market. The quantity of soybean supply is negatively and significantly affected by distance to the closest market at (p < 0.05). The OLS model’s findings showed that as the distance to the closest market grew by an hour, the amount of soybean market supply decreased by 0.086 ton. Households that are located distant from marketplaces are compelled to pay higher transportation costs for goods and inputs as well as endure long distances on foot, which lowers their degree of participation in production. This could be the cause of those far-off farmers’ insufficient access to soybeans. The result agrees with(Sori, Citation2021) who indicated that a minute decrease in walking distance of households increased the quantity of ground nut by 0.012 quintal. The finding is consistent with(Mussema et al., Citation2013) who confirmed that a minute decrease in walking distance to reach the nearest market increases households’ market participation by 0.97%. The finding by(Tesfaw, Citation2013)and(Melaku & Ashalatha, Citation2016)confirmed that distance to reach the nearest market affects quantity of pepper and teff market supply negatively and significantly. The finding is also in line with(Goshme et al., Citation2018)who found that quantity of sesame market supply is decreased by 0.024 ton as distance to the nearest market increased by a kilometer.
Cooperative membership: The quantity of soybean market supply was positively and significantly influenced by cooperative participation at (p < 0.1). The OLS model’s findings show that for farmers who are cooperative members, the quantity of soybean provided to the market rises by 0.018 ton. This illustrates that cooperative leaders and other backers can provide members with better information and understanding about the advantages of soybean production and marketing. Cooperative members have good market options and can obtain production inputs through cooperatives or unions; as a result, they are compelled to produce excess outputs for the market, which may be one of the factors contributing to the positive and significant correlation between cooperative membership and the volume of the market’s supply. The finding is consistent with (A. W. Belayneh et al., Citation2022) who confirmed a positive and significant relationship of cooperative membership and quantity of sesame market supply.
Credit access
It is a dummy variable that will be set to 1 for households that have access to credit and facilities in the 2018–19 growing season and 0 otherwise. The presence of credit facilities has a favorable and substantial effect on the amount of soybean market supply at (p < 0.05). According to the model’s results, farmers who had access to credit facilities saw an increase in the supply of soybeans on the market of 0.201 tons. Credit can increase farmers’ purchasing power for agricultural inputs, which increases crop surplus production for the market as a result of productivity improvements. The result is consistent with(Ali & Awade, Citation2019)who confirmed that having a full amount of credit positively and significantly influences surplus production of soybean and market return. The result is also similar to(Seven & Tumen, Citation2020)who found that credit utilization increases farmers’ productivity and this leads to an increase quantity of marketed surplus.
Family size: It was expected that would either have a positive or negative impact on the amount of soybean market supply was available. The model’s output showed that family size has a negative and significant influence on the amount of soybean market supply at (p < 0.05). In accordance with the model’s findings, each additional family size leads in a 0.095 ton decrease in the market’s supply of soybeans. This implies that even though soy consumption is not ingrained in the study area, Pawe Agricultural Research Center is currently promoting soy dishes by providing trainings on the nutritional benefits of soy and how to prepare soy foods like porridge, soy milk, bread, and kukis for local consumption. This opportunity boosts the amount of soy foods consumed in the area, and households with larger family sizes use more soybeans overall, which may account for the decline in the market supply of soybeans. The finding is similar to(Ademe et al., Citation2018)and(Usman, Citation2016)who confirmed the quantity of maize and wheat supply is decreased by 0.0379 and 0.005 ton respectively as the family size increased by one. The result is also in line with(Leta, Citation2018)who found negative and significant relationships between the quantity of teff marketed and family size of the household.
Access to market information
Farmers who desire to produce surplus outputs for marketing ought to have access to market information. The quantity of soybean market supply is positively and significantly influenced by access to market information at (p < 0.01), as expected. The model result shows that the quantity of soybean supply to the market increases by 0.448 ton when farmers gain access to market information. This suggests that farmers who are unable to obtain market price information on a certain item are not producing as much and are unable to set aside more area for cultivation, which decreases the amount of market supply. The finding is consistent with(Awoke & Molla, Citation2019)who confirmed that the quantity of potato market supply increased by 0.7316 ton for a household who had access market information. The finding also agrees with(Zamasiya et al., Citation2014) who found a positive correlation between access to market information and soybean marketed surplus.
Soybean farm experience: The length of the households’ engagement in soybean production is a continuous variable measured in years. The household’s experience with soybean farming has a positive and significant impact on the volume of soybean market supply at (p < 0.01). The model’s result showed that as soybean growers’ farm experience increased by a year, the quantity of the market supply of soybeans increased by 0.097 tons. This indicates that households with farming experience have the knowledge and abilities to implement agronomic techniques and other farming activities very well. This increases their output and productivity, which may be why more goods were produced by experienced households and sold on the market. The finding is consistent with(Modeste et al., Citation2018) and(Melaku & Ashalatha, Citation2016)who found that significant and positive relationships between the quantity of market supply and soybean and teff farm experience. The finding is also similar to(Giziew, Citation2019)who obtained that onion market supply is increased by 0.0019 ton as the farm experience of onion producers increased by a year. This result also agrees with the findings of(Ali et al., Citation2015)and(Girma et al., Citation2017)who found a strong and positive relationship between farm experience and quantity of sesame and haricot bean marketed.
Cultivated land size of the household head
It is a continuous variable that refers to the total land size that the household cultivated during the 2018/19 growing season. The volume of soybean supplied to the market is positively and significantly affected by the availability of more cultivated land at (p < 0.01). As the area of cultivated land increased by a hectare, the supply of soybeans to the market increased by 0.350 tons. If farmers have more cultivated land, they can set aside additional farmlands for soybean production. Because farmers grow a variety of food crops for domestic use in addition to cash crops, they cannot set aside area for soybean cultivation if they only have modest amounts of cultivated land. This could be the cause of farmers supplying the market with fewer products due to the limited area of arable land. The finding is similar to(Abele & Tefera, Citation2015; Abera et al., Citation2016; B. Belayneh et al., Citation2018) who confirmed that the quantity of haricot bean market supply increased by 0.203, 0.21 and 0.297 ton respectively for a hectare increase of landholding size for the farm households. The finding by(Goshme et al., Citation2018)also confirmed that sesame market supply increased by 0.68 ton for a hectare increase of land size. The finding is also in line with(Leta, Citation2018) who found the existence of positive and significant relationship between land size and quantity of teff market supply. Similar results observed from(Wake et al., Citation2019) and(Gezachew, Citation2018)who confirmed that positive and significant correlation of land size and quantity of soybean and wheat market supply. Results of(Yegon et al., Citation2015) also indicated that land size positively and significantly increased the quantity of soybean market supply.
6. Conclusion
The overall findings of this study show that soybean production is a profitable crop for smallholder farmers in the study area although productivity is much below the national average resulting in 28.33% of cultivated land was set aside for it. Since the majority of the output was exported as a grain with little additional value added the contribution of this soybean sub-sector to overall economic growth was less than anticipated. The model results reveal that productivity, lagged price, market information, soybean farm experience, size of cultivated land, credit access, cooperative membership, and weekly extension contact were positively and significantly associated with the quantity of soybean market supply. Market distance, family size, and daily interaction between farmers and extension agents were all negatively and significantly correlated with the quantity of soybeans being supplied to the market. Additionally, farm households that completed their preparatory school education had a positive and significant impact on the volume of soybeans supplied to the market. Ethiopia only has one plant for the production of soybean oil, thus it must import vast quantities of byproducts of soybean oil and other products every year to meet domestic demand.
7. Recommendations
To meet domestic demand and save foreign currency through import substitution, the government must place more emphasis on the construction of more soybean oil processing plants in the country’s prospective producing areas. In order to receive the anticipated return from soybeans and maintain sustainable output, producers must be connected to processors through unions directly. Edible oil plants are now being built, and soybeans are thought of as the primary crop for oil production. They are intended to replace imported oil and cover domestic oil use. However, there isn’t enough production going on right now to meet demand. To raise the status of soybean production and secure a sustainable supply for the market, producers, experts, researchers, and other concerned bodies must exert unfettered and unreserved effort. The result of multiple linear regression analysis shows that the quantity of soybean market supply was positively and significantly influenced by productivity, lagged price, market information, credit access, weekly extension contact, soybean farming experience, cooperative membership, and size of cultivated land. These variables need to be given more attention and promoted. With the help of development agents, experts, and other relevant bodies, it is possible to increase surplus output by increasing soybean production and productivity through the adoption of improved varieties with full packages and other recommended agronomic practices.
Author contribution
All the authors contributed in research conceptualization, designing data collection methods, analysis and final draft manuscript preparation.
Consent for publication
All authors agreed on the publication of this paper and assigned corresponding author responsible in charge for correspondence during manuscript publishing.
Acknowledgements
The first author would like to acknowledge Ethiopian Institute of Agricultural Research for funding this research.
Disclosure statement
No potential conflict of interest was reported by the author(s).
Additional information
Funding
Notes on contributors

Takele Atnafu Delele
Takele Atnafu Delele works as a researcher in Pawe Agricultural Research Center, department of agricultural extension and communication research, Pawe, Ethiopia. He actively participates in the research system, with a particular emphasis on the value chain, technological adoption and agricultural extension. Value chain, adoption and introduction of new technologies are some of his research interests.
Almaz Giziew Adugna
Almaz Giziew Adugna is a researcher and an associate professor from Bahir Dar University, Ethiopia. She published 17 research articles, 15 research outputs as proceedings and 11 working papers. Her research interest focusing on Gender, Value chain, Agricultural technology adoption, Agricultural extension, and socio-economic aspects of rural development.
Birhanu Melesse Gelaw
Birhanu Melesse Gelaw presently working as Asst. Prof at Dept. of Rural Development and Agricultural Extension, Bahir Dar University, Ethiopia. He actively engages in teaching, research and community services. He teaches post-graduate students on topics of rural livelihoods, food security, agricultural extension, cooperatives, technology adoption, and value chain management.
References
- Abele, W., & Tefera, T. (2015). Factors affecting production and market supply of haricot bean in Southern Ethiopia. Journal of Economics and Sustainable Development, 6, 103–21. https://core.ac.uk/download/pdf/234647183.pdf
- Abera, S., Alemu, D., & Zemedu, L. (2016). Determinants of haricot bean market participation in misrak Badawacho district, hadiya zone, southern nations nationalities and peoples regional state, Ethiopia. Ethiopian Journal of Agricultural Sciences, 26, 69–81. https://www.ajol.info/index.php/ejas/article/view/142805
- Abrha, T., Emanna, B., & Gebre, G. G. (2020). Factors affecting onion market supply in Medebay Zana district, Tigray regional state, Northern Ethiopia. Cogent Food & Agriculture, 6, 1712144. https://doi.org/10.1080/23311932.2020.1712144
- Achamyelh, K., & Hailemariam, M. (2020). Challenges and opportunities of soybean marketing in Chewaka District, Ethiopia. Asian Journal of Economics, Business and Accounting, 13–22. https://doi.org/10.9734/ajeba/2020/v17i130250
- Achamyelh, K., Shumeta, Z., Tesfaye, A., & Hailemariam, M. (2020). Soybean (Glycine max (L.) Merril) value chain analysis in case of Jimma Zone, Southwestern Ethiopia. International Journal of Economic and BusinessManagement, 8, 1–10. https://www.academicresearchjournals.org/IJEBM/PDF/2020/January/Kumilachew%20et%20al.pdf
- Ademe, A., Zemedu, L., & Abajobir Bekele, N. (2018). Analysis of maize value chain: The case of Guduru Woreda, Horro Guduru Wollega zone of Oromia regional state. Haramaya University.
- Afework, H., & Adam, B. (2018). Cost and returns of soybean production in Assosa Zone of Benishangul Gumuz Region of Ethiopia. Journal of Development and Agricultural Economics, 10(11), 377–383. https://doi.org/10.5897/JDAE2018.0952
- Ahlers, C., Broll, U., & Eckwert, B. (2013). Information and output in agricultural markets: The role of market transparency. Agricultural and Food Economics, 1(1), 1–10. https://doi.org/10.1186/2193-7532-1-15
- Ali, E., & Awade, N. E. (2019). Credit constraints and soybean farmers’ welfare in subsistence agriculture in Togo. Heliyon, 5(4), e01550. https://doi.org/10.1016/j.heliyon.2019.e01550
- Ali, A., Salawu, A., & Sani, R. (2015). Factors Influencing Sesame (Sesamun indicum L) Marketing in Jigawa State, Nigeria. Journal of Agricultural Extension, 19(2), 126–133. https://doi.org/10.4314/jae.v19i2.11
- Awoke, W., & Molla, D. (2019). Market chain analysis of potato and factors affecting market supply in West Gojam zone, Ethiopia. Journal of Development and Agricultural Economics, 11(2), 43–51. https://doi.org/10.5897/JDAE2018.0988
- Ayalew, B., Bekele, A., & Mazengia, Y. (2018). Analysis of cost and return of soybean production under small holder farmers in Pawe District, North Western Ethiopia. Journal of Natural Sciences Research, 8, 28–34. https://core.ac.uk/downloadpdf/234657659.pdf
- Ayele, A., Erchafo, T., Bashe, A., & Tesfayohannes, S. (2021). Value chain analysis of wheat in Duna district, Hadiya zone, Southern Ethiopia. Heliyon, 7(7), e07597. https://doi.org/10.1016/j.heliyon.2021.e07597
- Banda, G. N., Nyengere, J., & Chinkhata, D. (2017). Factors contributing to continued dependence on family food and income among graduate farmers of School of Agriculture for Family Independence (SAFI). Journal of Agricultural Extension and Rural Development, 9(9), 202–206. https://doi.org/10.5897/JAERD2017.0880
- Belayneh, B., Tefera, T., & Lemma, T. (2018). Determinants of Common Bean (Phaseolus Vulagris L.) marketed surplus among smallholder farmers in Humbo and Damot Gale Woredas, Southern Ethiopia. Journal of Food Industry, 2(1), 20–29. https://doi.org/10.5296/jfi.v2i1.13898
- Belayneh, A. W., Yesho, E. G., Gemeyida, K. H., & Merah, O. (2022). Determinants of sesame market supply in West Omo and Bench Sheko zones, Southwest Ethiopia. International Journal of Agronomy, 2022, 1–8. https://doi.org/10.1155/2022/5134478
- Byron, Z., Nelson, M., Kefasi, N., & Shephard, S. (2014). Determinants of soybean market participation by smallholder farmers in Zimbabwe. Journal of Development and Agricultural Economics, 6(2), 49–58.
- Danso-Abbeam, G., Ehiakpor, D. S., & Aidoo, R. (2018). Agricultural extension and its effects on farm productivity and income: Insight from Northern Ghana. Agriculture & Food Security, 7(1), 1–10. https://doi.org/10.1186/s40066-018-0225-x
- Degefa, K., Biru, G., & Abebe, G. (2020). Input-output market information access and methods of selling maize and tomato products in Bako Tibe and Guto Gida districts, Ethiopia. Journal of Investment and Management, 9(2), 47–55. https://doi.org/10.11648/j.jim.20200902.12
- De Maria, M., Robinson, E. J., Kangile, J. R., Kadigi, R., Dreoni, I., Couto, M., Howai, N., & Peci, J. (2020). Global soybean trade-the geopolitics of a bean. http://dx.doi.org/10.34892/7yn1-k494
- Dibaba, T. L. (2021). Market chain analysis of teff in Tole Woreda, Ethiopia. International Journal of Agricultural Science and Food Technology, 7(1), 20–30. https://doi.org/10.17352/2455-815X.000083
- Edosa, T. L. (2018). Determinants of commercialization of teff crop in abay Chomen district, Horo Guduru Wallaga zone, Oromia regional state, Ethiopia. Journal of Agricultural Extension and Rural Development, 10(12), 251–259. https://academicjournals.org/journal/JAERD/article-full-text-pdf/A8E382E59659
- Fentahun, G.-E. (2019). Production and marketing trends of soy bean in Ethiopia. https://doi.org/10.7176/jmcr%2F59-02
- Fredendall, L. D., & Hill, E. (2000). Basics of supply chain management. CRC Press.
- Gebremedhn, M. B., Tessema, W., Gebre, G. G., Mawcha, K. T., Assefa, M. K., & Yildiz, F. (2019). Value chain analysis of sesame (Sesamum indicum L.) in Humera district, Tigray, Ethiopia. Cogent Food & Agriculture, 5(1), 1705741. https://doi.org/10.1080/23311932.2019.1705741
- Getahun, A., & Tefera, E. (2016). Soybean value chain assessment study in northwestern Ethiopia, Metekel zone. Asian Journal of Agricultural Extension, Economics & Sociology, 14(4), 1–14. https://doi.org/10.9734/AJAEES/2016/27048
- Gezachew, F. (2018). Factors affecting marketing intensity of wheat growers in southeastern Ethiopia. Journal of Agricultural Science and Food Research, 9(1), 3 4.
- Girma, T., Tefera, T., Kaske, D., & Shashemene, E. (2017). Determinants and resource use efficiency of haricot bean production in Halaba Special District, Southern Ethiopia. Journal of Economics and Sustainable Development, 8, 12–19.
- Giziew, A. (2018). Analysis of gender and determinants of market supply of onion in Dugda District, East Shoa, Ethiopia. Journal of Agriculture and Environmental Sciences, 3. https://ejol.ethernet.edu.et/index.php/JAES/article/view/1179
- Giziew, A. (2019). Analysis of gender and determinants of market supply of onion in Dugda District, East Shoa, Ethiopia. Journal of Agriculture and Environmental Sciences, 3. https://www.semanticscholar.org/paper/Analysis-of-Gender-and-Determinants-of-Market-of-in-Giziew/9c4091c3db9e52f6ef4b0a09fc6543f30417725a
- Goshme, D., Tegegne, B., & Zemedu, L. (2018). Determinants of sesame market supply in Melokoza District, Southern Ethiopia. International Journal of Research Studies in Agricultural Sciences (IJRSAS), 4, 1–6. http://dx.doi.org/10.20431/2454-6224.0410001
- Hailu, M., & Kelemu, K. (2014). Trends in soy bean trade in Ethiopia. Research Journal of Agriculture and Environmental Management, 3, 477–484. https://www.researchgate.net/publication/316644739
- Hasan, N., Suryani, E., & Hendrawan, R. (2015). Analysis of soybean production and demand to develop strategic policy of food self sufficiency: A system dynamics framework. Procedia Computer Science, 72, 605–612. https://doi.org/10.1016/j.procs.2015.12.169
- Leta, E. T. (2018). Determinants of commercialization of teff crop in abay Chomen district, Horo Guduru Wallaga zone, Oromia regional state, Ethiopia. Journal of Agricultural Extension and Rural Development, 10(12), 251–259. https://doi.org/10.5897/JAERD2018.0970
- Lopoyetum, S. K., Senapathy, M., & Kumar, M. P. (2014). Marketing Supply Chain Channels of Primary Coffee Co-Operatives in Ethiopia, East African Region-Empirical Study. International Journal of Management and Development Studies, 3, 8–32.
- Maulu, S., Hasimuna, O. J., Mutale, B., Mphande, J., Siankwilimba, E., & Yildiz, F. (2021). Enhancing the role of rural agricultural extension programs in poverty alleviation: A review. Cogent Food & Agriculture, 7(1), 1886663. https://doi.org/10.1080/23311932.2021.1886663
- Melaku, T., & Ashalatha, D. (2016). Determinants of teff and wheat market supply in Dendi district, West Shoa zone, Ethiopia. International Journal of Current Research, 8, 40716–40721. https://www.journalcra.com/article/determinants-teff-and-wheat-market-supply-dendi-district-west-shoa-zone-ethiopia
- Mirie, T., & Zemedu, L. (2018). Determinants of market participation and intensity of marketed surplus among teff producers in Dera District of South Gondar Zone, Ethiopia. Journal of Development and Agricultural Economics, 10(10), 359–366. https://doi.org/10.5897/JDAE2018.0954
- Modeste, M., Mulyungi, P., Wanzala, F. N., Eric, N., & Aimable, N. (2018). Effect of social-economic factors on profitability of soya bean in Rwanda. International Journal of Scientific & Engineering Research, 9, 828–833.
- Mussema, R., Kassa, B., Alemu, D., & Rashid, S. (2013). Analysis of the determinants of small-scale farmers’ grain market participations in Ethiopia: The contribution of transaction costs. Ethiopian Journal of Agricultural Sciences, 23, 75–94. https://www.ajol.info/index.php/ejas/article/view/142781/132613
- Nitsuh, H. (2019). MARKET CHAIN ANALYSIS OF TEFF (Eragrostistef): THE CASE OF DEJEN DISTRICT. EAST GOJAM ZONE.
- Oljira, A., & Goshu, D. (2017). Determinants of potato seed market supply through producer cooperatives in Haraghe, Ethiopia. Journal of Development and Agricultural Economics, 9(11), 312–319. https://doi.org/10.5897/JDAE2017.0849
- Raidimi, E., & Kabiti, H. (2019). A review of the role of agricultural extension and training in achieving sustainable food security: A case of South Africa. South African Journal of Agricultural Extension, 47, 120–130. http://dx.doi.org/10.17159/2413-3221/2019/v47n3a520
- Seven, U., & Tumen, S. (2020). Agricultural credits and agricultural productivity: Cross-country evidence. The Singapore Economic Review, 65(supp01), 161–183. https://doi.org/10.1142/S0217590820440014
- Shah, J. A., Asmuni, A., & Ismail, A. (2013). Roles of extension agents towards agricultural practice in Malaysia. International Journal on Advanced Science, Engineering and Information Technology, 3(1), 59–63. https://doi.org/10.18517/ijaseit.3.1.278
- Shea, Z., Singer, W. M., & Zhang, B. (2020). Soybean production, versatility, and improvement. Production and Uses. Legume Crops—Prospects.
- Siddique, A. (2015). The role of cooperative society for marketing agricultural products in Bangladesh. Global Journal of Management and Business Research. https://globaljournals.org/item/4946-the-role-of-cooperative-society-for-marketing-agricultural-products-in-bangladesh
- Sori, O. (2021). Factors affecting groundnut market supply in Western Oromia, Ethiopia. Heliyon, 7(1), e05892. https://doi.org/10.1016/j.heliyon.2020.e05892
- TadeleMelakuChalla, M., & PaulMansingh, J. (2016). FACTORS AFFECTING TEFF AND WHEAT MARKET SUPPLY IN DENDI DISTRICT. WEST SHOA ZONE.
- Taye, M., Abebe, B. D., & Tadie, M. A. (2018). Determinants of commercialization by smallholder onion farmers in Fogera district, South Gondar Zone, Amhara national regional State, Ethiopia. Journal of Development and Agricultural Economics, 10(10), 339–351. https://doi.org/10.5897/JDAE2018.0964
- Tefaye, W., & Beshir, H. (2014). Determinants of technical efficiency in maize production: The case of smallholder farmers in Dhidhessa district of Illuababora zone, Ethiopia. Journal of Economics and Sustainable Development, 5, 274–284.
- Tesfaw, A. (2013). Determinants of agricultural commodity market supply: A case study in the upper watershed of the Blue Nile, Northwestern Ethiopia. Journal of Agribusiness and Rural Development, 30, 243–256. https://agris.fao.org/agris-search/search.do?recordID=DJ20220160030
- Usman, S. (2016). Analysis of wheat value chain: The case of Sinana District. Haramaya University.
- Uyanık, G. K., & Güler, N. (2013). A study on multiple linear regression analysis. Procedia-Social and Behavioral Sciences, 106, 234–240. https://doi.org/10.1016/j.sbspro.2013.12.027
- Wake, R. D., Yami, M., & Bekele, A. (2019). Determinants of productivity and technical efficiency in soybean production among small-holder farmers. International Journal of Agriculture & Agribusiness, 3, 227–242.
- Wondim, A., & Desselgn, M. (2019). Market chain analysis of potato and factors affecting market supply in West Gojam Zone, Ethiopia. Journal of Development and Agricultural Economics, 11(2), 43–51. https://doi.org/10.5897/JDAE2018.0988
- Yamane, T. (1967). Statistics: An introductory analysis. https://www.researchgate.net/figure/A-simplified-formula-to-calculate-samlple-size-Yamane-1967-fig4-281629128
- Yegon, P. K., Kibet, L. K., & Lagat, J. K. (2015). Determinants of technical efficiency in smallholder soybean production in Bomet District, Kenya. Journal of Development and Agricultural Economics, 7(5), 190–194. https://doi.org/10.5897/JDAE12.148
- Zamasiya, B., Mango, N., Nyikahadzoi, K., & Siziba, S. (2014). Determinants of soybean market participation by smallholder farmers in Zimbabwe. Journal of Development and Agricultural Economics, 6(2), 49–58. https://doi.org/10.5897/JDAE2013.0446
- Zhang, J., Luo, J., Li, J., & Vasa, L. (2021). Agricultural co-operatives participating in supply chain integration in China: A qualitative comparative analysis. Plos one, 16(4), e0250018. https://doi.org/10.1371/journal.pone.0250018
- Zoogah, A. T., & Nakuja, T. (2020). Modernizing extension services to improve rice productivity: Lessons from Ghanas planting for food and jobs program. Journal of Agricultural Extension and Rural Development, 14(4), 110–115. https://doi.org/10.5897/JAERD2020.1164
