
 ?Mathematical formulae have been encoded as MathML and are displayed in this HTML version using MathJax in order to improve their display. Uncheck the box to turn MathJax off. This feature requires Javascript. Click on a formula to zoom.
Abstract
This study investigates how far and by what factors the local rice cultivar X-Jigna is being replaced by the improved variety Shaga in the Fogera plain, Ethiopia. It applied a mixed-method research design. The explanatory method was used to analyze qualitative data, while simple descriptive and inferential statistics were used to analyze quantitative data. As a result, the adoption level of improved rice varieties was found to be too low (15%), while the vast majority of rice-growing households used X-Jigna. However, the explanatory analysis highlighted that Shaga outperforms X-Jigna in resilience to diseases and shattering, higher grain yield, and softness of injera and flour density traits. Consequently, its percentage share of area coverage increased from 1 to 12, while X-Jigna’s decreased from 95 to 84 within a short time. This phenomenon demonstrates great strides have been made in replacing X-Jigna with Shaga. Based on the results of logistic regression analysis, age, educational background, and experience in rice cultivation of household heads, land-owned size, and road and credit access significantly influence adoption decisions. Therefore, it is suggested that offering youth-oriented extension services, expanding education services, improving road infrastructure, and reducing bureaucracy in credit services are areas to be emphasized to improve adoption.
PUBLIC INTEREST STATEMENT
Rice was introduced to Ethiopia in the 1970s by North Korea. It is considered a strategic crop and is named the “Millennium Crop” because of its importance as a food security crop, a source of revenue, and job possibilities. A total of 39 varieties have been developed, despite their adoption level being quite low. The variety itself and the environment in which the variety is functioning are mentioned as sources of low adoption. Hence, this study aims to explore adoption drivers from the two perspectives using qualitative and quantitative analyses, as neither quantitative nor qualitative research is adequate to meet the underlying research aim. Accordingly, results showed great strides have been made in replacing X-Jigna with improved varieties, mainly Shaga. Offering youth-oriented extension, expanding education services, improving the road infrastructure, and reducing bureaucracy in credit institutions were taken as way-outs to enhance the adoption of improved rice varieties by smallholder farmers.
1. Introduction
Rice research and development in Ethiopia is a relatively recent phenomenon that has only been going on for about 50 years (Tadesse, Citation2019 &, Citation2020). Since then, successes have been documented with the active participation of many national and international actors. For instance, there was a 0.8-tonne improvement in productivity, a 65.4% rise in production, and a 20.6% increase in area coverage between 2009 and 2019 (Central Statistical Agency [CSA], Citation2010 &, Central Statistical Agency [CSA], Citation2020).
Despite all these successes, domestic rice production still does not satisfy the growing internal market demand of the country (Alemu & Thompson, Citation2020). The development of high-yielding rice varieties and the multiplication and dissemination of quality seeds were taken as a major intervention in the national GTP (Growth and Transformation Plan) to address major challenges of the rice sector in Ethiopia (National Plan Commission [NPC], Citation2016). Accordingly, since its inception, NARS (National Agricultural Research System) has developed 39 improved rice varieties targeting the lowland, upland, and irrigated ecosystems, of which at least 6 of them were released explicitly for Fogera plain to replace the longstanding local rice cultivar X-Jigna (Atnaf et al., Citation2021; Ministry of Agriculture [MoA], Citation2020).
Despite their availability, the adoption level of many improved rice varieties in different rice hubs of the country is too low (Atnaf et al., Citation2021; Dessie et al., Citation2021; Gizaw et al., Citation2017; Hagos et al., Citation2018). Scholars have been debating on the sources of low adoption. One group primarily criticizes the technology itself, while another places the blame on the environment in which the technology is functioning. For instance, a study by Dessie et al. (Citation2021) attributed rice seed system, extension services, and mechanization as the main causes of low adoption, while a study by Atnaf et al. (Citation2021) prominently associated low adoption with the approach which rice technology has been developed.
Furthermore, from a methodological point of view, many studies on technology adoption have exclusively used a quantitative approach (Fikire et al., Citation2022; Kassa et al., Citation2021; Massresha et al., Citation2021; Zeleke et al., Citation2021), yet, it is believed that neither quantitative nor qualitative research is adequate to meet underlying research aims in rice commodity. In such a case, mixing the two methods might be superior to a single method as it is likely to provide rich insights into the research phenomena that cannot be fully understood by using only qualitative or quantitative methods (Poth & Munce, Citation2020).
Therefore, the primary aim of the study is to explore drivers of adoption of improved rice varieties, both from the technology’s attributes and rice-growing households’ individual characteristics, their access to biophysical factors as well as institutional and infrastructural structures. Accordingly, this study employed a mixed method design to have deep insight into how far and by what factors the longstanding, dominant, and local rice cultivar X-Jigna is being replaced by the recently released improved rice variety Shaga in the Fogera plain, which is recognized as the leading rice production hub in Ethiopia.
2. Literature review
2.1. Definition and concepts of adoption
Definition of adoption: According to Feder et al. (Citation1985), adoption is defined as an integration of innovation into farmers’ normal farming activities over an extended period. Adoption level can be viewed from two sides – individual and aggregate. Individual level of adoption is defined as the degree of use of innovation in long-run equilibrium when the farmer has full information about the innovation and its potential while aggregate adoption behavior. Diffusion is defined as the spread of innovation within a region. Furthermore, the adoption of an innovation is not a permanent behavior. Farmers may leave to use an innovation that was already accepted by them in a given period. A person may decide to stop using innovation for several personal, institutional, and social reasons, one of which could be the existence of another practice that is better at meeting farmers’ requirements (Dasgupta, Citation1989).
Measurement of adoption: Scholars have diverse judgments to categorize an individual as adopters and non-adopters of the innovation. Research articles (like Daniel et al., Citation2017; Endeshaw, Citation2019; Milkias, Citation2020) classify adopters as those who use the innovation for a single cropping season, while others define it as those who use innovation for about two consecutive cropping seasons (A. Anteneh et al., Citation2022; Gizaw, Citation2008). However, in our study, the adopter is defined as those who have grown rice for three consecutive cropping seasons using improved rice varieties.
Mode and sequence of adoption: The mode of agricultural innovation utilization is broadly categorized into two groups. The first one emphasizes adopting the entire package, whereas the second on adopting a package’s components in a step-by-step or sequential manner. The former approach is advocated by technical scientists, while the latter is promoted by field practitioners, particularly those involved in farming systems and participatory research groups. The national agricultural extension system of Ethiopia, however, has a strong inclination to push the adoption of innovations as a package. Adversaries of the whole package approach strongly argue that farmers do not adopt technologies as a package but rather adopt a single component or a few suitable technologies (Byerlee & De Polanco, Citation1986). The major reasons often given for the sequential adoption of a package of technologies are profitability, riskiness, uncertainty, lumpiness of investment, and institutional constraints (Leathers & Smale, Citation1991; Nagy & Sanders, Citation1990).
2.2. Theories and models of adoption
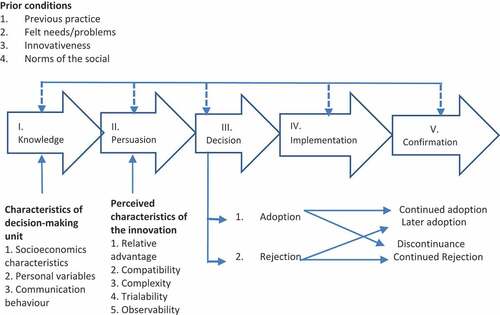
Innovation Diffusion Theory (IDT): According to IDT, the adoption of innovation happens after going through several stages including understanding, persuasion, decision, implementation, and confirmation (see, Figure ). Given E. M. Rogers’s (Citation2003), adoption is a decision to fully use innovation as the most ideal course of action and rejection is a decision not to use an innovation. In IDT, the components of diffusion of innovation are innovation, communication channels, time, and social system. This model assumes that both the characteristics of the decision-making unit and perceived characteristics of the innovation are the major influencing factors in making differences in the levels of adoption (E. Rogers, Citation1995).
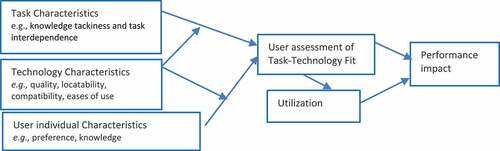
Task Technology Fit model (TTF): This model was developed by Goodhue and Thompson (Citation1995) to predict the utilization of technology and individual performance by examining the match between task requirements and technology characteristics. TTF is “the degree to which a technology assists an individual in performing his or her portfolio of tasks” (Goodhue & Thompson, Citation1995). More specifically, TTF is the correspondence between task requirements, individual abilities, and the functionality of the technology (see, Figure ). Research which is conducted on technology adoption/utilization mostly investigated the relationship between economic characteristics, attitudes, beliefs, and the use of information communication technologies (Lucas, Citation1975; Swanson, Citation1987). However, the adoption of innovation may not correlate with personal and institutional characteristics, but rather with the ability of the technology to address the needs and requirements of the user. A number of studies have confirmed the relationship between the technology fit factor and technology adoption (D’Ambra and Wilson (Citation2004; Vessey, Citation1991); Margherita (Citation2006); and D’Ambra et al., Citation2013). They provided evidence that the mismatch between technology and task characteristics hinders the decision-making process of the user. Finally, the main contribution of the TTF model lies in the interaction among external variables (i.e., task, technology, and individual characteristics) to behavioral constructs. A high degree of task-technology fit increases the likelihood of continued utilization of new technologies.
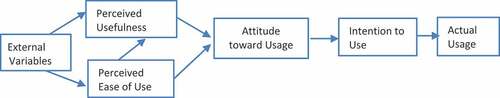
Technology Acceptance Model (TAM): This model has been intensively applied in technology adoption research. According to the model, perceived usefulness and perceived ease of use are the drivers of technology adoption, but their effect is not direct. Perceived ease of use is the degree to which an innovation is perceived not to be difficult to understand, learn, or operate (see, Figure ). The two drivers (i.e., perceived usefulness and perceived ease of use) influence individual’s attitude using the technology (Davis & Davis, Citation1989). Attitude towards new technology determines individual decision of actual system use. This model is very important to provide a quick way of gathering general information about an individual’s perception on a new technology (Samaradiwakara & Gunawardena, Citation2014).
In general, despite there are different theories and models of adoption including Innovation Diffusion Theory (IDT), Technology Acceptance Model (TAM), Theory of Reasoned Action (TRA)/Theory of Planned Behavior (TPB), and Task-Technology Fit Theory (TTF), this study selects TTF as the best-fitted theory to address the objective of the study.
2.3. Empirical literature review
2.3.1. Drivers of adoption of improved rice technologies
Several studies in Asia and Africa showed that variables under demographic, socioeconomic, perception, and infrastructural and institutional categories were identified as drivers of rice technology adoption. A study conducted in Nigeria using a logit model shows that the age of the household head had a negative relationship with the adoption of improved rice technology (Chukwu & Osuafor, Citation2010). The study also reveals that young farmers are more likely to adopt rice technology than older farmers. Young farmers are more willing to take risks than their counterfactual. In the same vein, Abbas and Jiang (Citation2018) confirm that the age of the household head has a significant and negative relationship with the adoption of improved rice varieties in Pakistan. Conversely, Samba et al. (Citation2000) revealed that age has a significant and positive relationship with improved rice variety adoption in Senegal.
Oladele et al. (Citation2019) reveal that farming experience had a significant relationship with the adoption of lowland rice production technologies in Ghana, Uganda, and Cameroon. Umeh and Chukwu (Citation2015) also confirm that experience in rice cultivation had a positive and significant relationship with the adoption of rice production technologies in Nigeria. They stated that this might be due to an increase in farming experience leading to increased awareness and the knowledge base of the farmers on rice technology adoption.
Many scholars confirm that education has a vital role in promoting new agricultural production technologies. This is due to the fact that educational level improves the level of understanding and evaluating improved rice technology. Umeh and Chukwu (Citation2015), Kumar et al. (Citation2016), and Oladele et al. (Citation2019) assert that there is a positive and significant association between educational level and the adoption of improved rice production technologies. Similarly, the study of Hagos and Zemedu (Citation2015) shows that the education level of the household head had a significant and positive relationship with the adoption of improved rice varieties in the Fogera district of Ethiopia. The frequency of extension contact is another factor that affects the adoption of agricultural technologies. Asmelash (Citation2014), Hagos and Zemedu (Citation2015), and Oladele et al. (Citation2019) confirm that the number of contacts between extension service providers and farmers positively and significantly affects the adoption of rice production technologies.
Farm size has two side effects on adoption decisions of agricultural production innovations. The study of Umeh and Chukwu (Citation2015) in Nigeria shows that the adoption of rice production technologies and farm size had a negative and significant relationship. They justified that it might be due to farmers who have small plots of land need to produce a maximum yield through adopting agricultural innovations. Conversely, Chukwu and Osuafor (Citation2010), Hagos and Zemedu (Citation2015), Onyeneke (Citation2017), and Francis et al. (Citation2021) reveal that there is a positive association between total land size holding and rice technology adoption.
Farmers’ perception of traits and risks of technology are key adoption drivers of crop production technologies. Samba et al. (Citation2000) found that farmers who had a positive perception of different attributes of newly released rice varieties had a significant and positive relationship with the adoption of the technology. On the other hand, risk perceptions were negatively and significantly related to adoption; farmers who perceived higher risk were less likely to adopt eco-friendly rice practices (Vo et al., Citation2018). Studies of Ghadim et al. (Citation2005), Herzon and Mikk (Citation2007), and Jerneck and Olsson (Citation2013) show that there is a positive relationship between farmers’ perception and technology adoption.
In general, many of the research articles considered in this review of literature used either logit or double hurdle model, although a few used Probit or Tobit. Concerning the explanatory variables incorporated in the analysis, despite some articles considering them using quantitative analysis methods rather than qualitative, most of them were categorized under farm household individual characteristics, biophysical, institutional, and infrastructural factors, which gave less emphasis to variables under the category of technology attributes. The explanatory variables that significantly influence farmers’ decisions in the use of rice and other crops technologies are summarized in Table and Table , respectively.
Table 1. Summary of studies on drivers of adoption of rice technologies in Asia and Africa
Table 2. Summary of studies on drivers of adoption of crop technologies in Ethiopia
3. Methodology
3.1. Description of the study area
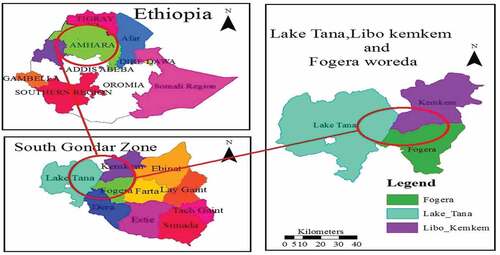
The South Gondar zone, one of the 12 zones that make up the Amhara region, is situated at 11°50ʹ18.6” latitude and 38°05ʹ58.3” longitude. It has 12 districts, including the study districts of Fogera and Libo-Kemkeme. It has a total population of 2,051,738 and an increase of 16% over the 1994 census, of whom 1,041,061 are men and 1,010,677 women and with an area of 14,095.19 square kilometers (Central Statistical Agency [CSA], Citation2007). The average land holding of rural households in the zone is 1 hectare which is greater than the national average and region average land holding, which is about 0.78 and 0.75 hectares respectively (Food and Agriculture Organization [FAO], Citation2018). It is predominantly recognized by rice production which approximately covers 70% of the rice grain supply in the country (Central Statistical Agency [CSA], Citation2018). The Fogera plain, which includes the districts of Fogera, Libo-Kemkeme, and Dera, is well known as a prospective rice-growing area in the zone (see, Figure ). Smallholder farmers have the opportunity to grow rice on a large scale in the plain because of its favourable climate and sufficient wetlands. Specific study districts within the plain have supplied a total of 43% of the nation’s rice grain production overall, with the contributions of Fogera and Libo-Kemkeme being 28% and 15%, respectively.
Figure 4. Location map of the study area.
3.2. Sampling procedure and sample size determination
Under the South Gondar zone, the two districts, namely, Fogera and Libo-Kemkeme, were selected purposively based on their potential in terms of rice production and coverage. This study used lists of rice-growing households prepared by respective districts’ agricultural offices as a sampling frame. After having lists of rice-producing households, sampling was undertaken from the lists using a systematic random sampling technique. To determine the minimum sample size, Yamane’s formula (1967) was employed.
Where n is the sample size, N is the number of total rice-growing households in the study area and e is the precision level. Of the 23,150 rice-producing households, with a precision level of 0.08, a total of 155 sample households drowned using the formula.
3.3. Types and sources of data
Both primary and secondary data were collected directly from a sample of rice-growing households and documentation from various institutions, such as the Fogera National Rice Research and Training Centre (FNRRTC) and district-level agricultural offices, respectively.
3.4. Methods of data collection
From primary data, quantitative data was collected via semi-structured questionnaire-based interviews, while qualitative data were collected utilizing checklists for key informant interviews and FGD (Focus Group Discussion). Both key informant interviews and group discussions were employed after the execution of the econometric model analysis. The semi-structured questionnaire was templated with CSPro software version 7.2 and pre-tested before implementing the actual data collection.
3.5. Methods of data analysis
STATA version 15 was used to analyze the data. Descriptive statistics including mean, percentage, and standard deviation were applied to characterize rice-growing households. Inferential statistical tools including independent t-test and chi-square test were employed to compare means of continuous explanatory variables and to indicate the relationship or interdependency of dummy explanatory variables of variety use category, respectively. The study used a binary logistic regression model to identify drivers of improved rice variety use decisions. The model was specified as follows:
Let Y be a binary outcome and X is an independent variable
in modelling px = P (Y = 1|X = x)
i.e., the probability of success for the covariate value of X = x.
The model was specified as
where log (px/1-px) is the logit function, b0 is the intercept, bi is the vector of parameters to be estimated, and xi is the vector of explanatory variables included in the model.
The main reason for using the logit model is due to the dual-decision nature of the dependent variable (Bewick et al., Citation2005). In this study, it is the rice variety use decision, whether the rice-producing farmers were using local X-Jigna rice cultivar or improved rice varieties. Based on the rice varieties use category, the model is specified below.
where ei is the error term. Because the nature of the dependent variable is dummy, interpreting the model results using the coefficient is not appropriate. As a result, the logit model results were interpreted using marginal effect or marginal change which shows the change in probability when the predictor or independent variable increases by a certain unit. Accordingly, the change in probability of using rice variety (either improved or local) is from 0 to 1.
Meanwhile, qualitative data were analyzed using explanatory research method to gain a thorough understanding of the phenotypic traits of rice varieties and thereby investigate how they influence farmers’ decision to use improved rice varieties and why the local rice cultivar X-Jigna is getting replaced by improved varieties such as Shaga. The results of the qualitative analysis were also used to justify how significant explanatory variables influence the adoption level of improved rice varieties.
3.6. Variables definition and hypotheses
The dependent variable of this study is rice variety use. The farmer who used improved rice varieties like “Shaga” was considered as an improved rice variety user, while “X-Jigna” users considered as local rice cultivar (variety) users. There are 14 explanatory variables in this inquiry (see Table ). Those variables were selected based on a critical literature review.
Table 3. Operational definition of variables
4. Results and discussion
4.1. Household and biophysical characteristics
This section in general deals with a simple description of sample households referring to their demographic and socio-economic characteristics. As shown in Table , the average age of the sample households head was 42 years and that implies the majority of the household heads are in the productive age group for crop cultivation. The majority of the total sample households (92.26%) were male-headed. The proportion of household heads that can read and write (50.32) was almost equivalent to those who were not able to read and write (49.68%). The average experience in rice cultivation of the household heads was 12 years. It is relatively smaller than the experiences of the households in other crops cultivation. It is because rice is a newly introduced crop for the study area as well for Ethiopia. The average household size of the sample households was 5. It is almost similar to the national rural household size which is 4.9 persons per household (Central Statistical Agency [CSA], Citation2007). The average on-farm income was 16,136.36 ETB,Footnote1 while the average off/non-farm income was 1,656.13 ETB. The figures depict that a higher portion of the total income has been generated from the production of a crop which implies households perused minimum livelihood diversification.
Table 4. Household and biophysical characteristics
The average land-owned size by the sample household was 0.73 hectares which is relatively very high compared with the national rural land owned size (Food and Agriculture Organization [FAO], Citation2018). In addition to having a relatively higher farmland size, the average number of farm plots in sample households was 4, which indicates that the sample households have a better chance to access the three rice ecosystems (upland rice, lowland rice, and irrigated rice) to cultivate different rice varieties. Having a higher number of plots is assumed to increase the probability or likely to allocate their piece of plot to try for improved rice variety. Furthermore, it is an opportunity for the sample households to minimize production and marketing risks by growing different crops.
4.2. Institutional and infrastructural characteristics
Concerning the institutional characteristics, as shown in Table , more than half of the sample households (54.19%) were members of the inputs cooperative to create access to crop intensification inputs including chemical fertilizers and improved crop varieties. The credit which is one of the most important agricultural inputs assumed to enhance the utilization of improved seeds, chemical fertilizers, pesticides, and labor was accessible for almost half (49.03%) of the sample households. Similarly, a bit higher than half (54.83%) of the sample households had better access to the road which could facilitate rice market participation both from the inputs and output sides. Moreover, the coverage of public-based extension services was found to be relatively high, where sample households were visited by the development agent and district-level experts with an average of more than 3 days per cropping season.
Table 5. Institutional and infrastructural characteristics
4.3. Adoption and diffusion of improved rice varieties
The dataset contains 155 rice-growing households, and of these, about 85% were non-adopters, while about 15% were adopters (see, Table ). These figures indicated that farmers in Fogera plain dominantly use local rice cultivar, known as X-Jigna. Similar phenomena also happened in some countries in Africa (Nonvide, Citation2021). However, from ample options of improved rice varieties, peculiar progress has been recorded on the utilization of Shaga, which is the recently released variety for the lowland rice ecology with an attainable yield of 5.0 and 6.8 tonnes per hectare at farmers’ and research fields, respectively (Ministry of Agriculture [MoA], Citation2020).
Table 6. Rice varieties adoption status of sample households
Furthermore, within three consecutive cropping seasons, Shaga’s percentage share of the area covered by improved and total cultivated was reached about 73 and 12, respectively, while X-Jigna’s percentage share of the total cultivated area has decreased from 95 to 84 (see, Table ). These numbers unequivocally show that great strides have been made in replacing the longstanding, dominant, and local rice cultivar X-Jigna with the promising improved rice variety Shaga. It also depicted that, in the study districts, the diffusion prospect of Shaga was found to be highly encouraging.
Table 7. Percentage share of rice cultivated area by variety in the study district
4.4. Comparative analysis of X-Jigna and Shaga
This section tries to address the influence of farmers’ perception of the phenotypic traits on the decision to use rice varieties using the explanatory analysis method. It also tries to investigate the relative advantages of X-Jigna and Shaga comparatively, referring to researchers’ data as well as using rice-growing farmers’ and district-level agriculture experts’ perspectives. Accordingly, as shown in Table , the grain yield of Shaga exceeds X-Jigna by more than a ton per hectare both in research and farmer fields despite X-Jigna exceeding Shaga in milling recovery. Results of FGD and key informant discussions with members of rice-growing households and experts, respectively, indicate that, in terms of phenotypic traits, X-Jigna comprehensively outperforms the majority of improved rice varieties which were assumed to have better productivity in the Fogera plain.
Table 8. Grain yield and milling recovery-based comparative analysis of X-Jigna and Shaga
Meanwhile, Shaga exceeds X-Jigna in grain yield performance, is competent in biomass yield, and, above all, complements the existing production challenge of X-Jigna, which is susceptible to rice sheath rot disease. For instance, a study done by Bigirimana et al. (Citation2015) in Rwanda indicated that rice sheath rot has become a highly destructive disease with a yield loss of up to 85%. Furthermore, farmers involved in FGD explained that Shaga has higher relative advantages over X-Jigna related to resistance to disease and shattering in a situation of high wind and rain. In general, farmers explained that X-Jigna has shown a tendency of losing its genetic potential as it has stayed for more than 3 decades in the production system without any support from responsible formal institutions to maintain its genetic purity.
According to farmers’ response in the FGD, with all of its limitations, using genetically pure seeds would allow X-Jigna to maintain its higher grain yield and thereby compete, if not outperform, the current grain yield potential of Shaga. Furthermore, despite farmers being well aware of the existing grain yield advantage of Shaga over X-Jigna, evidence showed that rice-growing farmers perceived and experienced that Shaga does not have a steady grain yield as of X-Jigna for so long. As farmers explain, using Shaga seed from their own saved source for more than three consecutive years has shown a radical decline in grain yield. Searching for access to reliable seed sources and shifting the production area to relatively highly fertile farmland were mentioned as the possible way-outs taken by rice-growing households to maintain the yield stability of Shaga.
On the other hand, X-Jigna is more popular in the market because of its white caryopsis color. Concerning grain sales value, according to farmer responses, X-Jigna was worth 12.7% more than Shaga. Currently, farmers in the study area have given value to the income generated from rice biomass sales. Accordingly, despite Shaga having a competitive biomass yield, the demand of a high labor force for threshing leads to deterioration in the quality of biomass, which ultimately affects its market value compared with X-Jigna. Again, in the FGD, X-Jigna growers might acquire an extra 2800 ETB advantage over Shaga on a hectare of land from rice biomass. On the contrary, Shaga significantly exceeds X-Jigna in terms of some traits related to consumption (softness of InjeraFootnote2 and high flour density). As shown in Table , using an equal amount of rice flour, Shaga gives a chance to produce an extra 117 injera over X-Jigna. In general, taking the importance of further in-depth comparative analysis of the two varieties for compressive phenotypic traits as a prerequisite, referring to the selected parameters and with existing socio-economic, institutional, and infrastructural situations, Shaga was found to be highly competitive with X-Jigna based on the perception of rice-growing farmers in the study area.
Table 9. Market value and flour density-based comparative analysis of X-Jigna and Shaga
4.5. Continuous independent variables by variety use decision
The mean difference of independent variables between X-Jigna and improved rice varieties use was compared using an independent t-test. As shown in Table , there was a significant mean difference between the local cultivar and improved variety users in age and land owned size at 5% and 1% levels of significance, respectively. Results showed that households using local rice cultivar were younger and had larger farmland than households using improved variety varieties. The local cultivar X-Jigna has many demanded traits in production, marketing, and utilization perspectives. Household heads in the younger age group passionately take into consideration the demanded traits of the cultivar for their production decisions.
Table 10. The mean comparison of continuous independent variables using t test
Furthermore, rice-growing households mainly living in bordering Lake Tana (waterlogged area) dominantly rely on X-Jigna despite having a fear of yield loss due to genetic potential loss, primarily emanating from a lack of institutional support to maintain its genetic purity. The sample households using improved rice varieties had smaller land-owned size compared with their counterparts. Rice-growing households having a smaller land-owned size are assumed to have surplus production for their consumption and the market merely attained through improving yield, which requires utilization of improved rice varieties, like Shaga. This assumption is being witnessed by farmers in FGD as it outperforms the dominantly cultivated rice X-Jigna.
4.6. Categorical independent variables by variety use decision
As shown in Table , the chi-square test result revealed that there were no relationships between the rice variety use decision and the independent categorical variables that were hypothesized to influence decision on adoption of improved rice varieties by rice-growing households, including sex, educational background, cooperative membership, road access, and lack of credit access.
Table 11. Relationship of categorical variables with a dependent variable using chi-square test
4.7. Drivers of adoption of improved rice varieties by rice-growing households
Identifying drivers of adoption of improved rice varieties and thereby resulting replacement of the longstanding, dominant, and local rice cultivar X-Jigna was estimated using a logit model. The Wald chi-square value of 39.716 was statistically significant at the 1% level of significance, showing that the explanatory variables included in this model are jointly explained the dependent variable. From the estimation result, the coefficients of the model indicate how a given variable influences the likelihood or probability of rice variety use decision (Table ). The result of the logistic regression analysis was interpreted using marginal effect. In the estimation process, 14 explanatory variables were included in the model. Out of them, six variables, including age, education, experience in rice cultivation, land-owned size, and road and credit accesses had significant influences on farmers’ decision to use improved rice varieties.
Table 12. Econometric model result
The age of the household head was statistically significant at 1% and had a positive influence on farmers’ decision to use improved rice varieties. The coefficient indicated an increase in age by 1 year increases the likelihood of using improved rice varieties by 0.4%. The same result was also found in the work of Udimal et al. (Citation2017). This may be due to the reason the majority of young rice-growing farmers get farmland from their parents, primarily situated in wetland areas that are highly suitable for growing the local cultivar X-Jigna.
The educational background of the household head was statistically significant at 5% and had a positive influence on farmers’ decision to use improved rice varieties. The coefficient indicated an increase in education level by 1 year increased the likelihood of using improved rice varieties by 7.6%. Household heads with relatively higher educational background have a probability of accessing different sources of information to make an information-based decision on technology utilization like the Shaga variety, which is currently demanded by many rice-growing households. This result is consistent with the findings of Hagos and Zemedu (Citation2015), Amare and Simane (Citation2017), Feyisa and Yildiz (Citation2020), and Massresha et al. (Citation2021).
Experience in rice cultivation was statistically significant at 5% and had a negative influence on farmers’ decision to use improved rice varieties. The coefficient indicated that an increase in rice cultivation experience by 1 year decreases the likelihood of using the improved rice varieties by 0.7%. The result implied that most experienced rice-growing farmers preferred the local X-Jigna over the majority of improved rice varieties. As shown in the FGD, although Shaga and X-Jigna were to be found to be highly competitive referees to different rice phenotypic traits, a remarkable number of rice-growing farmers had feared on yield stability of Shaga for so long. To maintain Shaga's yield potential, farmers were forced to shift their rice cultivation land to naturally more fertile land or have to buy improved rice seed from reliable seed sources every year. Similar results were also reported by Gizaw (Citation2008).
Road access was statistically significant at 10% and had a positive influence on farmers’ decision to use improved rice varieties. The coefficient indicated that having good road access increases the probability of using improved rice varieties by 5.5%. The household dominantly cultivated X-Jigna was located in a remote area, whereas the recently released and highly accepted improved rice variety, Shaga, was cultivated by households having better road access. Theoretically, if there is access to roads that connect rural farm households with the market, smallholder farmers can easily transport what they produce to the market, which in turn probably increases the farmers’ confidence to produce demand-based commodities for the market through the use of improved agricultural production inputs. This result is consistent with the findings of Zegeye et al. (Citation2022).
Land-owned size was statistically significant at 1%. The coefficient revealed that a one-hectare increase in land ownership decreases the probability of using improved rice varieties by 18.5%. This implies that households with smaller plots of farmland were forced to use improved rice varieties with higher productivity potential, like Shaga, to make up for rice produce shortfalls brought on by a shortage of farmland. A similar finding was also obtained by Massresha et al. (Citation2021).
Credit access was statistically significant at 5% and had a positive influence on farmers’ decision to use improved rice varieties. The coefficient indicated that access to credit increased the probability of using improved rice varieties by 5.4%. This means the recently developed improved rice variety Shaga has been distributed dominantly through formal or semi-formal seed institutions, including unions, cooperatives, and farmer groups, which require finance. Although rice-growing households have a higher propensity to take credit from formal institutions, participants of the FGD had capitalized that the challenges and bureaucracy in getting government credit institutions like ACSI (Amhara Credit and Saving Institution) highly influence their decisions in taking credit. In reverse, the local rice cultivar X-Jigna did not go through the formal and semi-formal seed institutions since it is not officially released or registered following the protocol of the national variety releasing committee, seed availability is primarily accomplished through the farmer-to-farmer exchange, a non-monetary form that does necessitate credit access. Similar results were reported by Tura et al. (Citation2010).
5. Conclusion and recommendations
The results of simple descriptive analysis showed that the adoption level of improved rice varieties was too low, while specifically, farmers’ decisions on the use of Shaga improved rice variety showed promising improvement. In addition, the results of the explanatory analysis revealed that Shaga has been chosen over X-Jigna because of its resilience to diseases and shattering, high grain yield, and higher floor density. Conversely, with its stable grain yield, white caryopsis color for better market value, and higher biomass yield and market value, X-Jigna was chosen above many improved rice varieties, including Shaga. Hence, this study concludes that among several rice varieties, the local X-Jigna and improved Shaga are highly competitive. Despite their competitiveness and farmers’ quest for Shaga’s yield stability, the longstanding, dominant, and local rice cultivar X-Jigna is progressively being replaced by the recently developed high-yielding improved rice variety Shaga. Moreover, based on the result of logistic regression analysis, findings confirm that the age and education level of the household heads and access to credit and road increase the probability of adoption of improved rice varieties, while land-owned size and rice farming experience decrease the probability of adoption of improved rice varieties.
Therefore, offering youth-oriented extension services, expanding the informal and formal education services, improving road infrastructure, and reducing the bureaucracy of government-based credit services should be improved to enhance the adoption of improved rice varieties and contribute to the national target of rice self-sufficiency by 2030.
Finally, some limitations this study has encountered have to be noted. First, gap in preferring the mode of adoption. This study stands from the field practitioners’ side, despite; the national agricultural extension system of Ethiopia having a strong inclination to push innovations as a package. Second, our result showed that the marginal effect of the experience in rice cultivation was negative. Based on the justification brought by rice-growing farmers in FGD, this unexpected result could be attributed to the risk of using improved rice varieties. Those who have more experience in rice cultivation were doubtful of the yield stability of improved rice varieties, including Shaga. A study by Ainembabazi and Johnny (Citation2014) investigated the relationship between the adoption of and experience with agricultural technologies. The study result showed that there is an inverted-U relationship between the adoption of and experience with agricultural technologies. Farming experience is found to be useful in the early stages of adoption of a given technology when farmers are still testing its potential benefits, which later determine its retention or dis-adoption over time. Hence, future research would address the unexpected result in our study which is the negative influence of experience in rice cultivation on the adoption of improved rice varieties to build on our early attempt and to estimate the true effects of the variable on rice technologies adoption preferable measured in a full package.
Correction
This article has been republished with minor changes. These changes do not impact the academic content of the article.
Disclosure statement
No potential conflict of interest was reported by the author(s).
Additional information
Funding
Notes on contributors

Adane Melak Beyene
Adane Melak Beyene is an agricultural extension researcher at the Ethiopian Institute of Agricultural Research. He obtained his BSc degree in the field of Rural Development and Agricultural Extension from Haramaya University in 2006 and his MSc in Rural Development from University College Cork and Hawassa University in 2012. He is currently a Ph.D. student in the field of Rural Development (Agricultural Commercialization and Rural Institutions stream) at Haramaya University. His research interests focus on scaling science, seed systems, crop commercialization and diversification, and food and nutrition security. He has published journal articles in the African Journal of Agricultural Research (AJAR), International Journal of Agricultural Economics (IJAE), International Journal of Research Studies in Agricultural Sciences (IJRSAS), Cogent Environmental Science, and World Scientific News (WSN).
Notes
1. ETB is Ethiopia currency which is equivalent to 1 US dollar to 44.32 ETB during data collection on 27 Dec. 2021
2. Injera is pancake-like soft bread in Ethiopia.
References
- Abbas, A. C., & Jiang, Y. (2018). Determinants of adoption of improved rice varieties in northern Sindh, Pakistan. Science Direct, 25(2), 103–21. http://dx.doi.org/10.1016/j.rsci.2017.10.003
- Ahmed, M., Mesfin, H., Abady, S., Mesfin, W., Kebede, A., & Aye, G. (2016). Adoption of improved groundnut seed and its impact on rural households’ welfare in Eastern Ethiopia. Cogent Economics & Finance, 4(1), 1–13. https://doi.org/10.1080/23322039.2016.1268747
- Ainembabazi, J., & Johnny, M. (2014). The role of farming experience on the adoption of agricultural technologies: Evidence from smallholder farmers in Uganda. The Journal of Development Studies, 50(5), 666–679. https://doi.org/10.1080/00220388.2013.874556
- Alemu, D., & Thompson, J. (2020). The Emerging Importance of Rice as a Strategic Crop in Ethiopia, Working Paper 44, Brighton, UK, Future Agricultures Consortium. https://doi.org/10.19088/APRA.2020.009
- Amare, A., & Simane, B. (2017). Determinants of smallholder farmers’ decision to adopt adaptation options to climate change and variability in the Muger Sub basin of the Upper Blue Nile basin of Ethiopia. Agriculture & Food Security, 6(64), 1–20. https://doi.org/10.1186/s40066-017-0144-2
- Anteneh, A., Abebe, A., & Siraw, G. (2022). Adoption of tef (Eragrostis tef) production technology packages in Northwest Ethiopia. Cogent Economics & Finance, 10(1), 1–25. https://doi.org/10.1080/23322039.2021.2013587
- Anteneh, M., Tesfahun, A., & Melak, A. (2021). Rice production, technologies adoption and its determining factors in Fogera-plain of North West Ethiopia. Journal of Economics and Sustainable Development, 12(7), 51–59. http://dx.doi.org/10.7176/JESD/12-7-06
- Asmelash, Y. (2014). Determinants of adoption of upland rice varieties in fogera district, South Gondar, Ethiopia. Journal of Agricultural Extension and Rural Development, 18(12), 332–338. https://doi.org/10.5897/JAERD12.108
- Atnaf, M., Dessie, A., Worede, F., Zewdu, Z., Berie, A., & Lakew, T. (2021). Why has a single rice cultivar dominated the lowland rice production portfolio of Ethiopia for so long? Ethiopian Journal of Agricultural Sciences, 31(2), 1–11
- Bewick, V., Cheek, L., & Jonathan, B. (2005). Statistics review 14: Logistic regression. In Critical Care (Vol. 9, pp. 112–118). https://doi.org/10.1186/cc3045
- Bigirimana, V. P., Hua, G. K. H., Nyamangyoku, O. I., & Höfte, M. (2015). Rice sheath rot: an emerging ubiquitous destructive disease complex. Journal Frontiers in Plant Science, 6(1066), 1–16. https://doi.org/10.3389/fpls.2015.01066
- Byerlee, D., & De Polanco, H. (1986). Farmers’ stepwise adoption of technological packages: Evidence from the Mexican Altiplano. American Journal of Agricultural Economics, 68(3), 520–527. https://doi.org/10.2307/1241537
- Central Statistical Agency [CSA]. (2007). Population and housing census of Ethiopia.
- Central Statistical Agency [CSA]. (2010). Report on area and production of crops (private peasant holdings, meher season). agricultural sample survey 2009/10 (2002 E.C.) (Vol. 4). Addis Ababa.
- Central Statistical Agency [CSA]. (2018). Report on area and production of major crops (private peasant holdings, meher season). Agricultural sample survey 2017/18 Vol. 1. Addis Ababa
- Central Statistical Agency [CSA]. (2020). Report on area and production of major crops (private peasant holdings, meher season). In Agricultural sample survey 2019/20 (2012 E.C.), Volume 1 (pp.1-147). Addis Ababa.
- Chukwu, V., & Osuafor, O. (2010). Socio-economic determinants of adoption of improved rice production technologies among rice farmers in Ebonyi state, Nigeria: A logit regression model approach. Elixir Agriculture, 94(2016), 39900–39908.
- D’Ambra, J., & Wilson, C. (2004). Use of the World Wide Web for international travel: Integrating the construct of uncertainty in information seeking and the task-technology fit (TTF) model. Journal of the American Society for Information Science and Technology, 55(8), 731–742. https://doi.org/10.1002/asi.20017
- D’Ambra, J., Wilson, C., & Akter, S. (2013). Application of the task-technology fit model to structure and evaluate the adoption of E-books by academics. John Wiley and Sons: Journal of the American Society for Information Science and Technology, 64(1), 48–64. https://doi.org/10.1002/asi.22757
- Daniel, M., Belaineh, L., Jema, H., & Lemma, Z. (2017). Determinants of the adoption of improved white haricot beans in east Shewa zone, South-Eastern Ethiopia. Journal of Development and Agricultural Economics, 9(12), 355–372. https://doi.org/10.5897/JDAE2017.0860
- Dasgupta, S. (1989). Diffusion of Agricultural Innovations in Village India Wiley Eastern Limited.
- Davis, F., & Davis, F. (1989). Perceived usefulness, perceived ease of use, and user acceptance of information technology. MIS Quarterly, 13(3), 319–339. https://doi.org/10.2307/249008
- Dessie, A., Worede, F., Atnaf, M., Tadesse, B., & Mengistu, G. (2021). Rice genetic improvement for different ecosystems in Ethiopia. In T. Tadesse, M. Atnaf, D. Alemu, T. Tadesse, & K. Shiratori (Eds.), Advances in rice research and development in Ethiopia (pp. 59–68). Ethiopian Institute of Agricultural Research.
- Endeshaw, G. (2019). Determinants of adoption of improved maize BH540 variety among smallholder farmer: The case of Dera woreda, south Gonder zone. M.Sc. Thesis. University of Gonder.
- Feder, G., Just, R. E., & Zilberman, D. (1985). Adoption of agricultural innovation in developing countries: A survey. Economic Development and Cultural Change, 32(2), 255–298. https://doi.org/10.1086/451461
- Feyisa, B. W., & Yildiz, F. (2020). Determinants of agricultural technology adoption in Ethiopia: A meta-analysis. Cogent Food & Agriculture, 6(1), 1–10. https://doi.org/10.1080/23311932.2020.1855817
- Fikire, A. H., Emeru, G. M., & Danish, S. (2022). Determinants of modern agricultural technology adoption for teff production: the case of Minjar Shenkora woreda, north Shewa zone, Amhara region, Ethiopia. Advances in Agriculture, 2022, 1–12. https://doi.org/10.1155/2022/2384345
- Fogera District Agriculture Office [FDAO]. (2021). District level annual report (unpublished).
- Fogera National Rice Research and Training Centre [FNRRTC]. (2021). Centre level annual report (unpublished).
- Food and Agriculture Organization [FAO]. (2018). Ethiopia: small family farms country factsheet.
- Francis, K., Kaloi, H. N., Charles, N., & Lucy, K. (2021). Determinants influencing the adoption of rice intensification system among smallholders in mwea irrigation scheme, Kenya. Hindawi: Advances in Agriculture, 2021, 1–8. https://doi.org/10.1155/2021/1624334
- Ghadim, A. K. A., Pannell, D. J., & Burton, M. P. (2005). Risk, uncertainty, and learning in adoption of a crop innovation. Agricultural Economics, 33(1), 1–9. https://doi.org/10.1111/J.1574-0862.2005.00433.X
- Gizaw, A. (2008). Adoption of chickpea technology package in Ada and Akaki woredas, Eastern Shewa, Ethiopia. M.Sc.Thesis. Haramaya University.
- Gizaw, G., Batu, M. M., & Tola, S. (2017). Determinants of rice production technology adoption in Fogera woreda, South Gondar, Ethiopia. Journal of Economics and Sustainable Development, 8(23), 19–23
- Goodhue, D., & Thompson, R. (1995). Task-technology fit and individual performance. MIS Quarterly, 19(2), 213–236. https://doi.org/10.2307/249689
- Hagos, H., Ndemo, E., & Yosuf, J. (2018). Factors affecting adoption of upland rice in Tselemti district, northern Ethiopia. Agriculture & Food Security, 7(59), 1–9. https://doi.org/10.1186/s40066-018-0210-4
- Hagos, A., & Zemedu, L. (2015). Determinants of improved rice varieties adoption in Fogera district of Ethiopia. Science, Technology and Arts Research Journal, 4(1), 221–228. https://doi.org/10.4314/star.v4i1.35
- Herzon, I., & Mikk, M. (2007). Farmers’ perceptions of biodiversity and their willingness to enhance it through agri-environment schemes: A comparative study from Estonia and Finland. Journal for Nature Conservation, 15(1), 10–25. https://doi.org/10.1016/j.jnc.2006.08.001
- Jerneck, A., & Olsson, L. (2013). More than trees! Understanding the agroforestry adoption gap in subsistence agriculture: Insights from narrative walks in Kenya. Journal of Rural Studies, 32, 114–125. https://doi.org/10.1016/j.jrurstud.2013.04.004
- Kassa, Y., Giziew, A., & Ayalew, D. (2021). Determinants of adoption and intensity of improved faba bean cultivars in the central highlands of Ethiopia: A double-hurdle approach. CABI Agric Biosci, 2(24), 1–12. https://doi.org/10.1186/s43170-021-00045-8
- Ketema, M., Kibret, K., Hundessa, F., & Bezu, T. (2021). Adoption of improved maize varieties as a sustainable agricultural intensification in Eastern Ethiopia: Implications for Food and Nutrition Security. Turkish Journal of Agriculture - Food Science and Technology, 9(6), 998–1007. https://doi.org/10.24925/turjaf.v9i6.998-1007.3937
- Kumar, A., Singh, R., Kumar, A., Betne, R., & Singh, K. (2016). Adoption of modern rice cultivation practices in Bihar, India: Micro-level evidences from village-level studies. Agriclture Research, 5(4), 433–439. http://dx.doi.org/10.1007/s40003-016-0234-6
- Leathers, H., & Smale, M. (1991). A Bayesian approach to explaining sequential adoption of components of technological package. American Journal of Agricultural Economics, 73(3), 734–742. https://doi.org/10.2307/1242825
- Lucas, H. (1975). Performance and the use of an information system. Management Science, 21(8), 849–966. https://doi.org/10.1287/mnsc.21.8.908
- Margherita, P. (2006). Determinants of adoption of High-Speed Data Services in the business market: Evidence for a combined technology acceptance model with task technology fit model. Elsevier Science Journal of Information & Management, 43(7), 847–860. https://doi.org/10.1016/j.im.2006.08.003
- Massresha, S. E., Lema, T. Z., Neway, M. M., Degu, W. A., & Shafiullah, M. (2021). Perception and determinants of agricultural technology adoption in North Shoa Zone, Amhara Regional State, Ethiopia. Cogent Economics & Finance, 9(1), 1–19. https://doi.org/10.1080/23322039.2021.1956774
- Milkias, D. (2020). Analysis on determinants of adoption of improved wheat technology in liben jewi District, Oromia Region, Ethiopia. International Journal of Applied Agricultural Sciences, 6(3), 36–43. https://doi.org/10.11648/j.ijaas.20200603.12
- Ministry of Agriculture [MoA]. 2020. Crop Variety Register. Plant variety release, protection and seed quality control directorate, ministry ofAgriculture Issue No. 23 Addis Ababa.
- Nagy, J., & Sanders, H. (1990). Agricultural technology development and dissemination within a farming systems perspective. Agricultural System, 32(4), 305–320. https://doi.org/10.1016/0308-521X(90)90097-A
- National Plan Commission [NPC]. (2016). National Growth and Transformation Plan II (GTPII) of the country. United Nations Ethiopia.
- Nonvide, G. M. (2021). Adoption of agricultural technologies among rice farmers in Benin. Review of Development Economics, 25(4), 1–19. https://doi.org/10.1111/rode.12802
- Oladele, O., Chimewah, A., & Olorunfemi, O. (2019). Determinants of farmers’ adoption of alternate wet and dry techniques in lowland rice production in Ghana, Uganda and Cameroon for climate smart agriculture. The Journal of Developing Areas, 53(3), 170–181. https://doi.org/10.1353/jda.2019.0045
- Onyeneke, R. (2017). Determinants of adoption of improved technologies in rice production in imo state, Nigeria. African Journal of Agricultural Research, 12(11), 888–896. https://doi.org/10.5897/AJAR2016.11737
- Poth, C., & Munce, S. E. P. (2020). Commentary—preparing today’s researchers for a yet unknown tomorrow: Promising practices for a synergistic and sustainable mentoring approach to mixed methods research learning. International Journal of Multiple Research Approaches, 12(1), 56–64. https://doi.org/10.29034/ijmra.v12n1commentary
- Rogers, E. (1995). Diffusion of Innovations. Free Press.
- Rogers, E. M. (2003). Diffusion of Innovations (5 th Edition) ed.). Free Press.
- Samaradiwakara, N., & Gunawardena, G. (2014). Comparison of existing technology acceptance theories and models to suggest a well improved theory/model. International Technical Sciences Journal, 1(1), 21–36.
- Samba, S., Devid, N., & Featherstone, A. (2000). Quantitative assessment of improved rice variety adoption: The farmer’s perspective. Agricultural Systems, 66(2), 129–144. https://doi.org/10.1016/S0308-521X(00)00040-8
- Seyyed, A., & Mohammad, S. (2012). Logistic regression analysis on factors affecting adoption of rice-fish farming in North Iran. Rice Science, 19(2), 153–160. https://doi.org/10.1016/S1672-6308(12)60034-1
- Swanson, E. B. (1987). Information Channel Disposition and Use. Decision Sciences, 18(1), 131–145. https://doi.org/10.1111/j.1540-5915.1987.tb01508.x
- Tadesse, T. (2019). Status and directions of rice research in Ethiopia. In T. Tadesse, M. Atnaf, D. Alemu, T. Tadesse, & K. Shiratori (Eds.), Advances in Rice Research and Development in Ethiopia (pp. 53–57). Ethiopian Institute of Agricultural Research.
- Tadesse, T. (2020). History, current status and future directions of rice research in Ethiopia. Journal of Emerging Technologies and Innovative Research, 7(2), 767–774.
- Tura, M., Aredo, D., Tsegaye, W., LaRovere, R., Tesfahun, G., Mwangi, W., & Mwabu, G. (2010). Adoption and continued use of improved maize seeds: Case study of central Ethiopia. African Journal of Agricultural Research, 5(17), 2350–2358. https://doi.org/10.5897/AJAR.9000024
- Udimal, T. B., Jincai, Z., Mensah, O. S., & Caesa, A. E. (2017). Factors influencing the agricultural technology adoption: the case of improved rice varieties (Nerica) in the Northern Region, Ghana. Journal of Economics and Sustainable Development, 8(8), 137–148
- Umeh, G., & Chukwu, V. (2015). Determinants of adoption of improved rice production technologies in Ebonyi State of Nigeria. Journal of Biology, Agriculture and Healthcare, 5(7), 170–176. 2224–3208
- Varsha, K., & Indrajit, T. (2018). Factors encouraging complete adoption of agricultural technologies: The case of hybrid rice cultivation in India. Journal of Agribusiness in Developing and Emerging Economies, 8(2), 270–287.
- Vessey, I. (1991). Cognitive Fit: A theory-based analysis of the graphs versus tables literature. Decision Sciences, 22(2), 219–240. https://doi.org/10.1111/j.1540-5915.1991.tb00344.x
- Vo, H., Nguyen, D., Yoshifumi, T., Steven, W., & Mitsuyasu, Y. (2018). Modelling the factors affecting the adoption of eco-friendly rice production in the Vietnamese Mekong delta. Cogent Food & Agriculture, 4(1), 1–24. https://doi.org/10.1080/23311932.2018.1432538
- Yamane, T. (1967). Statistics: An introductory analysis (2nd) ed.). Harper and Row.
- Zegeye, M., Fikire, A., & Meshesha, G. (2022). Determinants of multiple agricultural technology adoption: Evidence from rural Amhara region, Ethiopia. Cogent Economics & Finance, 10(1), 1–23. https://doi.org/10.1080/23322039.2022.2058189
- Zeleke, B. D., Geleto, A. G., Komicha, H. H., Asefa, S., & Zhang, X. (2021). Determinants of adopting improved bread wheat varieties in Arsi Highland, Oromia Region, Ethiopia: A double-hurdle approach. Cogent Economics & Finance, 9(1), 1–23. https://doi.org/10.1080/23322039.2021.1932040