
 ?Mathematical formulae have been encoded as MathML and are displayed in this HTML version using MathJax in order to improve their display. Uncheck the box to turn MathJax off. This feature requires Javascript. Click on a formula to zoom.
Abstract
Trading at prices above their fundamental values has been referred to as stock market Bubbles. These Bubbles, when Busted, can lead to a market Crash. From experience, it is a well-known fact that Bubbles initially occur in one particular sector and later spread to the aggregate markets, leading to the collapse of the entire market. This paper attempts to test the existence of bubbles in Indian Sectoral Indices. Previous studies have proven that sectoral indices do not mimic the market behaviour and the reaction of the sectors tends to be different compared to the market’s response. In that context, the paper aims to explore the existence of bubbles sector-wise rather than aggregate market-wise. The presence of bubbles is confirmed through the Superior and flawless method called the GSADF test is more flexible and reliable than RADF (Rolling Augmented Dickey-Fuller) and Supremum Augmented Dickey–Fuller (SADF) methods. Findings reveal that not all sectors experience bubbles at the same time. During the study period, the Automobile, financial services, Media and Private sector banking sectors experienced bubbles. Detected bubbles were also found at different times in these sectors. The study helps investors who focus investments in a specific sector to capitalise on price movements once they can time-stamp the occurrence of bubbles. The study provides essential input for investors in taking timely investment decisions. Further results of our study could enable policymakers to instil corrective actions to put the markets back on track when the index falsely deviates from intrinsic values.
Keywords:
1. Introduction
The efficient market hypothesis advocates that market fully absorbs information, and they do not deviate much from the fundamental values. But this hypothesis is empirically and practically proven that this does not hold true as markets are characterised by high volatility and deviations from fundamental values. This is evident from the global financial meltdown of 2008 caused by the sub-prime market crisis in the US stock markets. Ever since the tulip mania crisis was observed in the Netherlands’ sixteenth century, volatility in financial markets has become a common phenomenon. These factual developments and many supporting empirical studies state that the assumptions of the efficient market hypothesis are unrealistic. Since investors can earn profits by capitalising on the market price movements, assumptions of EMH seem impractical. As the efficient market hypothesis does not hold practically relevant, the investors can make profits based on their information. In reality, investors make decisions based on rational logic and behavioural tendencies. When the stock price movements are not backed by solid fundamentals and are driven by emotional tendencies, they shall deviate from the intrinsic values, which are said to cause Bubbles in the market. Investors need to caution out their actions during the Bubble stage. A bubble burst can cause enormous financial loss to investors since past studies have well proven that the markets tend to collapse when bubbles burst. It is also possible that investors can use the Bubbles to make profits since they can go long when they understand that stocks are undervalued and go short before bubbles Burst. The study attempts to diagnose the existence of Bubbles in Indian Sectoral Indices.
We have divided the article into three different sections. Section 2 deals with a review of the literature, highlighting the empirical results and their contribution to this area. Section 3 describes the data, tools used, and research methodology used. Section 4 provides discussions and results based on the analysis. Section 5 Provides conclusions to the paper.
2. Review of literature
In a study, it was found that investors’ decision is primarily driven by both economic variables and behavioural variables (Lux, Citation1995). Superfluous information and emotional issues play a crucial role in investment decision-making (Banerjee, Citation2011). Since both economic and behavioural aspects of market influences, the investors’ decisions tend to deviate from the fundamental and reference values, which causes bubbles. The urge to blindly follow the decisions of investment gurus and reference traders increases the likelihood of market bubbles. This evidence is found in the empirical studies by (Shiller, Citation1981; LeRoy & Porter, Citation1981; Lux, Citation1995; Garber, Citation2000; Shiller, Citation2000; Hirshleifer & Teoh, Citation2003; Lux, Citation1995).
Further, Didier Sornette (Citation2015) argued that it is the absence of fundamental value which can hold back the price results in market bubbles. These deviations from the fundamental value are because investors follow the herd and get disconnected from the fundamental value in specific, dangerous ways. Bubbles create artificial demand for the assets and lead to inflated prices, which will eventually burst and may result in erosion of investments. This collapse affects not only investors but also the other segments of the economy, as stock markets are considered the crucial economic player in the nation. The Global financial crisis has clearly shown that a bubble burst can cause the collapse of the entire financial market. Due to the distress effects that bubbles can have on the stock markets, studies have stressed the importance of understanding the time of occurrence of bubbles (Santos, Citation2020). Hence, detecting bubbles in the stock markets is of paramount importance. Many studies have attempted to investigate the presence of bubbles in the global stock markets. Few studies conclude that there exist bubbles in the stock markets (Wu, Citation2008; Caraiani & Cǎlin, Citation2020), whereas some studies deny the existence of these speculative bubbles (Ahmad, Citation2016; Martin & Ventura, Citation2018) and hence results are inconclusive.
Further, a few studies have been conducted targeting emerging markets like India, China, Pakistan, Sri Lanka, Japan, etc., and found herd behaviour in stock markets (E. C. Chang et al., Citation2000; Chong, Citation2017; Tan et al., Citation2008), which can lead to the occurrence of bubbles. However, on the other hand, studies reveal mixed results in emerging markets. These mixed results could also be due to different methodologies adopted to detect bubbles. Liaqat (Citation2019) applied the GSADF method and confirmed the existence of multiple bubbles in the aggregate market index KSE- 100 but found no bubbles in the chemicals, investment, and textile spinning sectors. Bubbles in a few sectors can lead to bubbles in the overall market index. Hence, investors need to track the performance of sectors along with the aggregate market index. Zhang (Citation2020) employed the SADF method to investigate the impact of bubbles in the Chinese defence sector and concluded that bubbles in one sector could significantly influence the overall market index.
Chang and Gupta (Citation2014) determined the existence of bubbles in BRICS stock markets and confirmed the bubbles in specific periods. Previous studies also point out that GSADF is efficient in detecting bubbles even when SADF rejects the existence of bubbles. This was evident from the study by Arshanapalli and Nelson (Citation2016; T. Chang et al., Citation2016). These studies produced different results since studies were undertaken at different points with varying reference indices. For instance, Kirkpinar et al. (Citation2019) used SADF and GSADF tests for bubble detection from 1990 to 2015 and rejected the existence of bubbles. In contrast, Korkmaz (Citation2016) applied the same SADF and GSADF tests for the data period between 2002–2016 and found that there are bubbles in the Turkish stock market. These results clearly show that studies on bubble detection must be undertaken at regular intervals as the stock markets are dynamic, and the reference values or fundamental values tend to differ at different points.
Literature on sectoral returns reveals that those sectors experience bubbles at different periods. Further, Bubbles in sectoral indices need not last long, unlike markets. The study of sectoral bubbles is crucial since investors tend to hold concentrated portfolios and focus on a particular sector. Furthermore, today Investors want to invest in growth-driven sectors, and they design their portfolios corresponding to their risk appetite by parking their funds in appropriate sectors. Past studies have stressed that investors specialise in specific sectors and invest accordingly.
Similarly, George Milunovich (Citation2019) also suggests that investment strategies must be designed according to sector-wise bubble signals. It is also evident from the study by Narayan (Citation2013) that individual stock bubbles could lead to sectoral bubbles and thereby result in market bubbles. For instance, bubbles in the technology and financial sectors, which are named dot com bubble and housing finance bubble, become central points for the cause of the recent collapse of entire financial markets. Hence, strong empirical evidence confirms that a bubble in any single sector could cause bubbles in the whole market. It is well grounded in the most recent evidence on the sectoral indices (Ying Zhang, Citation2020) that defence sector indices drove bubbles in Chinese stock markets between 2006 and 2014. Despite this interest, no one has focussed on detecting bubbles in sectoral markets to the best of our knowledge. This motivates the researchers to carry out a separate study to identify the existence of bubbles in the sectoral markets of NSE. With this idea, we aim to detect whether bubbles exist in the Indian market and to examine how these bubbles in sectors can influence the market index.
Since emerging markets exhibit high volatility (Abuzayed et al., Citation2018), identifying bubbles in emerging markets like India is critical. Notably, the Indian markets in 2020 were primarily characterised by uncertainty and challenging times due to the pandemic and lockdown restrictions. Even before this pandemic, the stock markets were experiencing setbacks due to financial turmoil and slow economic growth due to the NBFC liquidity Crisis. Nevertheless, the markets touched an all-time high. This could be an indication of the existence of market bubbles. We can also sense it from considerable additions in the number of dematerialisation accounts in 2020. First-time investors look to make quick bucks and grab the opportunity to earn short-term gains and add additional income to their existing sources. When inexperienced retail investors dominate markets, they tend to follow the herd and make decisions in a panic mood, which can cause bubbles in stock markets. (Terence Tai-Leung Chong, Xiaojin Liu & Chenqi Zhu (Citation2017). Though such bubbles result from irrational herd behaviour, rational speculators understand that such bubbles will burst and would like to take advantage of them as they generate high returns (Abreu, Citation2003; Wurgler & Zhuravskaya, Citation2002). Thus, the study attempts to contribute to the literature through two unique approaches. One, the paper aims to examine the existence of bubbles in the Indian sectoral indices index. Second, it also seeks to time-stamp the occurrence of bubbles during the study period.
3. Methodology
India stands in the fifth position in terms of Nominal GDP (Gross Domestic Market) and the third position in terms of PPP (Purchasing Power Parity). It indicates that among the countries of the globe, the economy of India is one of the world’s most rapidly growing economies. Stock Market Performance is an essential barometer for the economic performance of any nation. Interestingly Emerging markets like India are characterised by high volatility, and markets are dominated mainly by behaviour tendencies, as proven by E. C. Chang et al. (Citation2000), Tan et al. (Citation2008), and Chong (Citation2017), which can lead to the occurrence of bubbles. Despite attempts by previous researchers to detect bubbles in markets, our study is motivated by three factors. Previous researchers mostly limited their studies to Developed markets in the West. We want to examine whether there exist bubbles in Indian markets. Further, We deviate from the previous researchers in focusing on sectors rather than aggregate market Index. Lastly, the study aims to time-stamp the occurrence of bubbles in Indian Sectoral Markets to enable investors to make timely investment decisions.
The crucial aspect of bubble detection lies in the tool employed for the detection. Various methods can be used to detect the existence of bubbles. One of the early attempts to test the bubbles can be traced to 1988 by Diba and Grossman (Citation1988), who employed Johansen’s cointegration test. Many other researchers (Arshanapalli, Citation2008; Costa et al., Citation2017) applied the Johansen cointegration test to detect bubbles in asset prices, which are designed to spot linear relationships among variables. However, the literature reveals that financial time series do not exhibit linear relationships (Abhyankar, Citation2011; Hsieh, Citation1991). Furthermore, the same is evident in the study by McCarthy (Citation2004), which failed to detect the housing bubble in the US economy using Johansens cointegration; Phillips et al., Citation2015) addressed methodological flaws in Co integration test by suggesting new methods. As a result, many other researchers have applied advanced techniques, namely RADF (Rolling Augmented Dickey-Fuller) and SADF (Supremum Augmented Dickey-Fuller), which can facilitate the detection of bubbles even in nonlinear relationships in the time series (Liu, Citation2016; Caspi et al., Citation2017; Elike, Citation2017; Jadevicius & van Gool, Citation2020; El Montasser et al., Citation2018; Rasekhi, Citation2017; Ying Zhang, Citation2020). The SADF statistics is defined as:
RADF test can detect single bubbles over the window period; however, it fails to detect multiple bubbles. Hence researchers of late have started employing other advanced techniques. Therefore, it is essential to apply the most efficient method to detect the existence of bubbles in sectoral indices, which are characterised by high volatility and possible frequent explosive behaviour. Although SADF would be able to detect bubbles, the window size is rigid since the starting point of the window for recursive bubbles remains constant. Hence, we have employed generalised sup Augmented Dickey-Fuller (GSADF) test where the starting window is allowed to move over the sample period, adding more flexibility (Caspi et al., Citation2017). This method is an extension of the SADF test, which was proposed by (Phillips et al., Citation2015). It relies on recursive right-tailed ADF tests but uses flexible window widths in its implementation. Instead of fixing the starting point of the recursion on the first observation, the GSADF test extends the sample coverage by changing both the start point and the endpoint of the recursion over a feasible range of flexible windows.
Further, El Montasser et al. (Citation2018) found that GSADF test results are more robust even when the window width differs from the SADF test. This superiority of the GSADF method is evident from various studies which have attempted to detect bubbles in asset prices (Jiang, Citation2015; Sharma, Citation2018; Zhang, Citation2018; Su, Citation2020; and Khalid; Khan et al., Citation2021). Rolling ADF (RADF) test is a rolling version of the first test in which the ADF statistic is calculated over a rolling window of the fixed size specified by the user, i.e., rw = r0 for all estimations. At each step of the RADF procedure, the window’s start, and end points (r1 and r2, respectively) are incremented by one observation at a time. The GSADF statistics is defined as:
where,
and
.
4. Results and discussion
The dividend yield data for this study were collected from January 2005 to June 2019. The descriptive statistics on the dividend yield for NSE sectoral indices are presented in Table . The number of observations for the chosen sectoral indices is not equal due to the differences in the date of commencement of these indices. The NSE Metal index recorded the highest median dividend yield and standard deviation. The lowest median dividend yield was recorded in NSE private sector bank index, and the lowest standard deviation was recorded for the NSE pharma sector. Out of 11 sectoral indices chosen, dividend yields for five sectoral indices were found to be normally distributed as per the Jarque-Bera test statistic.
Table 1. Descriptive statistics
The test statistics were estimated in the EViews-9 software package using the RADF add-in. Phillips et al. (Citation2015) suggested that the bubble detection methodology was applied to the dividend yield data for the sectoral indices from the National stock exchange. The number of observations is not uniform as these sectoral stock indices were introduced at different times. We did not attempt to equate the number of observations for all sectoral indices, as this might lead to the omission of a potential bubble.
Table presents the estimated test statistics for Rolling ADF, Supremum ADF, and Generalised Supremum ADF and their respective probability values. The test statistics were estimated with a null hypothesis of No bubbles. The probability values would help us in rejecting or not rejecting the null hypothesis. If the probability value is less than 0.05 (5% significance level) for a sector, the null hypothesis is rejected, and the presence of a bubble is confirmed. Though three test statistics were estimated to confirm the presence of bubbles, the calculation of the number of bubbles was done only based on the GSADF test results. This is due to the superiority of the GSADF test (Jiang, Citation2015; Sharma, 2018; Zhang, 2018; Su, Citation2020). Once the presence of a bubble for a sector is confirmed by the GSADF test statistic, determining the number of bubbles was done by observing the GSADF test statistic graph (Figure ) along with a 95% confidence level. If the estimated GSADF test statistic sequence line crosses the 95% critical value sequence and goes above, this indicates a bubble’s commencement. The end of a bubble is indicated by the return of the GSADF test statistic sequence line below the 95% critical value. By counting the number of times, the test statistic went above the 95% critical value and returned below the same; we could determine the number of bubbles during the study period. Table also presents information on the detected bubbles’ timing and count. Out of 11 sectoral indices tested for bubbles, only two were found to have two bubbles each (NSE Auto and NSE Financial services) and two sectoral indices with one bubble each (NSE Media and NSE Private Bank). No bubbles were detected on other sectoral indices.
Figure 1. GSADF Test Statistic
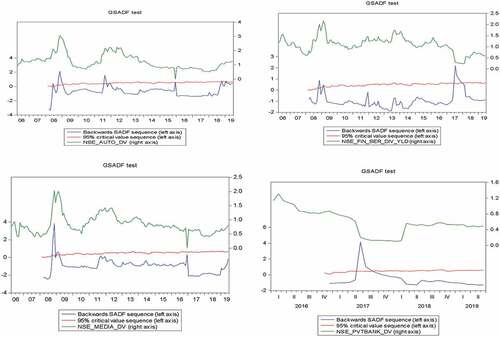
Table 2. Results of test statistics and probability values in parentheses
The bubble found in NSE Auto during Quarter 4 of 2008 was also detected in NSE financial services and NSE Media indices. This phenomenon indicates that this bubble of 2008 was not isolated to one sector. The bubble of 2008 Quarter 4 was also found in three sectors in total. Apart from the 2008 bubble, two other bubbles were detected, i.e., the first in 2011 Quarter 4 and the second in 2107 from Quarter 2 to Quarter 4. The bubble of 2011 Quarter 4 was detected in the NSE Auto index, and the bubble of 2017 Quarter 2 to Quarter 4 was detected simultaneously in two indices (NSE Financial Services and NSE Private Banks). The stock market bubble of 2008 can be attributed to the 2008–09 global financial crisis.
The GSDAF test graphs with statistically significant bubble detections are presented in figures to 4. The figures depict the Backward SADF test statistics and 95% critical value on the left axis and the actual dividend yields of the respective sectoral index on the right axis. A bubble is detected each time the Backward SADF test value exceeds the 95% critical values line. Overall, we can conclude that the bubbles in Indian markets are sector-specific. These results conform with the findings of the study by Ganapathi (Citation2019). This indicates that the aggregate market does not reflect the existence of bubbles. The bubbles tend to get formed in a particular sector and transmit from the specific sector to the overall market due to their magnitude.
Any market goes through ups and downs over a while. The emergence of bubbles can create short-run demand for stocks which will shoot up the stock prices or index (Banerjee,Citation2021). When investors realise that fundamentals do not back the prices, the prices collapse. Forecasting the timing of bubbles and understanding the events that can fuel a bubble in specific sectors could help investors to understand the market sentiments. The results show that four sectors have experienced bubbles in different periods. Out of four sectors that have experienced bubbles, three sectors, namely financial services, auto, and private banks, have had a common period (2008 Quarter 4) during which bubbles were noted. This common period is a witness to the US subprime crisis, which impacted the global financial meltdown and these sectors were no exception. However, the period the bubbles have lasted varies in different sectors. As seen in Figure , the 2008 bubble in the auto sector has lasted longer than in other sectors. In Nifty Media and Private sector banks, the bubbles have collapsed within no time, and the market seems to have made its correction swiftly.
Furthermore, it is clear that not all sectors are affected by the subprime crisis. This confirms that Indian sectoral indices are insulated and remain unaffected by external shocks. As can be seen in the results, the Nifty financial service Sector was deeply impacted by the bubble in 2017 and was long-lasting compared to the 2008 bubbles. The probable reason for the same could be the lagged impact of demonetisation coupled with major taxation reforms during that year. GSADF test reveals that there is evidence of multiple bubbles in the auto sector. GSADF seldom gives false alarms, is efficient in sending warning signals to investors, and is considered superior in detecting multiple bubbles (Chang, T et al., Citation2016). Two bubbles can be observed in Figure during the last quarter of 2008 and 2011. The results also reveal that the auto sector witnessed a bubble in 2011, although it was short-lived. This bubble almost collapsed in the same month, suggesting that the cause of the bubble is trivial and insignificant. We detected a bubble in Nifty media only during 2008 and not subsequently, implying that the media index is stable and is backed by solid fundamentals.
Many private banking stocks outperformed the benchmark index, while public sector banks struggled with inherent asset quality issues. Private banks could keep a tight leash on impaired assets, positively impacting the sector. This is evident from the bubble in the year 2017. However, bubbles indicate the crisis and subsequent collapse (Kirkpinar et al., Citation2019), apparent from the bubble burst during the last quarter of 2017. Detection of bubbles enables investors to plan their investment decisions to capitalise on the market movements. However, the study has not detected any bubbles during the period under investigation in any other sectors of the National stock exchange, implying that bubbles are sector-specific. Bubbles occur when sectoral indices significantly exceed the underlying fundamental value (Gupta and Sharma, Citation2021). Bubbles go through different stages during their lifecycles, such as displacement, boom, euphoria, profit-taking, and panic (,). Detection of bubbles in a sector would enable investors to track the stage of the bubble and make timely decisions. These findings align with Yanık and Aytürk (Citation2011) and Bozoklu and Zeren (Citation2014). It is also to be noted that bubbles in different sectors go through different stages at various times since the data represents a lack of a common period and pattern of bubbles. Hence there is a need to diagnose and detect bubbles sectors-wise to enable better decision-making. Further, our study helps to locate the bubbles. It facilitates investors to earn profits by enabling them to detect bubbles at early phases and help them formulate exit strategies to sell off their stock before the sell-off phase begins.
5. Conclusion
The study indicates not all sectors deviate from fundamental Indices. Though bubbles are seen in a few sectors, by and large, we can conclude that Indian sectoral markets are being traded at fair prices, and the index corrects itself in the long run. This implies that investors holding stocks in these sectors must focus more on sector indices than the aggregate index. This finding agrees with the previous study by Ying Zhang (Citation2020). The study contributes to the domain in its attempt to investigate the existence of bubbles sector-wise and concludes that the bubbles are sector-specific and not generic.
Our study detected bubbles in the auto, financial services, media, and private sector banking sectors out of 11 sectors. Detected bubbles were also found at different times across these sectors. Hence, we can conclude that bubbles in the Indian stock markets are sector-specific, and these bubbles go through different phases at different times. This indicates that not all sectors experience bubbles at the same period, which is in line with the results of the previous studies. The study provides insights for investors focussing on sector-wise investments to be cautious of their investments since bubbles go through phases and are prone to collapse over a period. The study can be an eye-opener for investors looking to strategise their decisions and aid them in appropriately timing their decisions. The study also provides insights for policymakers to call on corrective actions to bring stability to the markets and attract capital into markets.
Declaration
We want to declare that the authors had no discord in their interests and opinions during the research process and validation of the manuscript. In addition, the named authors have read and approved the manuscript for submission with proper ethical guidelines. We confirm that the manuscript is original and has not been published or considered for publication elsewhere
Authors’ contributions
Conceptualization: G.S., N.K.R.
Data curation: NKR.
Formal analysis: NN.
Disclosure statement
No potential conflict of interest was reported by the author(s).
Additional information
Funding
Notes on contributors

Suresh G
Suresh G holds a Ph.D. in Finance from Madurai Kamaraj University, India. He has 15 years of experience in academics and research and is currently a Professor at Christ University, Bangalore. He has publications in periodicals and several peer-reviewed journals indexed in Scopus and ABDC. He has authored various books in the area of Finance. He is also a reviewer for various Scopus, and ABDC indexed Journals. His research interests include Agricultural economics, Risk management, Capital Market, Corporate Finance, and Behavioral Finance. He is passionate about spreading research across faculty groups and students alike.
Naveen Kumara R
Naveen Kumara R began his journey in teaching out of his passion and today it has become his profession. Besides Teaching, He is specialized in the area of Accounting and Finance. During his academic career he has authored several Research Articles in reputed peer reviewed journals. His recent research article titled “parental perception of the Effectiveness of Online Classes for Primary School Children” was published in International Journal of Virtual and Personal Learning Environment. He has 11+ years of Teaching Experience teaching both Undergraduate and Post Graduate Courses. At present He is currently working as Assistant Professor in School of Commerce, Finance and Accountancy, Department of Commerce, Christ University. Naveen Kumar Holds a PhD in Finance from Periyar University. He also holds his master’s Degrees in Finance from Christ University. Besides Teaching his area of Interest lies in practising Direct and Indirect Taxes and has been helping Business segment in Tax compliances
Natchimuthu Natchimuthu
Natchimuthu Natchimuthu Comes with 15+ years of experience in Teaching and Research. Currently he is working as Assistant professor at Department of Commerce, CHRIST University. Dr Natchimuthu has a PhD from Bharathiar University, India, His research interest lies in the field of Financial Econometrics and particularly in the area of Volatility estimation and Machine Learning. His has published research papers in Scopus indexed and other international Journals. His recent publications include “Volatility spill over among metals”, “Calendar anomalies in Indian stock market” and “Is gold price leveraged in India?”.
References
- Abhyankar, A. C. (2011). Uncovering nonlinear structure in real-time stock-market indexes: The S&P 500, the DAX, the Nikkei 225, and the FTSE-100. Journal of Business and Economic Statistics, (1–14). https://doi.org/10.2307/1392068
- Abreu, D. A, Brunnermeier, M. (2003). Bubbles and crashes. In Econometrica (Vol 71) (pp. 173–12). https://EconPapers.repec.org/RePEc:ecm:emetrp:v:71:y:2003:i:1:p:173-204
- Abuzayed, B., Al-Fayoumi, N., & Arabiyat, T. S. (2018). Does Investors’ Fear Gauge in a Mature Market Matter? Evidence from the MENA Region. The Journal of Wealth Management Apr, 21(1), 71–87. https://doi.org/10.3905/jwm.2018.21.1.071
- Ahmad, A. A. (2016). Current status of research and development in the SAARC region. In Science (Vol 35) (pp. 63–66). https://doi.org/10.3923/std.2016.63.66
- Arshanapalli, B. &. (2008). A cointegration test to verify the housing bubble. The International Journal of Business and Finance Research, 35–43. https://www.theibfr2.com/RePEc/ibf/ijbfre/ijbfr-v2n2-2008/IJBFR-V2N2-2008-3.pdf
- Banerjee, A. (2011). Application of behavioural finance in investment decisions: An overview. The Management Accountant, 46(10), 869–872. https://doi.org/10.33516/maj.v46i10.869-872p
- Banerjee, A., & Kayal, P. (2021), ”Bubble run-ups and sell-offs: A study of Indian stock market”, Review of Behavioral Finance. https://doi.org/10.1108/RBF-06-2020-0122
- Bozoklu, Ş., & Zeren, F. (2014). Türkiye hisse senedi piyasasinda rasyonel köpükler: Sakli eş bütünleşme yaklaşimi. Finansal Araştırmalar ve Çalışmalar Dergisi, 5(9), 17–31. Retrieved from https://dergipark.org.tr/en/pub/marufacd/issue/501/4557
- Caraiani, P. &., & Cǎlin, A. C. (2020). The impact of monetary policy shocks on stock market bubbles International evidence. Finance Research Letters, 34, 101268. https://doi.org/10.1016/j.frl.2019.08.016
- Caspi, I., Setzer, R. W., Strope, C. L., Wambaugh, J. F., & Sipes, N. S. (2017). Rtadf: Testing for bubbles with EViews. Journal of Statistical Software, 79(4), 1–16. https://doi.org/10.18637/jss.v079.i04
- Chang, E. C., Cheng, J. W., & Khorana, A. (2000). An examination of herd behaviour in equity markets: An international perspective. Journal of Banking & Finance, 24(10), 1651–1679. https://doi.org/10.1016/S0378-4266(99)00096-5
- Chang, T., Gil-Alana, L., Aye, G. C., Gupta, R., & Ranjbar, O. (2016). Testing for bubbles in the BRICS stock markets. Journal of Economic Studies, 43(4), 646–660. https://doi.org/10.1108/JES-07-2014-0128
- Chang, & Gupta, R. (2014). “Testing for multiple bubbles in the BRICS stock markets”. Pretoria.: Department of Economics working Q, 7, University of Pretoria.
- Chong, T. T. (2017). What explains herd behaviour in the Chinese stock market? Journal of Behavioral Finance, 18(4), 48–456. https://doi.org/10.1080/15427560.2017.1365365
- Chun, J., Yi, W., Tsangyao, C., & Chi-Wei, S. (2015). Are there bubbles in Chinese RMB–dollar exchange rate? Evidence from generalized sup ADF tests. Applied Economics, 47(56), 6120–6135. https://doi.org/10.1080/00036846.2015.1064080
- Costa, C. T., da Silva, W. V., de Almeida, L. B., & da Veiga, C. P. (2017). Empirical evidence of speculative bubbles in the prices of stocks traded on the São Paulo Stock exchange. Contaduría Y Administración, 62(4), 1317–1334. https://doi.org/10.1016/j.cya.2017.02.007
- Diba, B., & Grossman, H. (1988, September). The theory of rational bubbles in stock prices. The Economic Journal, 98, 746–754. https://doi.org/10.2307/2233912
- El Montasser, G. N., Naoui, K., & Fry, J. (2018). Speculative bubbles or explosive fundamentals in stock prices? New evidence from SADF and GSADF tests. Journal of Statistics and Management Systems, 21(1), 93–106. https://doi.org/10.1080/09720510.2017.1401799
- Gangadharan, G. G., & Suresh, D. N. (2019). Interrogation of a Bubblein the Indian Market. Journal of Management, 6(3), 64–70. https://doi.org/10.34218/JOM.6.3.2019.008
- Garber, P. M. (2000). Famous first bubbles: The fundamentals of early manias. In Famous first bubbles: The fundamentals of early manias (The MIT Press)0-262-07204-1 https://direct.mit.edu/books/book/2531/Famous-First-BubblesThe-Fundamentals-of-Early https://doi.org/10.7551/mitpress/2958.001.0001.
- George, M., Shuping, S., & David, T. (2019). Bubble detection and sector trading in real-time. Quantitative Finance, 19(2), 247–263. https://doi.org/10.1080/14697688.2018.1459811
- GUPTA, T., & SHARMA, A. (2021). India’s Stock Market Bubble 2021: Signs and Causes. IUP Journal of Financial Risk Management, [S. L.], 18(2), 7–17. Disponível em Acesso em
- Hirshleifer, D. &., & Teoh, S. H. (2003). Limited attention, information disclosure, and financial reporting. Journal of Accounting and Economics, 36(1–3), 337–386. https://doi.org/10.1016/j.jacceco.2003.10.002
- Hsieh, D. A. (1991). Chaos and nonlinear dynamics: Application to financial markets. The Journal of Finance, 46(5), 1839–1877. https://doi.org/10.1111/j.1540-6261.1991.tb04646.x
- Jadevicius, A. &., & van Gool, P. (2020). Assessing Dutch housing cycle and near-term market prospects. Journal of European Real Estate Research, 13(2), 257–270. https://doi.org/10.1108/JERER-07-2019-0020
- Khan, K., Chi-Wei, S., & Rehman, A. U. (2021). Do multiple bubbles exist in coal price? Resources Policy, 73, 102232. https://doi.org/10.1016/j.resourpol.2021.102232
- Kirkpinar, A., Erer, E., & Erer, D. (2019). Is there a rational bubble in the best 100 and sector indices? Financial Studies, 23(85), 21–33. https://hdl.handle.net/10419/231682
- KORKMAZ, O., ERER, D., & ERER, E. (2016). Do the Bubbles in Alternative Financial Instruments Affect the Turkish Stock Market? An Application to BIST100. Journal of BRSA Banking and Financial Markets, Banking Regulation and Supervision Agency, 10(2), 29–61. https://ideas.repec.org/a/bdd/journl/v10y2016i2p29-61.html
- LeRoy, S. F., & Porter, R. D. (1981). The present-value relation: Tests based on implied variance bounds. Journal of the Econometric Society, 49(3), 555–574. https://doi.org/10.2307/1911512
- Liaqat, A., Nazir, M. S., & Ahmad, I. (2019). Identification of multiple stock bubbles in an emerging market: Application of GSADF approach. Economic Change and Restructuring, 52(3), 301–326. https://doi.org/10.1007/s10644-018-9230-0
- Lux, T. (1995). Herd behaviour, bubbles and crashes. The Economic Journal, 105(431), 881–896. https://doi.org/10.2307/2235156
- Martin, A. A., & Ventura, J. (2018). The macroeconomics of rational bubbles: A user’s guide. Annual Review of Economics, 10(1), 505–539. https://doi.org/10.1146/annurev-economics-080217-053534
- McCarthy, J. (2004). Are home prices the next bubble?. Economic policy review, 10(3), 1–17. https://www.newyorkfed.org/research/epr/04v10n3/0412mcca.html
- Narayan, P. K., Mishra, S., Sharma, S., & Liu, R. (2013). Determinants of stock price bubbles. Economic modelling, 35, 661–667. https://doi.org/10.1016/j.econmod.2013.08.010
- Phillips, P. S., Shi, S., & Yu, J. (2015). Testing for multiple bubbles: Limit theory of real-time detectors. International Economic Review, 56(4), 1043–1078. https://doi.org/10.1111/iere.12132
- Phillips, P. C.B, & Yu, J. (2011). Dating the timeline of financial bubbles during the subprime crisis. Quantitative economics, 2, 455–491. https://doi.org/10.3982/QE82
- Rasekhi, S. E. Z. (2017). Testing for multiple bubbles in Iranian foreign exchange market: The application of RTADF unit root tests. Journal of Economic Modelling Research, 7(27), 7–39. https://jemr.khu.ac.ir/article-1-1118-en.html
- Santos, D. V. (2020). Bubble detection and contagion: an analysis by segments of the US Stock, real estate, and credit markets. In Master in Economics Dissertation, Universidade Do Porto. https://hdl.handle.net/10216/129188
- Sharma, S., & Escobari, D. “Identifying Price Bubble Periods in the Energy Sector.” Energy Economics 69 (January 1, 2018). 418–429. https://doi.org/10.1016/j.eneco.2017.12.007
- Shiller, R. J. (1981). Alternative tests of rational expectations models: The case of the term structure. Journal of Econometrics. Journal of Econometrics, 16(1), 71–87. https://doi.org/10.1016/0304-4076(81)90076-2
- Shiller, R. J. (2000). Measuring bubble expectations and investor confidence. The Journal of Psychology and Financial Markets, 1(1), 49–60. https://doi.org/10.1207/S15327760JPFM0101_05
- Sornette, D., & Cauwels, P. (2015). Financial Bubbles: Mechanisms and Diagnostics”. Review of Behavioral Economics, 2(3), 279–305. https://dx.doi.org/10.1561/105.00000035
- Sun, O., & Liu, Z. (2016). Comparison of Monetary Policy Actions and Central Bank Communication on Tackling Asset Price Bubbles—Evidence from China’s Stock Market. Plos One, 11(11), e0166526. https://doi.org/10.1371/journal.pone.0166526
- Su, C. W., Wang, X. Q., Zhu, H., Tao, R., Moldovan, N. C., & Lobonţ, O. R. (2020). Testing for multiple bubbles in the copper price: Periodically collapsing behaviour. Resources Policy, 65, 101587. https://doi.org/10.1016/j.resourpol.2020.101587
- Tai-Leung Chong, T., Liu, X., & Zhu, C. (2017). What Explains Herd Behavior in the Chinese Stock Market?. Journal of Behavioral Finance, 18(4), 448–456. https://doi.org/10.1080/15427560.2017.1365365
- Tan, L. C., Chiang, T. C., Mason, J. R., & Nelling, E. (2008). Herding behaviour in Chinese stock markets: An examination of A and B shares. l, 16 (1-2). Pacific–Basin Finance Journal, 16(1–2), 61–77. https://doi.org/10.1016/j.pacfin.2007.04.004
- Uchenna, E. & Emmanuel, A. (2017). Testing for explosive bubbles in the South African-US exchange rate using the sequential ADF procedures. Banks and Bank Systems, 12(1–1), 105–112. https://doi.org/10.21511/bbs.12(1-1).2017.02
- Wu, G. (2008). Are there speculative bubbles in stock markets? Evidence from an alternative approach. Statistics and Its Interface, 1(2), 307–320. https://doi.org/10.4310/SII.2008.v1.n2.a8
- Wurgler, J. A., & Zhuravskaya, E. (2002). Does arbitrage flatten demand curves for stocks? Journal of Business, 75(4), 583–608. https://doi.org/10.1086/341636
- Yanık, S. & Aytürk, Y. (2011). Rational Speculative Bubbles in Istanbul Stock Exchange. Muhasebe ve Finansman Dergisi, 51, 175–190. https://dergipark.org.tr/en/pub/mufad/issue/35630/396067
- Zhang, Y., Jiaxin, X., & Zhai, L. (2020). Are there Bubbles in the Defence Sector of China’s Stock Market (2005–2016)? New Evidence from Sequential ADF Tests. Defence and Peace Economics, 31(1), 105–119. https://doi.org/10.1080/10242694.2018.1428857
- Zhang, W., Shi, & Liu. (2018). Is hub-based pricing a better choice than oil indexation for natural gas? Evidence from a multiple bubble test. Energy Economics, 76, 495–503. https://doi.org/10.1016/j.eneco.2018.11.001