
 ?Mathematical formulae have been encoded as MathML and are displayed in this HTML version using MathJax in order to improve their display. Uncheck the box to turn MathJax off. This feature requires Javascript. Click on a formula to zoom.
Abstract
The main goal of this study is to examine financial inclusion and related factors in rural South Wollo Zone areas. The binary logit model, primary and secondary data, and multi-stage sampling techniques were all applied in the study. Only 20.72 percent of those questioned in the rural South Wollo zone were given access to formal financial institutions, leaving 79.28 percent of those who were excluded. According to the report, access to traditional financial institutions is influenced favorably by factors such as affordability, financial literacy, age, and secondary education in rural areas, as well as the availability of Islamic banking services. Both the inability of rural inhabitants to access formal financial institutions and their lack of trust in traditional financial institutions represent significant obstacles. The study also looks into the expensive replacement of formal financial institutions in rural areas by traditional financial groups. Based on our research, we recommend that the government and other relevant organizations seek to improve the country’s degree of financial inclusion in rural areas by offering formal financial services at a reasonable cost and by boosting the financial capacity of rural low-income groups.
PUBLIC INTEREST STATEMENT
For emerging nations to lower their levels of poverty and to promote inclusive economic growth, financial inclusion is crucial. As a result, the primary factors influencing financial inclusion in Ethiopia’s rural South Wollo zone are the focus of this study. The study indicated that key factors of financial inclusion in rural areas included age, cost, financial competence, education, and Islamic banking services.
1. Introduction
The process of ensuring that everyone in an economy can easily access, have access to, and use the official financial system is known as financial inclusion (Sarma, Citation2008). Financial inclusion is a crucial tool for inclusive growth and the reduction of poverty (Simatele & Maciko, Citation2022). In the modern economy, the availability of formal financial services has a significant impact on a person’s social and economic standing, as well as the development of their organization or country (Anand & Kuldip, Citation2013). By encouraging secure saving habits, an inclusive financial system lowers the emergence of exploitative informal sources of credit while increasing efficiency and welfare (Sarmaand Pise, Citation2011).
Access to financial services, such as credit, enhances access to farming equipment and boosts agricultural output in rural areas (Abraham, Citation2018). Rural poor communities can insulate themselves from shocks to their income by having access to credit and other financial services, which can also improve the effectiveness and accessibility of remittances (Simatele & Maciko, Citation2022). However, the expansion of financial inclusion and accessibility is quite slow in sub-Saharan African nations. Large rural communities in Ethiopia lack access to financial services. Only about 30.5% of Ethiopians, according to the World Bank; NBE and CSA (Citation2020), had a bank account, while the other 69.5% were excluded from financial services. Of them, Ethiopia’s rural areas were home to 81.4% of the excluded adults. Ethiopia’s financial sector development, as measured by expanding access to financial technologies and establishing financial institutions nationwide, is extremely limited and largely centered in the nation’s urban centers (Desalegn & Yemataw, Citation2017).
By using various types of data and analytical techniques, several studies have evaluated the elements that influence financial inclusion in various nations. Gender, age, employment level, and possession of a mobile phone all have significant and advantageous influences on financial inclusion, according to a study by Wuddasie (Citation2022). However, there are many obstacles to financial inclusion, including a lack of documentation, a lack of trust, and a lack of resources. According to research by Abdu and Adem (Citation2021), financial literacy, age, and mobile banking all have a beneficial impact on financial inclusion. When Workineh Ayenew Mossie (Citation2022) examined the factors affecting financial inclusion in Ethiopia, she discovered that age, sex, income, and education all had an impact. Simatele and Maciko (Citation2022) investigated the factors that influence financial inclusion in South Africa’s rural areas and discovered that unemployment, low and erratic incomes, financial illiteracy, risk and trust views, and a lack of work all play significant roles.
However, the majority of current research focuses on the factors that affect financial inclusion using data at the national level, which includes both urban and rural areas. Since financial services are concentrated in metropolitan areas, most of the data was gathered there. There is a significant difference between developing financial inclusion in rural and urban communities within a rural-urban economic system. Most rural residents lack access to financial services on par with metropolitan residents. Between urban and rural communities, there are enduring and expanding infrastructural quality discrepancies.
Without the expansion of financial inclusion in rural areas, where a sizable portion of the population resides, it is difficult for an economy to grow more quickly. Understanding the key factors and constraints to financial inclusion in rural areas is crucial for ensuring its progress. The foundation for developing comprehensive policies that will have a trickle-down impact on the government and financial institutions based on rural status is the identification of the factors that influence and the barriers to financial inclusion in rural areas. However, the studies that have already been done omitted the most crucial information, so further research must unavoidably be done in rural areas of the nation. As a result, by examining the factors that influence and the obstacles to financial inclusion in rural areas of the nation, this study adds to the body of literature, provides fresh information about how these areas use financial services, and identifies key areas where the government should intervene.
Therefore, the primary goal of this study is to use official financial inclusion measures to assess and investigate the key factors influencing financial inclusion and its barriers in rural Ethiopia.
The remainder of the study is organized as follows: The review of related literature is presented in Section 2; the study methodology is presented in Section 3, where the research framework and data collection techniques are reviewed; and the research findings and results are presented in Section 4ʹs result and discussion. The study is concluded in Section 5 by stressing its primary contribution to the subject of finance, as well as its practical implications.
2. Related literature review
In this section of the study, we reviewed many works on financial inclusion and its factors from various angles.
2.1. Financial inclusion in Ethiopia
Banks, which are concentrated in metropolitan regions and only have limited access points and non-cash payment options there, dominate the financial industry in Ethiopia. There aren’t many banking options in rural and distant places, and inadequate connectivity still prevents the use of digital alternatives. In Ethiopia, there are 8,800 POS terminals and more than 2,700 active ATMs that are held by both state-owned and private banks. Together, the 19 banks had over 5,500 branches in 2017. Only 3% of Ethiopians reside in Addis Abeba, but there are 33% of bank branches and 50% of ATMs there. The country’s POS network is substantially smaller than those of its neighbors (World Bank; NBE and CSA, Citation2020).
Approximately 30.4 percent of adult Ethiopians had an account at a formal financial institution in 2018–19, up from 21.8 percent in 2015–16, according to the World Bank; NBE and CSA (Citation2020) report. The percentage of households with financial inclusion, defined as having at least one adult with an account, is 45.9%. The gender gap increased from 8.9 to 16.2 percentage points, despite the fact that female account ownership increased from 17.5 percent in 2015/16 to 22.7 percent in 2018/19. Males, people who live in cities, and those who are wealthier and more educated are more likely to have financial inclusion. The majority of Ethiopians (around 59%) reside more than 5 kilometers from the closest financial institution.
2.2. Determinants of financial inclusion
Here below we are discussing the major determinants of financial inclusion by classifying the factors as demand-side and supply–side factors.
According to Das (Citation2015), inclusive financial development is important for the efficient allocation of productive resources and access to appropriate financial services can significantly improve the day-to-day management of finances. An all-inclusive financial system can help reduce the growth of informal sources of credit (such as moneylenders) which often tend to be exploitative. Thus, an all-inclusive financial system enhances efficiency and welfare by providing avenues for secure and safe saving practices and by facilitating a whole range of efficient financial services.
The financial exclusion can be either voluntary or involuntary. Voluntarily excluded individuals choose not to use the services because they do not need such services or may be able to access the services through some other means. It can be occurred due to many factors like costs (withdrawal fees, bank charges, interest rates, and travel to service points) and non-monetary barriers like lack of trust in financial institutions and the lack of adequate product knowledge (Karlan et al., Citation2014; Simatele & Maciko, Citation2022).
2.2.1. Supply-side factors for financial inclusion
2.2.1.1. Documentation challenges
Demirguc-Kunt et al. (Citation2018) investigated that insufficient and unclear documentation has affected financial inclusion, especially among young adults in rural areas. In addition, the documentation that banks need to comply with national regulations for onboarding clients by financial services providers can be very tedious, leading to financial exclusion. The study also finds that 20% of adults without an account cited lack of documentation as the main reason. Another study conducted by Abel et al. (Citation2018), in Zimbabwe, found that 49% of adults reported not opening an account due to a lack of required documentation.
2.2.1.2. Religious-oriented financial service
A study by (Evans, Citation2016) on the determinants of financial inclusion, incorporating the Presence of Islamic banking services and activity, has a significant and positive effect on financial inclusion. Counties with Islamic banking and presence and activity have higher financial inclusion relative to those countries with no such service. Moreover, the researcher explained that Islamic banking presence and activity are highly linked to high financial inclusion in Muslim countries and members of the organization for Islamic cooperation. Moreover, (Wudasie, Citation2022); found from her comparative study, for Ethiopia and Kenya, religion does not affect financial inclusions. However, the availability of Sharia-compliant financial products as well as Islamic banking offsets the impact of religion on financial inclusion.
2.2.1.3. Affordability of financial service
A study conducted by Zins and Weill (Citation2016), founds that the poor and those who live in rural areas are more likely to be excluded from financial markets because of costs like account maintenance fees, account minimum balances, processing fees, interest rates, and remittance fees. The result of Demirguc-Kunt et al. (Citation2018) shows that 60% of adults do not have accounts due to associated costs and the study by Simatele and Maciko (Citation2022) founds that transaction costs mainly related to traveling and bank charges present a barrier to usage. Developments in technology, however, can reduce these costs resulting in much lower costs of providing financial services to rural and low-income consumers (Simatele et al., Citation2021).
2.2.1.4. Distance from the financial institutions
Timbula et al. (Citation2019) study financial inclusion and its determinants among households in the Jima zone of Oromia regional state, Ethiopia and he founds that age, education, financial literacy, and income are positively related to financial inclusion, and distance to the nearest provider of financial services negatively impact financial inclusion.
Another study Nkuna et al. (Citation2018), conducted on the determinants of financial inclusion founds households who are near financial services are more likely to be included in the financial services. In rural areas, users must travel long distances to points of service, which is very costly, especially given their low incomes. A study by Simatele and Maciko (Citation2022) founds that distances from service points lead to financial exclusion due to the scarcity of services. Most focus groups indicated that traveling to a bank was very costly. Some communities live as far as 80 km from the nearest service provider. Several participants indicated that they had opened bank accounts but were only using them to receive funds and could not actively use them because of the cost of travel.
2.2.2. Demand-side factors for financial inclusion
2.2.2.1. Demographic factors (age and education level of the respondents)
Individuals with higher levels of financial literacy are more likely to make better decisions about debt and retirement planning (Gallego-Losada et al., Citation2022). A study by Hasan et al. (Citation2021) shows that the effect of financial literacy is more pronounced in rural areas. The results of Simatele and Maciko (Citation2022) also show that financial literacy affected financial inclusion in the rural area of South Africa. Moreover, the study by (Evans, Citation2016) found that literacy has a positive effect on financial inclusion. Especially financial literacy has gradually become more important as financial markets become increasingly complex and the illiterate finds it difficult to make an informed financial decision.
Abdu et al. (Citation2021), conducted a study in Afar regions in Ethiopia and found that the age of a household head has a significant and positive effect on financial inclusion. For a household when age increase by a year the probability of being financially included increases by 1.19 percent. This is because as age increases knowledge about financial service increase and they will be knowledgeable about the different financial services and will start to use the services.
2.2.2.2. Financial capability
A study by Desalegn and Yemataw (Citation2017)in Ethiopia confirms that financial inclusion is higher among financially capable individuals than among those that are not. Using individuals’ savings as a proxy for income; also, significantly determines, financial inclusion. Having financial capability increases the probability of financial inclusion by 12.4 percent relative to those who didn’t have the financial capability. Potocki and Cierpiał-Wolan (Citation2019) find a positive association between financial capability and financial inclusion for rural populations in Poland.
2.2.2.3. Trust
Trust in financial institutions can have a significant effect on financial inclusion in rural areas. A study by Xiaoyan (Citation2020) showed that trust has a positive effect on financial inclusion and lowers the perceived risk of transactions and financial contracts. Low-income earners do not open bank accounts because of a lack of trust in banks. Simatele and Maciko (Citation2022) show that trust affects rural communities to use financial services. Moreover, trust plays a significant role in the adoption and use of digital finance, which is a crucial factor in expanding financial inclusion (Arif et al., Citation2016).
A comparative study by (wuddasie, Citation2022) between Kenya and Ethiopia, finds that a lack of trust in financial institutions significantly reduces financial inclusion in both countries. It is related to low people finding it difficult to entrust their money to financial institutions because they lack full information on their activity and/or are unfamiliar with new financial products.
3. Research methodology
3.1. Research approach
The study examined the factors influencing financial inclusion in the region using both qualitative and quantitative research methods. The qualitative design provides a thorough investigation of the country’s rural areas’ determinants.
3.2. Data type and source, and methods of collection
Both primary and secondary data were used in this investigation. The main information was gathered using structured questionnaires of the closed-ended variety. Pre-testing was done on the questionnaires to ensure their reliability, validity, and clarity. In order to facilitate communication, the questionnaire was initially written in English and then translated into Amharic. In the end, 365 questionnaires were created and sent to the targeted families in rural Kebeles’ South Wollo zone; 362 of those questionnaires were duly filled out and submitted on time during the fiscal year 2022–2023. However, secondary information about the subject was acquired from written materials and public sources, including journals, statistics reports from the federal government, and reports from the administration office for the south Wollo zone.
3.3. Sampling techniques and sample size determination
A multi-stage sampling strategy was used in the investigation. The study used a simple random sampling procedure to choose five kebeles from the total number of targeted kebeles after initially using a purposive sample method to choose the study area (Woreda). The right sample size for each kebele was then determined using a proportional sampling technique as shown in table . In order to establish the necessary sample size for this study with a 95% confidence level and a 5% margin of error, the researcher uses the sample size determination formula developed by Yamane (Citation1967).
Table 1. Sample size distribution between target kebelesFootnote1
The formula is stated as follows:
Where the required sample is size;
is the size of the total population under consideration in the study area;
is the precision level.
3.4. Method of data analysis
Data were coded and entered into a program using Stata version 15.0 software when data collection was complete. Additionally, descriptive and inferential statistical approaches have been used to edit, interpret, and analyze data that has been gathered from various sources. The use of tabulation, percentages, and average numbers were all descriptive techniques. Utilizing ANOVA, t-tests, and correlation coefficients, inferential statistics is used to ascertain the relationship between variables and to make predictions. Last but not least, a logistic regression (Binary Logit) was employed to pinpoint the key factors that influence financial inclusion in rural areas.
3.5. Model specification
This study’s primary objective is to identify or investigate the factors that influence financial inclusion in rural areas of the south Wollo zone. The binary logistic regression model is expressed as follows in light of the model’s covariates, including age, education level, documentation difficulty, affordability of financial services, financial capability, trust in the traditional financial association, connectivity to urban society, trust (attitude toward formal financial institutions), distance from financial institutions, and the error term:
This can be further expressed as follows;
Where z is expressed as:
The likelihood that a person has a bank account, savings, and credit relationship with financial institutions, given the vector of the observable qualities, can be represented as P (Financial Inclusion = 1/X).
The logistic function is given as G (z) as shown in Equationequations 3(3)
(3) and Equation4
(4)
(4) above:
Following this, an estimate of the logistic regression’s marginal effect is made for ease of interpretation. The non-linear regression model’s counterfactual forecast for marginal impacts is (Pedace, Citation2013). The marginal effect can be represented as follows given the logit model:
3.6. Diagnostic tests (pre and post-estimation tests)
3.6.1. The multicollinearity test
Multicollinearity, heteroscedasticity, and omitted variable tests were performed as a pre-estimation step. Variables were evaluated for multicollinearity using tests before the model was run; the VIF test was used for continuous variables, the contingency coefficient test was used for categorical variables, and the Breuscch-Pagan test was used to test for heteroscedasticity.
3.6.2. Hosmer-Lemeshow goodness of fit test
The relationship between a binary outcome variable and one or more predictor (explanatory) variables is described by the (binary) logistic regression model. The binary logistic regression model has undergone a number of tests to determine its validity. The most typical of such is Hosmer-Lemeshow. It is a comparison of the pattern of the observed independent variables with the number of respondents utilizing the cells (Fagerland & Hosmer, Citation2012).
3.6.3. Description of the model variables, its measurement, and expected signs
Table describes the variables, its measurment and expected signs
Table 2. Measurement and description of variables
4. Results and discussion
We summarized the main empirical findings of the study in this section. We covered the descriptive analysis of the dependent and independent variables in the first section. The primary goal of the study was to identify the factors that determine financial inclusion in rural areas of the nation, which were presented using the three widely used financial inclusion indicators in the study’s subsequent section (savings, account, and credit).
4.1. Descriptive statistics
The purpose of the first section of the descriptive study was to describe the level of financial inclusion in the South Wollo zone’s rural areas using data from randomly selected people. With this in mind, the study used random sampling procedures to collect data from 362 respondents to measure the level of financial inclusion in rural areas using the three financial inclusion indicators. In the South Wollo zone’s rural region, 287 (79.28%) of the sampled individuals are not financially included, whereas just 75 (20.72%) are. This finding is shown in Table . This demonstrates how many people in rural areas are shut out of formal financial institutions.
Table 3. Financially included and excluded respondents
The descriptive statistics for the categorical variables are summarized in Table below. According to the results, 82 (22.6%) households have access to religiously oriented financial services, compared to 280 (77.35%) households that do not (Islamic banking services). Regarding education, the majority of those surveyed—45.3%—were illiterate, followed by 44.75% of those who had finished primary school. Only 9.94% of respondents in the sampled survey were in the secondary and above range.
Table 4. Percentage distribution of financial inclusion attributes
Regarding documentation 34 (9.39%) households out of 328 households find it difficult to access financial services. In terms of the cost of financial services, 300 people (82.87%) believe it is not affordable to access financial services, whereas 62 people (17.13%) believe it is.
In terms of financial capability, 230 people (63%) are not capable, while 132 people (37%) are. A total of 305 respondents (or 84%) and 57 respondents (or 16%) in the study said they trusted traditional financial associations, respectively. 244 (67.40%) of the people who responded to the study have access to urban societies and knowledge of financial services. Only 61 people (16.85%) have confidence in formal financial institutions, whereas 301 (83.15%) do not. This contrasts with conventional financial services, where trust is more widely held.
The average and standard deviation of the distance to the formal financial institution, according to the descriptive statistics for continuous variables, were 7.471 km and 8.941 km, respectively. Table outcome showed that the minimum distance of 1 km and the maximum distance of 50 km had a significant difference. The sample survey’s mean age was 42 years old, and its standard deviation was 8.9. The respondents ranged in age from 18 to 75, with 18 being the youngest and 75 being the oldest.
Table 5. Summary statics of continuous variables on the determinants of financial inclusion
4.2. Reasons and sources of rural households to use formal financial institutions
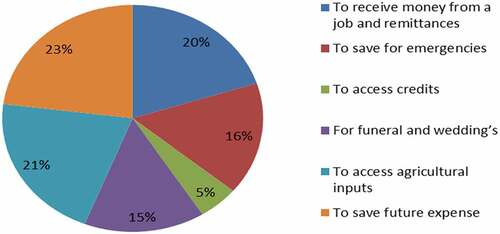
This study has identified numerous factors that have encouraged rural households to employ contemporary financial institutions. As shown in below majority of rural communities, as depicted in the figure below, use financial institutions to save for future expenses before having access to agricultural inputs. Financial services are used by 20% of rural households to receive income through sales, jobs, and remittances. When selling assets, they use banking institutions to protect themselves from counterfeit money. Because financial organizations need collateral to lend money and rural areas don’t meet the requirements, relatively few low-income rural households use financial services for credit.
Figure 1. Reasons rural households motivated to use formal financial institutions.
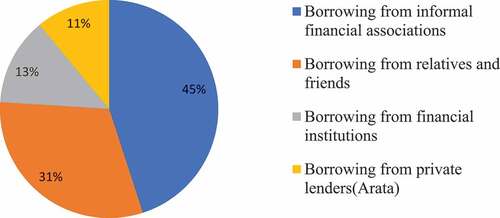
Mostly rural households in the southern Wollo zone have access to loans from various sources. According to the pie chart in , 31% of rural households receive loans from family and friends, followed by 45% from informal financial organizations. 13% of loans are given to rural households through the official financial institution, and the remaining 11% of the rural community obtains loans from local private lenders.
Figure 2. Source of loans in the rural area.
4.3. Econometric analysis
The outcome of the diagnostic test revealed no issues with heteroscedasticity or multicollinearity, and the goodness of fit test revealed the model to be sound. The test result is shown in table .
Table 6. Summary of diagnostic tests
4.4. Determinants of financial inclusion
We employed binary logistic regression analysis to look into the key factors influencing financial inclusion in the rural South Wollo zone. Ten variables were chosen as the explanatory variables that influence financial inclusion in the rural area based on the literature. Six variables were found to be statistically significant among the explanatory variables. Age, education, affordability, financial capacity, faith in traditional financial associations, Islamic banking services, and distance from financial institutions were all important factors. The binary logistic regression result is shown in table .
Table 7. Binary logistic regression estimation result and respective marginal effect for financial inclusion
Age of the respondent (AGH): The outcome demonstrates a favorable and substantial correlation between respondent age and financial inclusion. The likelihood of rural families receiving financial services grows along with the respondent’s age. The outcome showed that, when other factors are held constant, the probability of an individual being included in financial services improves by 2.5% for every year of age. This suggests that as people become older, their desire to save money and their level of financial awareness will also rise. The youngest residents in rural areas are less likely to be financially included because they have less money to save and borrow from or because they do not make enough money to save and cannot obtain credit because there is no collateral or guarantee. The fact that children in rural regions work for their family until they get married and can support themselves is crucial.
According to a study by Asuming et al. (Citation2019), young people are less likely to participate in the formal financial sector because they are less likely to participate in the formal labor market. The usage of financial services, however, may be severely impacted by age-related garbage retention, involuntary exclusion due to distance, and the expense of financial services. Additionally, our findings are in line with those of (Soumaré et al., Citation2016; Abdu et al. (Citation2021); Workineh Ayenew Mossie (Citation2022)).
Education Level (EDUL): The results showed that secondary school completion is statistically significant at 5%, with the predicted sign for the variable education. This demonstrates that the likelihood of being financially included improves with higher levels of education. Secondary-educated individuals are more likely to be financially included. 4.9% more people who are financially included are likely to finish secondary school than those who are illiterate.
This suggests that the propensity for people and households to enter the formal financial sector is higher when people and households have greater financial literacy. Education also increases people’s knowledge of financial concepts, financial numeracy, and ability to make informed decisions. It also improves people’s money management skills and awareness of financial products, and it streamlines the financial services process (Ozili, Citation2021). According to Mndolwa and Alhassan (Citation2020) and Workineh Ayenew Mossie (Citation2022), education raises people’s chances of being included in the financial system. Desalegn and Yemataw (Citation2017) discovered that those with higher levels of education are also more likely to have accounts with reputable financial organizations. Another study by Zins and Weill (Citation2016) confirmed our finding that education has a favorable impact on financial inclusion.
Affordability (AFS): At a 1% level of significance, the affordability of financial services was found to be statistically significant and to have a favorable link with financial inclusion. The outcome demonstrates that the likelihood of including the rural community in financial services grows as different prices become more reasonable. It showed that the likelihood of people using financial services increases by 3.6% as long as the price is reasonable. This suggests that rural areas are susceptible to changes in various fees (interest rate, withdrawal fees, and minimum requirements). Low-income rural households’ access to financial institutions is impacted by costs connected with financial services such as account maintenance fees, account minimum balances, processing fees, interest rates, and remittance fees.
The lower preference for formal financial institutions in rural communities is a result of the higher cost of obtaining financial services. Another way to look at it is that low-income rural communities choose traditional institutions because they offer greater deposit rates for their modest deposits. In other words, given that interest rates affect the benefits of saving, the fact that deposit interest rates are lower than borrowing interest rates has a big impact on how rural communities see formal financial institutions. Our discovery agrees with Simatele and Maciko’s findings from 2022. (Zins & Weill, Citation2016).
Financial capability (FCA): According to the results, financial competence has a favorable impact on financial inclusion and is significant at a 1% level of significance. According to the regression analysis, rural residents are more likely to use formal financial services when their level of literacy or financial aptitude rises. When other factors are held constant, the likelihood of being financially included rises by 3.2% as financial capability increases. Understanding fundamental financial concepts, including fees, interest rates, and lending requirements, is referred to as “financial literacy.”
As financial markets become more complicated and require more technology, literacy, especially financial literacy, has steadily come to be seen as more crucial. The illiterate finds it difficult to make informed financial judgments. Rural households frequently lack the knowledge necessary to understand the costs involved in managing their accounts and the various services provided by financial institutions (Simatele & Maciko, Citation2022). Motivated and competent in making financial plans are those who are financially capable (Shankar, Citation2013). The research of (Potocki and Cierpiał-Wolan (Citation2019); Abdu and Adem (Citation2021); and Workineh Ayenew Mossie (Citation2022) is congruent with this study.
Islamic Banking Service (ROFS): According to the regression analysis, at a 5% level of significance, the presence of Islamic banking services significantly improves financial inclusion. When all other factors are held equal, the availability of Islamic banking services raises the likelihood of being financially included by 1.2%. Many of the populations in the study region are adherents of the Islamic faith. Due to Sharia law’s ban on interest-bearing financial services, Muslim communities tend to steer clear of them. In other words, nations with an active Islamic banking sector have higher levels of financial inclusion. This indicates that a key element in explaining the degree of financial inclusion in rural areas is the use of Sharia-compliant finance. There are extremely few uses for Sharia-compliant financial products in Ethiopia’s rural areas, and very little access to Islamic banking services.
Muslims are less likely than non-Muslims to own a formal account for saving in official financial institutions if Sharia-compliant banking services are not offered, according to a World Bank report published in 2021. This outcome is similar with research by Naceur et al. (Citation2015), who provided some evidence that the presence and activity of Islamic banks are related to greater financial inclusion in Muslim OIC member nations.
Trust toward traditional financial associations (ToTFA): This factor was statistically significant and had a negative impact on financial inclusion. The findings indicate that being accepted into formal financial institutions is less likely when there is high trust in traditional financial associations. According to the regression analysis’s findings, 1.9% fewer low- income rural families are likely to use formal financial institutions as a result of their faith in traditional associations. The rural community’s ability to participate in the financial system is negatively impacted by strong faith in traditional banking associations.
Due to their low income, rural households were unable to save in banks and instead turned to rotating savings and credit clubs and other self-help organizations. Local moneylenders in rural areas are the main sources of loans for households there, although they charge very high interest rates. This is due to the fact that informal financial organizations have excellent awareness of their clients’ needs, collateral requirements, and lending terms. This demonstrates that informal financial groups serve as a substitute for conventional financial institutions in the rural parts of the South Wollo Zone. This outcome is in line with the investigation of (Simatele & Maciko, Citation2022).
Distance (DSFI): Distance from formal financial inclusion is a significant factor that has an impact on financial inclusion in rural areas of the nation. Our research revealed that distance has a substantial impact on financial inclusion. The likelihood of being included in financial services reduces by 1.6% for every 1 kilometer away from financial institutions. The rural areas are up to 50 km away from the service centers, and the cost of travel for these communities is not only assessed in monetary terms; it also has an impact on them by requiring time away from livelihood-generating activities (Simatele & Maciko, Citation2022). The distance to the nearest financial service location has an impact on financial inclusion in rural communities. This suggests that if formal financial institutions are placed very close to where people live, then people and households are more likely to work in the financial industry. Rural areas will save money on transportation, have better access to banks, and have more access to basic financial services like establishing bank accounts, getting an ATM card, and other services offered by financial institutions if branches are located close to the rural villages.
According to a study by Ozili (Citation2021), financial institutions in residential areas and small communities will be able to launch promotional campaign activities that are specifically targeted at community members in order to persuade them to participate in the formal financial sector by opening accounts and using other services that are offered. The distance between service places is shortened by the availability of technical services like ATMs, debit and credit cards, and mobile banking (Bachas et al., Citation2018). This outcome is in line with those of (Workineh Ayenew Mossie, Citation2022).
5. Conclusion and recommendation
In conclusion, we found that just 20.72% of rural communities are financially involved in official financial institutions, leaving 79.28% of rural areas financially excluded. According to the study’s findings about the determinants, the level of financial inclusion in the rural area of the south Wollo zone is significantly explained by the respondent’s age, affordability, financial capability, education, and access to Islamic banking services.
The majority of the nation’s formal financial institutions are located in the cities, and the infrastructure and geographic makeup of the rural communities in the south Wollo zone have an impact on the level of financial inclusion there. It is challenging for rural communities to become financially integrated into formal financial institutions because rural households’ trust in traditional financial associations affects formal financial institutions, the services provided by informal financial institutions are flexible, and they have more trust in them.
The result implies that while formulating policies, the government and policymakers should take into account rural populations, which make up the majority of the nation. Financial institutions that can offer services at reasonable prices are needed by rural households, and the involved parties should cooperate to increase financial capabilities to encourage rural communities to adopt formal financial services. The creation of complementary policies by policymakers is necessary for traditional financial associations. Finally, the report makes policy recommendations that should shorten travel times to service locations and expand the availability of Islamic banking services in remote areas.
Due to the study’s geographic confinement, it is possible that the factors affecting financial inclusion in rural areas that are covered in this research do not apply to the entire nation. Different demographic traits may have an impact on financial inclusion, which may therefore have an impact on the efficacy of programs. Further study is required to examine factors influencing financial inclusion in rural areas, utilizing a wide range of data.
Availability of data
The data sets used for the current work will be made available by the relevant author upon reasonable request.
Acknowledgements
We appreciate the editor’s feedback as well as that of the reviewers who chose to remain anonymous. We also acknowledge Wollo University’s financial contribution to this work.
Disclosure statement
No potential conflict of interest was reported by the author(s).
Additional information
Funding
Notes on contributors

Tefera Getachew Dagnachew
Tefera Getachew Dagnachew is a lecturer at wollo university, Ethiopia. His research interest includes development issues like poverty, food security, household economics, rural development, macroeconomics policy analysis, urban and regional economics and agricultural policy analysis.
Temeselew Woldetsadik Mawugatie
\Temeselew Woldetsadik Mawugatie is a lecturer at Wollo University, Ethiopia. His research interest includes Development issues like poverty, food security, household economics, rural development, agricultural innovations and extensions, education economics, Urban and regional economics, agricultural policy analysis, and Microeconomics policy analysis.
Notes
1. Kebele, is the lowest administrative system in Ethiopian authority hierarchy.
2. Households in the target kebeles.
3. Marginal effect of the binary logistic estimates’ and dy/dx for factor levels is the discrete change from the base level.
References
- Abdu, E., Adem, M. . (2021). Determinants of financial inclusion in the Afar Region: Evidence from selected woredas. Cogent Economics & Finance, 9(1), 1920149. https://doi.org/10.1080/23322039.2021.1920149
- Abel, S., Mutandwa, L., & Le Roux, P. 2018. A review of determinants of financial inclusion. International Journal of Economics and Financial Issues. https://www.econjournals.com/index.php/ijefi/article/view/5458
- Abraham, T. W. (2018). Estimating the effects of financial access on poor farmers in rural Northern Nigeria. Financial Innovation, 4(1), 1–16. https://doi.org/10.1186/s40854-018-0112-2
- Anand, S. K., & Kuldip, S. C. (2013). A theoretical and quantitative analysis of financial inclusion and economic growth. Management and Labour Studies, 38(1 and 2), 103–133. https://doi.org/10.1177/0258042X13498009
- Arif, I., Afshan, S., & Sharif, A. (2016). Resistance to mobile banking adoption in a developing country: evidence from modified TAM. Journal of Finance and Economics Research, 1(1), 25–42. https://doi.org/10.20547/jfer1601104
- Asuming, P. O., Osei-Agyei, L. G., & Mohammed, J. I. (2019). Financial inclusion in sub-Saharan Africa: Recent trends and determinants. Journal of African Business, 20(1), 112–134. https://doi.org/10.1080/15228916.2018.1484209
- Bachas, P., Gertler, P., Higgins, S., & Seira, E. (2018). Digital financial services go a long way: transaction costs and financial inclusion. AEA Papers and Proceedings, 108, 444–448. https://doi.org/10.1257/pandp.20181013
- Central Statistical Agency. (2021). Federal demographic republic of population projection of Ethiopia from 2014 – 2017: population projection of Ethiopia for All Regions At Woreda Level from 2014-2017. Central Statistical Agency (CSA), August 2013, 1–118.
- Das, S. (2015). Factors Affecting Financial Inclusion: a Study in Rourkela ( Doctoral dissertation). https://core.ac.uk/download/pdf/80148515.pdf
- Demirguc-Kunt, A., Klapper, L., Singer, D., Ansar, S., & Hess, J. (2018). The global findex database 2017: measuring financial inclusion and the fintech revolution. The World Bank.
- Dereje Bekele, W. (2022). Determinants of Financial Inclusion: A Comparative Study of Kenya and Ethiopia. Journal of African Business. https://doi.org/10.1080/15228916.2022.2078938
- Desalegn, G., & Yemataw, G. (2017). Financial inclusion in Ethiopia: Using LSMS (Ethiopia Socioeconomic Survey) data. Ethiopian Journal of Economics, 26(2), 31–58. https://www.ajol.info/index.php/eje
- Desalegn, G., & Yemataw, G. (2017). Financial inclusion in Ethiopia: Using LSMS (Ethiopia socioeconomic survey) data. Ethiopian Journal of Economics, 26(2), 31–58. https://www.ajol.info/index.php/eje/article/view/177737
- Evans, O. (2016). Determinants of financial inclusion in Africa: A dynamic panel data approach. https://mpra.ub.uni-muenchen.de/81326/1/MPRA_paper_81326
- Fagerland, M. W., & Hosmer, D. W. (2012). A generalized Hosmer-Lemeshow goodness-of-fit test for multinomial logistic regression models. Stata Journal, 12(3), 447–453. https://doi.org/10.1177/1536867X1201200307
- Gallego-Losada, R., Montero-Navarro, A., Luis Rodríguez-Sánchez, J., & González-Torres, T. (2022). Retirement planning and financial literacy, at the crossroads. A bibliometric analysis. Finance Research Letters, 44, 102109. https://doi.org/10.1016/j.frl.2021.102109
- Hasan, M., Thi, L., & Hoque, A. (2021). How does financial literacy impact on inclusive finance? Financial Innovation, 7(1), 1–23. https://doi.org/10.1186/s40854-021-00259-9
- Karlan, D., Lakshmi Ratan, A., & Zinman, J. (2014). Savings by and for the poor: a research review and Agenda. Review of Income and Wealth, 60(1), 36–78. https://doi.org/10.1111/roiw.12101
- Mandira, S. (2013). Financial inclusion and development: A cross country analysis, Indian council for research on international economic relations, core 6A. India Habitat Centre.
- Mndolwa, F. D., & Alhassan, A. L. (2020). Gender disparities in financial inclusion: Insights from Tanzania. African Development Review, 32(4), 578–590. https://doi.org/10.1111/1467-8268.12462
- Naceur, M. S. B., Barajas, M. A., & Massara, M. A. (2015). Can Islamic banking increase financial inclusion? International Monetary Fund. No. 15-31.
- Nkuna, O., Faith Lapukeni, A., Kaude, P., & Kabango, G. (2018). The role of commercial banks on financial inclusion in Malawi. Open Journal of Business and Management, 6(4), 812–832. https://doi.org/10.4236/ojbm.2018.64061
- Ozili, K. P. (2021). Financial inclusion: Globally important determinants. Financial InternetQuarterly, 17(4), 1–11. https://dx.doi.org/10.2139/ssrn.3998152
- Pedace, R. (2013). Econometrics For Dummies. http://www.wiley.com/go/permissions
- Potocki, T., & Cierpiał-Wolan, M. (2019). Factors shaping the financial capability of low-income consumers from rural regions of Poland. International Journal of Consumer Studies, 43(2), 187–198. https://doi.org/10.1111/ijcs.12498
- Sarma, M. (2008). Index of financial inclusion ( No. 215). Working paper.
- Sarma, M., & Pais, J. (2011). Financial Inclusion and Development. Journal of International Development, 23, 613–625. https://doi.org/10.1002/jid.1698
- Shankar, S. (2013). Financial inclusion in India: do microfinance institutions address access barriers? ACRN Journal of Entrepreneurship Perspectives, 2, 60–74. http://www.acrn.eu/resources/Journals/201302d.pdf
- Simatele, M. C, Dube, Z, & Khumalo, S. (2021). How digital finance affects poverty: The transmission mechanism view. In (Ed.), Financial inclusion: basic theories and empirical evidence from African countries. https://doi.org/10.4102/aosis.2021.BK255
- Simatele, M., & Maciko, L. (2022). Financial inclusion in Rural South Africa: A qualitative approach. Journal of Risk and Financial Management, 15(9), 376. https://doi.org/10.3390/jrfm15090376
- Soumaré, I., Tchana Tchana, F., & Kengne, T. M. (2016). Analysis of the determinants of financial inclusion in Central and West Africa. Transnational Corporations Review, 8(4), 231–249. https://doi.org/10.1080/19186444.2016.1265763
- Timbula, M. A., Mengesha, T., Mekonnen, Y., & Kebede, M. (2019). Financial Inclusion and its Determinants among Households in Jimma Zone of Oromia Regional State, Ethiopia. International Journal of Commerce and Finance, 5(2), 106–119. http://ijcf.ticaret.edu.tr/index.php/ijcf/article/view/124
- Workineh Ayenew Mossie. (2022). Understanding financial inclusion in Ethiopia. Cogent Economics & Finance, 10(1), 2071385. https://doi.org/10.1080/23322039.2022.2071385
- World Bank; NBE and CSA. (2020). Ethiopia Socioeconomic Survey (ESS) - 2018/19: financial inclusion. 1–69.
- Xiaoyan, X. (2020). Trust and financial inclusion: A cross-country study. Finance Research Letters, 35, 101310. https://doi.org/10.1016/j.frl.2019.101310
- Yamane, T. (1967). Statistics an Introductory Analysis (Third). Harper & Row.
- Zins, A., & Weill, L. (2016). The determinants of financial inclusion in Africa. Review of Development Finance, 6(1), 46–57. https://doi.org/10.1016/j.rdf.2016.05.001