
 ?Mathematical formulae have been encoded as MathML and are displayed in this HTML version using MathJax in order to improve their display. Uncheck the box to turn MathJax off. This feature requires Javascript. Click on a formula to zoom.
Abstract
We examine how monetary policy of the Federal Reserve System, COVID-19 mortality cases, and vaccinations are associated with the US stock market volatility during the pandemic period. Using the wavelet coherence analysis, we first find that there is a positive relationship between the volatility and death tolls. Second, while in the short term the sizable interest rate cut causes market instability, in the intermediate term it stabilizes the market. Third, vaccinations and the volatility have a negative relationship. Finally, the monetary policy and the volatility have much stronger coherency than the vaccination and the movements. These findings are consistent with panel regression results. Specifically, we find that the systemic COVID-19 shock in the US stock market is alleviated by an increase in the number of COVID-19 vaccination doses administered and a low and stable change in the effective federal funds rate. Furthermore, our results show that the monetary policy influences the stock market volatility significantly more than the vaccination, regardless of firm size and industry type. Thus, this study helps policymakers cope with possible systemic shocks from other infectious diseases, considering the magnitude of monetary and health policy and their short/intermediate/long-term lagging effectiveness in reducing market volatility.
1. Introduction
The coronavirus disease 2019 (COVID-19), unlike other infectious disease outbreaks, has generated significant attention and concern to the stock market due to its unprecedented large impact on the market. Mass vaccinations started after the US Food and Drug Administration issued an emergency use authorization to the Pfizer and Moderna COVID-19 vaccine in December 2020. In addition, to reduce uncertainty and regain confidence in the US financial market, the Federal Reserve System (Fed) slashed the emergency lending rate and maintained a low-interest rate. Cutting rates could bolster confidence, keep borrowing costs cheap, and stimulate the stock market.
A recent literature has studied risk transmission of COVID-19 in the stock market and effects of COVID-19 vaccinations or government interventions (i.e. monetary policy) on the stock market. Still, the following questions have not been answered yet: what is the key driver of reducing the stock market volatility caused by the COVID-19? Is it because of the central bank’s aggressive monetary policy or the mass vaccination? To what extent does each reduce the volatility? Do they effectively stabilize firms’ volatilities regardless of their nature of business? In this paper, we attempt to fill the gap in the literature by looking for the answers to these questions.
To this end, we construct variables of interest used in the literature. First, we use changes in COVID-19 deaths and vaccination doses administered as a proxy for bad and good news about COVID-19, repsecitvely (Anastasiou et al., Citation2022; Iyer & Simkins, Citation2022; Liu et al., Citation2021; Subramaniam & Chakraborty, Citation2021). Second, as in the literature (Fatum & Hutchison, Citation1999; Fullana et al., 202 l; Kim & Stock, Citation2014; Wongswan, Citation2009), we also use the effective federal funds rate (EFFR) to proxy the monetary policy.
We use the wavelet coherence analysis method (Goodell & Goutte, Citation2021; Grinstead et al., Citation2004; Rua & Nunes, Citation2009) to explore the magnitude of interaction and coherence between our three variables of interest and the US stock market volatility and their evolution over time because the method effectively identifies regions of high comovement in the time-frequency space. Put another way, we show using the wavelet coherence analysis method how profoundly different the effect of the monetary policy and the vaccination program on the US stock market volatility can be depending on the time horizon (Ftiti et al., Citation2016; Omane-Adjepong et al., Citation2019). More specifically, our wavelet coherence analysis results show that in the short term (2 ~ 8 weeks) the Fed’s sizable EFFR cut increases the stock market volatility in the US, but in the intermediate term (8 ~ 16 weeks) the cut eventually stabilizes the volatility. This finding implies that there is a possible lagged effect of the monetary policy on the US stock market. Moreover, we find that the death toll (bad news) increases the US stock market volatility, whereas the COVID-19 vaccination (good news) stabilizes the volatility, and these relationships hold regardless of the time frame. Further, we find that the volatility in the US stock market during the pandemic is mainly affected by changes in the EFFR, and marginally by the vaccination and the death toll.
To quantify the effects of the three proxies on the firm-level stock market volatilities in the US, we use the fixed-effects panel regression. We confirm that the results are, in general, consistent with the Wavelet coherency analysis: bad news increases the firm-level US stock market volatilities, whereas good news decreases the volatilities, and the variation in the monetary policy has a more significant impact on them than the change in the COVID-19 vaccination. Finally, we find that these findings are robust to changes in sample industries and firm size.
We contribute to the literature that studies the risk transmission of COVID-19 to the overall stock market (Baek & Lee, Citation2021; Baek et al., Citation2020; Just & Echaust, Citation2020; Mazur et al., Citation2021; Vera-Valdés, Citation2022) by examining effects of the vaccination and the monetary policy on the stock market. Baek and Lee (Citation2021) find a risk spillover impact of COVID-19 on the US stock market: the bad news affects the US stock market much more than the good news. Baek et al. (Citation2020) and Mazur et al. (Citation2021) show that COVID-19 increases total risk across all industries, and the industry exposures to the risk are different by the types of industry (i.e., defensive industry vs. non-defensive industry). Vera-Valdés (Citation2022) detects a nonstationary behavior in the stock markets and persistence in volatilities after the emergence of COVID-19. Similarly, Just and Echaust (Citation2020) find a structural break in the stock market returns and volatility persistence due to the COVID-19 pandemic. However, these studies do not consider the effect of the vaccination and the monetary policy on the stock market volatilities both at the firm level and the aggregated market level.
Further, our study relates to the literature on the COVID-19 vaccination and the stock market volatilities. Rouatbi et al. (Citation2021) suggest that the COVID-19 vaccination decreases the stock market volatility across countries. Chan et al. (Citation2022) find that global stock markets respond positively to the COVID-19 vaccine news and convey important information about market-wide expectations on the economic value of the development of COVID-19 vaccines. They do not, however, consider an important goverent action of monetary policy and its impact on the stock market volatilities in their study.
On the contrary, other branches of the literature focus on the role of the monetary policy to stabilize the stock market while ignoring the impact of the vaccination on the stock market. Wei and Han (Citation2021) find the pandemic weakened transmission of monetary policy on financial markets around the world and therefore argue that a more assertive monetary policy in the post-pandemic period is needed. Davidovic (Citation2021) finds that stock markets were sensitively affected by the emergence of COVID-19 but became less volatile afterward because of active government interventions. Hoang et al. (Citation2022) show that government responses to COVID-19 and economic support positively affect corporate investment. Cortes et al. (Citation2022) emphasize that the Fed’s response to the COVID-19 crisis minimizes tail risk in the US equity markets. In this study, we consider both the monetary policy and the vaccination policy to study how they affect the stock market volatility both at the aggregated market level and at the firm level, whether their relationship with the market volatility evolves over time, and to what extent each policy has sedated the US market volatilities.
The paper is organized as follows: Section 2 describes data, and the construction of variables. Section 3 presents the wavelet analysis method and the fixed effect panel regression model. Section 4 reports the key results. We conclude in Section 5.
2. Data and variables
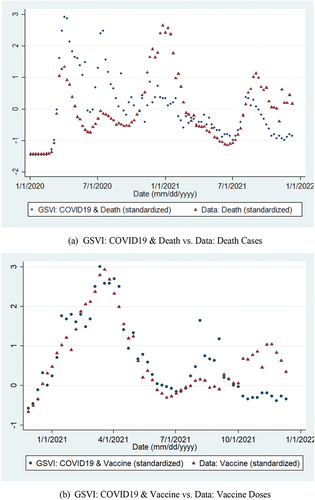
We collect weekly EFFR from the Fed and use standard deviations of the weekly EFFR before 12 months (Fatum & Hutchison, Citation1999; Kim & Stock, Citation2014) to proxy the monetary policy. Next, using data from the Our World in Data website, we construct a standardized weekly COVID-19 death growth rate as a COVID-19 fear indicator or bad news (Baek & Lee, Citation2021) and a standardized weekly vaccination growth rate as a proxy for COVID-19 vaccination policy or good news. Since the stock market movements during COVID-19 have been more reflective of sentiment than substance, as documented by Cox et al. (Citation2020), we use the weekly Google Search Volume Index (GSVI) to measure investor’s COVID-19 sentiment (Da et al., Citation2011) and compare the GSVI sentiment measures with the COVID-19 variables in our data. As shown in Figure , the GSVI measures and our variables move closely together and are highly correlated. Finally, from Compustat, we collect daily firm-level stock prices of common stocks listed in NYSE, AMEX, Nasdaq, NYSE Arca, then eliminate penny stocks less than 5 dollars, calculate weekly stock returns for each firm, and use the square of its stock return as firm-level risk in the US stock market.
Figure 1. Google Search Volume Index (GSVI) and Public Data on COVID19. (a) GSVI: COVID19 & Death vs. Data: Death Cases. (b) GSVI: COVID19 & Vaccine vs. Data: Vaccine Doses.
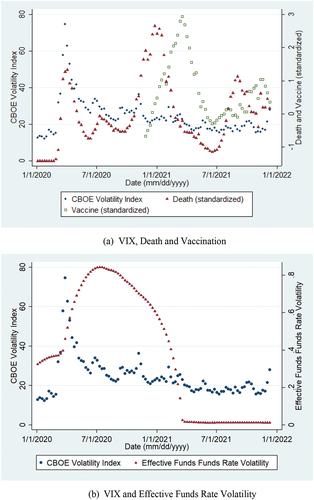
In Figure , VIX and our proxy variables seem to be related to each other during the 2020 stock market crash (20 February 2020—7 April 2020), but it is not entirely clear whether COVID-19 death, vaccination statistics, and EFFR volatility since the pandemic started have influenced the stock market volatility. To shed light on this, we use wavelet coherency analysis to capture the strength and causal direction of the relationship between these variables in the time and frequency domain, and quantify their effect on the volatility using the fixed panel regression.
Figure 2. VIX, Deaths, Vaccine Doses and Effective Federal Funds Rate Volatility. (a) VIX, Death and Vaccination. (b) VIX and Effective Funds Rate Volatility.
3. Methodology
3.1. Wavelet methodology
We use wavelet coherence analysis (Grinstead et al., Citation2004) to detect transient but significant coherence between multivariate nonlinear signals. The analysis uses the continuous wavelet transform (CWT), which decomposes a time series into the time-frequency domain by convolving the time series with the scaled and translated versions of a mother wavelet function (Tian et al., Citation2016; Torrence & Campo, Citation1998). The CWT of a time series of length at a time step of
is written in the following form:
where n is a time index, s represents the timescale inverse to the frequency, and * indicates the complex conjugate. A wavelet power spectrum of can be defined as the wavelet transformation of its autocorrelation function:
Then, the CWT of two time series, x(n) and y(n), is written in equation (3):
The modulus is the amount of joint power between
and
. Then, the relative phase between
and
is expressed as
which represents the complex argument. Following Torrence and Webster (1999), we use a squared cross-wavelet coherence,
, to examine the relative amplitude between
and
:
where S is a smoothing operator over time and scale, and is conceptually a localized correlation between and
with
.
3.2. Estimation methodology
To quantify the effect of COVID-19 fear indicator, health, and monetary policy on the US stock market risk, we estimate Equationequation (1)(1)
(1) , exploiting panel variations across firms and time:
where Riskft is the weekly square stock return of firm f at a given week t. Deatht and Vaccinetare the standardized growth rates of deaths attributed to COVID-19 and the COVID-19 vaccination doses administered, respectively. More specifically, we first demean death and vaccination dose growth rates and normalize each to have a standard deviation of one. By incorporating firm-fixed effects (), we absorb time-invariant firm characteristics and quarter-fixed effects (
) control for macroeconomic shocks that may affect the volatility. In all regressions, we cluster standard errors on firms to account for possible serial correlations within firms.
4. Results
Figure illustrates the wavelet coherence and phase difference between VIX and the proxy variables. Blue color represents low time-series coherency, whereas yellow color represents higher coherency. Arrows indicate phase differences and causality. For example, → (←) indicates in-phase (out-of-phase). ↗ and ↙ indicate VIX is leading a proxy variable, while ↘ and ↖ indicate a proxy variable is leading VIX. We define 0.5~0.125 MHz (2 ~ 8 weeks) as short-term, 0.125~0.0625 MHz (8 ~ 16 weeks) as mid-term, below 0.03125 MHz (above 16 weeks) as long-term. We find (i) a solid in-phase coherency (positive relationship) between VIX and death cases and death cases lead VIX; (ii) vaccinations in general lead VIX with an out-of-phase (negative relationship) coherency; (iii) in the short-term, VIX leads the EFFR volatility, but arrows in the majority in the mid-term band are↖, indicating an out-of-phase coherency and a possible lagged relationship between VIX and the EFFR volatility; and (iv) the monetary policy and VIX show stronger coherency than the vaccination policy and VIX.
Figure 3. Wavelet Coherency Table . Baseline Regression Results. (a) VIX vs. Death Cases. (b) VIX vs. Vaccinations. (c) VIX vs. Effective Federal Funds Rate Volatility.
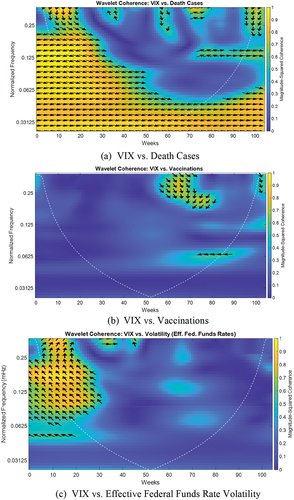
Table 1. Baseline regression results
reports estimates of Equationequation (5)(5)
(5) . For completeness, we report the estimates separately and together. Overall, our fixed effect regression results are consistent with the Wavelet coherency analysis. More specifically, we find that in all specifications the firm-level US stock market risk is significantly and positively related to the growth rate of death, which is consistent with the literature (Baek & Lee, Citation2021; Baek et al., Citation2020; Bissoondoyal-Bheenick et al., Citation2021), while the risk is negatively but still significantly affected by the growth rate of vaccination. These imply that investors interpret the death toll as a negative signal, whereas an increase in the vaccination positively signals to investors. Furthermore, we find that the EFFR volatility is precisely estimated and positively affects the firm-level stock return volatility. We interpret this result as evidence showing the low level of EFFR volatility maintained by the Fed reduces the risk of each firm’s equity asset. Quantitatively, as reported in column (7) of Table , one standard deviation increase in the COVID-19 death rate leads to a 0.141 increase in the volatility, and one standard deviation increase in the COVID-19 vaccination rate decreases the volatility by 0.026. Finally, we observe that one standard deviation decrease in EFFR decreases the stock return volatility by 0.448.
In the results above, we are exploiting all industries in the sample. Firms in specific industries such as finance, accommodation, transportation, oil, food, drug and health industry, however, may respond distinctly differently to the pandemic than firms in other sectors because of their unique capital structure and different levels of exposure to COVID-19. Furthermore, the firm size is negatively correlated with the volatility, but we cannot control the firm size at the weekly frequency. To address these issues, we experiment with the sample by dropping firms in some of the industries in the sample and using tercile subsamples basing on firm-level market value. Table report the result. We find that the results are quantitatively and qualitatively similar to our baseline results and conclude that our baseline result is robust to changes in sample industries and firm size. Finally, we re-estimate Equationequation (5)(5)
(5) by dropping one industry at a time, using firm-size quintile subsamples and employing bootstrapped standard errors. Our results are invariant to these additional sensitivity analyses (results are available upon request).
Table 2. Sensitivity to industry
Table 3. Sensitivity to sample
5. Conclusion
Our study investigates associations of the Fed’s monetary policy, COVID-19 death tolls, and immunization with recent dynamic changes in the US stock market. Based on the Wavelet coherence analysis, we show the effect of monetary policy and the vaccination on the US stock market volatility can be profoundly different depending on the time frame. More specifically, while a significant FED interest rate drop in the short-term results in market instability, in the intermediate term the interest cut reduces fear in the stock market, implying a possible lagged effect of the monetary policy on the stock market. Furthermore, we show that there is a positive correlation between the US market volatility and the death toll (in-phase coherence), while there is an inverse correlation between the US market volatility and immunization rates (out-of-phase coherence). Last but not least, the monetary policy and the volatility have much stronger coherency than the immunization and the fluctuation in the US stock market.
Next, we use the fixed-effects panel regression to quantify the effects of death tolls, vaccinations and monetary policy on the firm-level stock market volatility in the US stock market during the pandemic period and confirm that the results are in general consistent with the wavelet coherency analysis results. As in the literature, we find that the risk rises as the death growth rate rises. Moreover, we find the COVID-19 vaccination and the monetary policy reduce the risk, but interestingly the change in the monetary policy significantly more influences the stock market volatility than the vaccination. These findings are robust to the firm size and the types of industries.
In light of the size of monetary and health policy as well as their short, intermediate, and long-term effectiveness in lowering market volatility, this study aids policymakers in coping with a potential systemic shock from other infectious disease outbreaks. However, there is one caveat in our results. Given that we only focus on US equities, our results may be country-specific and hence are solely applicable to the US market. To generalize our results, the availability of microdata on every stock market, monetary policies, and vaccinations in the world could be useful.
Disclosure statement
No potential conflict of interest was reported by the author(s).
Additional information
Funding
References
- Anastasiou, D., Ballis, A., & Drakos, A. (2022). Constructing a positive sentiment index for COVID-19: Evidence from G20 stock markets. International Review of Financial Analysis, 81, 102111. https://doi.org/10.1016/j.irfa.2022.102111
- Baek, S., & Lee, K. (2021). The risk transmission of Covid-19 in the US stock market. Applied Economics, 84, 1–12. https://doi.org/10.1080/00036846.2020.1854668
- Baek, S., Mohanty, S., & Glambosky, M. (2020). Covid-19 and stock market volatility: An industry level analysis. Finance Research Letters, 37, 101748. https://doi.org/10.1016/j.frl.2020.101748
- Bissoondoyal-Bheenick, E., Do, H., Hu, X., & Zhong, A. (2021). Learning from SARS: Return and volatility connectedness in COVID-19. Finance Research Letters, 41, 101796. https://doi.org/10.1016/j.frl.2020.101796
- Chan, K. F., Chen, Z., Wen, Y., & Xu, T. (2022). COVID-19 vaccines and global stock markets. Finance Research Letters, 102774. https://doi.org/10.1016/j.frl.2022.102774
- Cortes, G., Gao, G. P., Silva, F. B. G., & Song, Z. (2022). Unconventional monetary policy and disaster risk: Evidence from the subprime and COVID–19 crises. Journal International. Money and Finance, 122, 1025343. https://doi.org/10.1016/j.jimonfin.2021.102543
- Cox, J., Greenwald, D. L., & Ludvigson, S. (2020). What Explains the COVID-19 Stock Market? NBER Working Paper, 27784. National Bureau of Economic Research. https://doi.org/10.3386/w27784
- Da, Z., Engelberg, J., & Gao, P. (2011). In search of attention. Journal of Finance, 66(5), 1461–1499. https://doi.org/10.1111/j.1540-6261.2011.01679.x
- Davidovic, M. (2021). From pandemic to financial contagion: High-frequency risk metrics and bayesian volatility analysis. Finance Research Letters, 42, 101913. https://doi.org/10.1016/j.frl.2020.101913
- Fatum, R., & Hutchison, M. (1999). Is intervention a signal of future monetary policy? Evidence from the federal funds futures market. Journal of Money Credit and Banking, 31(1), 54–69. https://doi.org/10.2307/2601139
- Ftiti, Z., Guesmi, K., & Abid, I. (2016). Oil price and stock market comovement: What can we learn from time-scale approaches? International Review of Financial Analysis, Elsevier, 46, 266–280. https://doi.org/10.1016/j.irfa.2015.08.011
- Goodell, J. W., & Goutte, S. (2021). Co-movement of COVID-19 and Bitcoin: Evidence from wavelet coherence analysis. Finance Research Letters, 38, 101625. https://doi.org/10.1016/j.frl.2020.101625
- Grinstead, A., Moore, J. C., & Jevrejeva, S. (2004). Application of the cross wavelet transform and wavelet coherence to geophysical time series. Nonlinear Process in Geophysics, 11(5/6), 561–566. https://doi.org/10.5194/npg-11-561-2004
- Hoang, K., Arif, M., & Nguyen, C. (2022). Corporate investment and government policy during the COVID-19 crisis. International Review of Economics & Finance, 80, 677–696. https://doi.org/10.1016/j.iref.2022.03.005
- Iyer, S. R., & Simkins, B. J. (2022). COVID-19 and the economy: Summary of research and future directions. Finance Research Letters, 47, 102801. https://doi.org/10.1016/j.frl.2022.102801
- Just, M., & Echaust, K. (2020). Stock market returns, volatility, correlation and liquidity during the COVID-19 crisis: Evidence from the Markov switching approach. Finance Research Letters, 37, 101775. https://doi.org/10.1016/j.frl.2020.101775
- Kim, D. H., & Stock, D. (2014). The effect of interest rate volatility and equity volatility on corporate bond yield spreads: A comparison of noncallables and callables. Journal of Corporate Finance, 26, 20–35. https://doi.org/10.1016/j.jcorpfin.2014.02.005
- Liu, Z., Huynh, T. L. D., & Dai, P. (2021). The impact of COVID-19 on the stock market crash risk in China. Research in International Business and Finance, 57. https://doi.org/10.1016/j.ribaf.2021.101419
- Mazur, M., Dang, M., & Vega, M. (2021). COVID-19 and the march 2020 stock market crash. Evidence from S&P1500. Finance Research Letters, 38, 101690. https://doi.org/10.1016/j.frl.2020.101690
- Omane-Adjepong, A., Alagidede, I. P., & Alagidede, I. P. (2019). Time-frequency analysis of behaviorally classified financial asset markets. Research in International Business and Finance, 50, 54–69. https://doi.org/10.1016/j.ribaf.2019.04.012
- Rouatbi, W., Demir, E., Kizys, R., & Zaremba, A. (2021). Immunizing markets against the pandemic: COVID-19 vaccinations and stock volatility around the world. International Review of Financial Analysis, 77, 101819. https://doi.org/10.1016/j.irfa.2021.101819
- Rua, A., & Nunes, L. (2009). International comovement of stock market returns: A wavelet analysis. Journal of Empirical Finance, 16(4), 632–639. https://doi.org/10.1016/j.jempfin.2009.02.002
- Subramaniam, S., & Chakraborty, M. (2021). COVID-19 fear index: Does it matter for stock market returns? Review of Behavioral Finance, 13(1), 40–50. https://doi.org/10.1108/RBF-08-2020-0215
- Tian, F., Tarumi, T., Liu, H., Zhang, R., & Chalak, L. (2016). Wavelet coherence analysis of dynamic cerebral autoregulation in neonatal hypoxic-ischemic encephalopathy. NeuroImage: Clinical, 11, 124–132. https://doi.org/10.1016/j.nicl.2016.01.020
- Torrence, C., & Campo, G. P. (1998). A practical guide to wavelet analysis. Bulletin of the American Meteorological Society, 79(1), 61–78. https://doi.org/10.1175/1520-0477(1998)079<0061:APGTWA>2.0.CO;2
- Vera-Valdés, J. E. (2022). The persistence of financial volatility after COVID-19. Finance Research Letters, 44, 102056. https://doi.org/10.1016/j.frl.2021.102056
- Wei, X., & Han, L. (2021). The impact of COVID-19 pandemic on transmission of monetary policy to financial markets. International Review of Financial Analysis, 74, 101705. https://doi.org/10.1016/j.irfa.2021.101705
- Wongswan, J. (2009). The response of global equity indexes to U.S. monetary policy announcements. Journal of International Money and Finance, 28(2), 344–365. https://doi.org/10.1016/j.jimonfin.2008.03.003
