
 ?Mathematical formulae have been encoded as MathML and are displayed in this HTML version using MathJax in order to improve their display. Uncheck the box to turn MathJax off. This feature requires Javascript. Click on a formula to zoom.
Abstract
This study employs the TVP-VAR approach to capture the degree of interdependencies and contagion among sixteen implied volatilities. The 16 daily implied volatility indices comprise the implied volatility from various financial assets, such as conventional equities, commodities, and currencies, in national, regional, or worldwide indexes. After missing data were expunged, the daily data span between 5 August 2016 and 18 August 2021 inclusive, yielding 1758 observations. We reveal strong evidence to support that the network of implied volatilities is highly connected. Nonetheless, dynamic connectedness varies across time demonstrating that the markets are heterogenous and adaptive. The rise in connectedness during crisis and non-crisis periods indicates that both contagion and interdependencies are germane to implied volatilities. The outcome from the net directional connectedness underscores that the CBOE Euro Currency Volatility, CBOE Crude Oil Volatility, CBOE Gold Volatility, Hang Seng Index (HSI) and CAC 40 VIX are net persistent receivers whereas CBOE Russell 2000 Volatility, CBOE NASDAQ 100 Volatility, DJIA Volatility, CBOE VIX and CBOE OEX Implied Volatility are persistent net transmitters. The size and direction of net connectedness enlighten investors to pair persistent net receivers and transmitters. Practical, policy and theoretical implications are provided.
1. Introduction
Global financial markets have become increasingly integrated in the past four decades. This probably began with open markets, in which prices of financial assets are determined globally (Lee & Kim, Citation2022). Moreover, emerging and developing economies, beginning from the early 1980s, have instituted financial and institutional reforms, making them more attractive for cross-border trade and investment (Owusu Junior et al., Citation2021; Asafo-Adjei, Boateng et al., Citation2022, Citation2021; Asafo-Adjei, Adam et al., Citation2021). These countries are believed to have adopted electronic trading systems, instituted investor protection laws, enhanced the enforcement of anti-insider trading laws, strengthened connections between domestic exchanges, and enhanced significantly their regulatory and disclosure requirements (Archer et al., Citation2022; Mensi et al., Citation2017; Obeng et al., Citation2022). As a corollary to such reforms, economic shocks have become easily transmissible among countries and between financial markets.
The consequence is that commonalities in the behaviours of financial markets, due to financial and economic integration, have reduced diversification opportunities (Wagner & Szimayer, Citation2004; Ji et al., Citation2022; Barson et al., Citation2022; Nkrumah-Boadu et al., Citation2022). Subsequent to the seminal paper of King and Wadhwani (Citation1990) conducted after the global stock market crash in 1987, a flurry of empirical and theoretical discussions in the investment finance literature have discussed how shocks are transmitted across financial markets. In these studies, words such as “contagion” and volatility “spillover” have been coined to explain the shock transmission in financial markets that cannot be identified by the fundamentals of the markets (Bekaert et al., Citation2022; Troster et al., Citation2019). Nevertheless, the onset of the global financial crisis between 2007 to 2009, coupled with the periodic local financial crisis and the emergence of the global COVID-19 have ignited more interest from academics in financial market contagion.
A common understanding from the extant studies is that singling out contagion in the event of a financial crisis requires that researchers disentangle contagion from market interdependence (see, Grillini et al., Citation2022). Though there is no universally accepted definition for contagion, we define contagion as a shift in cross-market linkages in crisis periods. In this regard, shifts in cross-market linkages can be identified by increased correlations in asset returns, enhanced probability of speculative bubbles, or increased volatility transmission (Forbes & Rigobon, Citation2001). These could arise due to changes in investor expectations or beliefs. For instance, Mullainathan (Citation1998) posits that investors recall prior events imperfectly. Consequently, a crisis in one market can trigger a recollection of past crises, which could make investors assign higher probabilities to a bad state, resulting in downward comovements in asset prices (Lee & Kim, Citation2022). Likewise, internal liquidity shocks from one market can also trigger withdrawal from another market thereby leading to contagion (Smimou & Khallouli, Citation2015). Brunnermeier and Pedersen (Citation2009) proposed that investors who suffer losses in one market may experience funding constraints in another market which eventually deteriorates overall liquidity in the markets.
In this paper, we estimate and examine the connectedness among sixteen implied volatility indices that measure investor risk aversion across global financial markets. The implied volatility index for S&P 500 (VIX) has been touted as the overall investor fear gauge (see, Cheuathonghua et al., Citation2019; Sarwar, Citation2020; Yıldırım, Citation2022; Zhang & Giouvris, Citation2022). Given the superiority of the VIX in transmitting shocks to global financial markets and the recent proliferation of volatility indices as a result of developments in financial innovations, this study offers clarity on whether futures on these indices provide real opportunities to hedge risks and the degree of connectedness amongst the markets in normal and crises conditions.
Indeed, connectedness plays a crucial role in modern risk management and measurement. Network connectedness can be used for tracking the progress of existing crises and also provides an early warning regarding upcoming crises (Yu et al., Citation2018). The visualization of how volatility shocks are transmitted between markets is also a key attribute of network connectedness. Thus, investors are interested in knowing the connectedness among markets for portfolio and asset allocation strategies (Asafo-Adjei, Adam et al., Citation2022, Citation2021; Balcilar et al., Citation2021; Boateng, Asafo-Adjei et al., Citation2022). We rely on volatility indices and therefore deviate from recent existing studies that examine connectedness among markets with price or return series (see, for example, Adekoya & Oliyide, ; Ghosh & Bouri, Citation2022; Liu et al., Citation2020; Mishra & Ghate, Citation2022; Toparlı et al., Citation2019; Wen et al., Citation2019) because volatility indices capture faster the dynamics of information flows and contagion between markets (see, Boateng, Owusu Junior et al., Citation2022; Peng & Ng, Citation2012).
Moreover, we utilize implied volatility indices rather than realized volatility because volatility series obtained from prices or returns are historical. Implied volatility estimates are closely related to realized volatility (Garvey & Gallagher, Citation2012) but also contain information on future idiosyncratic risks and therefore capture investor sentiments about future expectations of price movements (Boateng, Adam, & Owusu, Citation2021; Asafo-Adjei, Frimpong et al., Citation2022; Qabhobho et al., Citation2022). These volatility indices are traded securities and provide investors with options for portfolio optimization and asset allocation decisions.
A gamut of studies has examined connectedness among financial markets. However, studies that examine implied volatility linkages among global financial markets are rare. Del Castillo Olivares et al. (Citation2018) examined the dependence relationships among 29 implied volatility indices from commodities, equities, currencies, and fixed income securities markets using Pearson correlation, Spearman rank correlation, Kendall’s tau, principal component analysis, and independent component analysis and documents that the VIX is a market-driven volatility factor that dominates movements in the other volatility indices. These approaches do not show how the behaviour of such connectedness varies over time, but financial markets and market participants are adaptive (Lo, Citation2004) and market participants have heterogenous expectations over time (Müller et al., Citation1997, Citation1993). Existing studies that employ time varying techniques are restricted to few implied volatilities thereby creating a myopic view on the spillover effects (see, Ji et al., Citation2022; Liu et al., Citation2020; Ghosh & Bouri, Citation2022; Wang et al., Citation2022, etc.). This creates a myopic view on the investigation of interdependence and/or contagion effects across time in a network of implied volatilities.
As a contribution to the extant literature, the TVP-VAR approach is employed in this study to provide a visualization of the connectedness among several implied volatility indices and enable an assessment of how shocks are transmitted at distinct periods to disentangle contagion from market interdependence. Estimates of the size and direction of net connectedness also succours investors to pair negative recipients with positive transmitters of shocks for diversification in crises periods (Bossman, Owusu Junior & Tiwari, 2022).
Findings from the study revealed that connectedness among implied volatilities are heterogenous and adaptive spanning important crises periods. The rise in connectedness among the selected implied volatilities during crises periods such as Eurozone Migrant, the China crash, BREXIT, and finally, the peak of the COVID-19 pandemic from the total dynamic connectedness reveals contagion effects. Additionally, a rise in connectedness was found at non-crisis period signifying that interdependencies occur among implied volatilities. Hence, contagion and interdependencies are useful to implied volatilities.
The next section of the study presents the methodology employed in the study. Subsequently, findings from the TVP-VAR approach are presented and discussed. Afterwards, the conclusion and implications for policy and practice are disclosed.
2. Methodology
2.1. TVP-VAR
In responding to the time-varying connectedness among the financial assets, the Time-varying parameter Vector Autoregression (TVP-VAR) of Antonakakis, Gabauer, Gupta and Plakandaras (2018) and Antonakakis, Chatziantoniou and Gabauer (2020) are specifically employed in this study. It integrates the work of Diebold and Yilmaz (2012) and Koop and Korobilis (2014) by incapacitating the burden of (a) losing precious observations, (b) arbitrarily rolling window size selection (which the study sets at 200) in most cases, and (c) sensitivity to outliers as indicated by Antonakakis, Chatziantoniou and Gabauer (2020). The TVP-VAR model of the lag length of order one indicated by the Bayesian information criterion (BIC) is estimated as
where, and
are
dimension vector, but
is of independent and identically distributed disturbance, and
and
denote
dimensional matrices.
and
are
dimensional vectors while
is a
dimensional matrix that demonstrates all available information until
. This model makes it possible for all parameters
and the relationship across series to fluctuate with time. It is worthy of note also that the variance-covariance matrices (
) fluctuate over time. This has been proved by a plethora of studies that variance-covariance are time-varying regarding the heterogenous nature of markets and their participants as well as investment risk in the context of financial markets.
Diebold and Ylmaz (2012) developed a connectedness approach based on Koop, Pesaran, Potter (1996) and Pesaran and Shin (1998)’s generalized impulse response functions (GIRF) and generalized forecast error variance decompositions (GFEVD), which are based on the time-varying coefficient and time-varying variance-covariance matrices retrieved from the TVP-VAR. As a result, the TVP-VAR must be translated into its vector moving average (VMA) representation using the Wold representation theorem, as shown below
where is a
dimensional matrix,
is
dimensional vector whereas
is an
dimensional matrix
As approaches
, taking the limit yields
following
where an dimensional matrix is
The reflect all variables’ responses to a shock in variable
. The differences between a K-step-ahead forecast where variable
is shocked and once where variable
is not shocked are computed because a non-structural model is used. The difference can be explained by the shock in variable
which can be estimated using the formula
where the forecast period is (which the study sets at 5 in line with prior literature),
denotes the selection vector, with one at the
location and zero elsewhere. After that, the
is generated, which can be translated as the forecast error variance sharing one variable explained on others. These variance shares are then normalized so that each row amounts to one, indicating that all variables together explain 100% of the
prediction error variance of the variable. This is worked out as follows
with and
First, total directional connectivity TO others is defined as, where variable
communicates its shock to all other variables
as
Second, the total directional connectedness FROM others, which is the shock variable receives from variables
, is estimated by
The NETtotal directional connectivity, which can be viewed as the influencing variable has on the investigated network, is produced by subtracting the total directional connection TO others from the total directional connectedness FROM others. In addition, the influence index (
) is calculated according to Greenwood-Nimmo, Nguyen and Shin (2015) as
If variable has a positive NET total directional connectivity, it suggests that it influences the network more than it is influenced by it. If the NET total directional connectedness is negative, on the other hand, the network is driving variable
. The
gives a measure that is normalized between 1 and +1 and can be understood in the same way. Finally, by computing the net pairwise directional connectedness (NPDC), the pairwise influence index (PII), and its absolute version (APII), the NET total directional connectedness is further broken down to investigate bidirectional interactions as
The determines whether variable
is driving or being driven by variable
, and the
standardizes the
to be between −1 and +1. The total connectedness index (TCI) is a tool for calculating market interconnectivity as shown
The fundamental issue with this metric is that determining what constitutes a high level of interconnection is subjective. It can be demonstrated using Monte Carlo simulations that the own variance shares are always bigger or equal to all cross variance shares. This suggests that the TCI is located between and not
, making interpretation problematic. To improve the TCI’s interpretability, it needs to be tweaked slightly as
The pairwise connectedness index () measures the interconnectivity between two variables
and
as a decomposed form of the
.
This metric, which runs from , depicts the degree of bilateral interconnectivity between variables
and
that are hidden by the
.
The credibility assumptions of the asymmetric shock and the financial assets are examined in this study utilising the and the
, respectively. The smaller the
and the higher the
, the more likely variables
and
are in the same
. Bootstrapping is used to calculate the average of each
measure and its confidence interval.
2.2. Data sources and description
The 16 daily implied volatility indices shown in Table were used. The 16 implied volatilities were selected because they comprise the volatility of various financial assets, such as conventional equities, commodities, and currencies, in national, regional, or worldwide indexes. As such, the chosen variables will provide in-depth understanding about the problem of contagion and interdependencies. The daily data employed in this study is also ideal to assess rapid oscillations in the dataset across economic events (Agyei et al., Citation2022; Asafo-Adjei, Owusu Junior et al., Citation2022; Ghosh & Bouri, Citation2022).
Table 1. Implied volatilities
After missing data were removed, the daily data, which cover the period from 5 August 2016 to 18 August 2021, yielding 1758 observations. The sample period incorporates economic events like the Eurozone crisis, BREXIT, US-China trade tension, COVID-19 epidemic, the drop in the price of crude oil, etc. These dynamics cause excess fluctuations in the dataset. Hence, a time-varying technique (TVP-VAR) that solves the problems of; lose of precious observations, arbitrarily rolling window size selection in most cases, and sensitivity to outliers as indicated by Antonakakis, Chatziantoniou and Gabauer (2020) is employed in this study. This study’s supporting data were gleaned from the investing.com database. The information was processed using daily logarithmic returns.
Figure presents time varying plots of both prices and returns series for the 16 implied volatilities. A glance at Figure indicates a spike of the implied volatilities during 2016 and 2020 marking pertinent shocks from BREXIT and COVID-19 pandemic respectively with the latter casting the most shock. Conversely, a strong rebound is expected for the historical markets returns by observing a plunge in most of the implied volatilities to take their usual trend prior to the pandemic. The rising trend in GVN demonstrates a stronger expectation of volatility within the NASDAQ 100 casting doubts about the latter’s future prospects. The returns series are noticeable to exhibit volatility clustering confirming the stylized facts of financial time series.
Figure 1. Price and returns series of volatility indices.
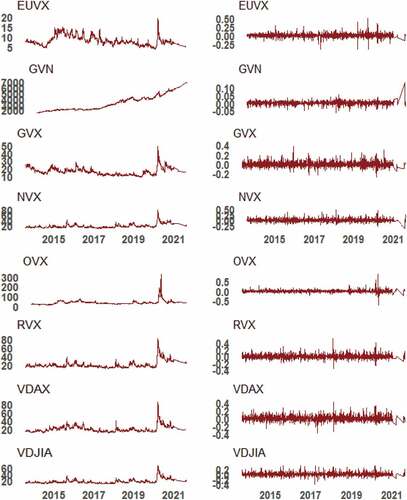
Figure 1. (Continued).
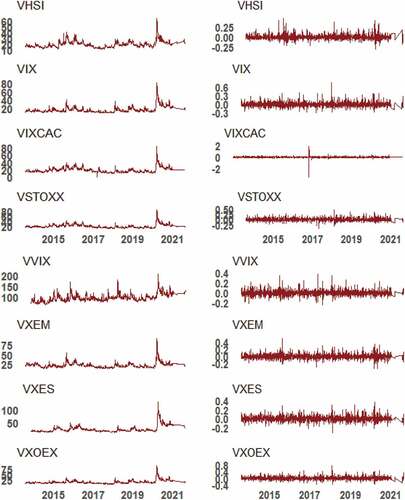
Table presents the descriptive statistics for the implied volatilities. Almost all the implied volatilities yield positive mean returns. The EUVX and GVX representing implied volatilities respectively for the Euro Currency and Gold yield negative average returns. Less variations in the returns series can be observed with closer to symmetry except for VIXCAC. All the returns series exhibit a leptokurtic distribution, and hence, their distributions can be confirmed by the Jarque–Bera statistic to be nonnormal. Nonetheless, the Kwiatkowski–Phillips–Schmidt–Shin (KPSS) test with a null hypothesis of stationarity is not rejected (p-value > 0.05) demonstrating a stationary returns series.
Table 2. Descriptive tests
3. Results and discussion
Table shows the average total connectedness in the network of implied volatilities. It is illustrative from Table that each row agrees with the contribution of individual implied volatility to the forecast error variance of diverse implied volatilities in the developed system. Conversely, columns correspond to the forecast error variance with which several implied volatilities add to each market distinctly. Additionally, the main diagonal elements can be linked to idiosyncratic effects whereas off-diagonal elements are contributions demonstrating either “From” or “To” other implied volatilities.
Table 3. Average total connectedness
The TCI value of 79.63% from Table depicts that the network of the 16 implied volatilities demonstrates the degree to which the developments within the network itself to a greater extent is elucidated. Hence, idiosyncratic effects account for approximately 20% of the forecast error variance of the system of implied volatilities. It must be noted that futures contracts in these markets tend to comove to a larger degree.
It is implicative from Table that EUVX, GVN, GVX, OVX, VDAX, VHSI, VIXCAC and VSTOXX are net receivers of shocks (i.e. on a net average, are influenced by others rather than influencing others). Contrarily, NVX, RVX, VDJIA, VIX, VVIX, VXEM, VXES and VXOEX are net transmitters of shocks. The most crucial net receivers include; VHSI, OVX, EUVX, GVX, and VIXCAC whilst that of net transmitters are VIX, NVX, VXOEX and VDJIA. The dominance of the US VIX in transmitting shocks to other implied volatilities confirms the study of Del Castillo Olivares et al. (Citation2018). For a more useful portfolio strategy and asset allocation it is important to mix most of the net receiving assets with net transmitting ones considering the risk tolerance and investment objectives of investors. Categorically, with the rising impact of most financial assets on others arousing contagion effects in times of crises, a usual investment strategy would be to relentlessly search for net receiving assets as a yardstick to hedge against shocks from other assets (Bossman, Adam et al., 2022). This argues for the reason why it is better to receive than to give (transmit).
Figure presents the time varying connectedness among the implied volatilities in the light of specific economic events. This is illustrated by the dashed lines within the evolution of the TCI over time. Fluctuations in the dynamic connectedness confirms that the value of the TCI changes across the study’s sample period taking on relatively large values with peaks that lie above 85% and trough that occurs beyond 70%. This instructs that there exists large TCI values across time generally revealing interdependencies as revealed by Liu et al. (Citation2020) and Bouri et al. (Citation2020).
Figure 2. Dynamic total connectedness of volatility indices.
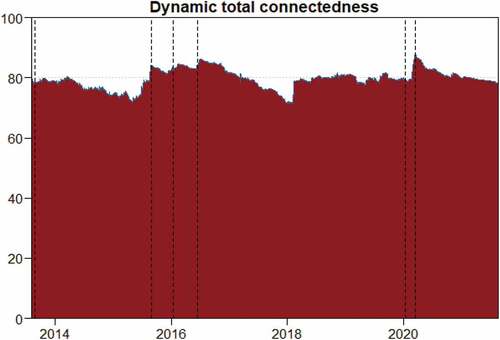
However, some interdependencies rather demonstrate contagion effects regarding a rise in the degree of connectedness right after the inception of a crises. This can be revealed from Figure in many ways. To begin with, it is observable that comovements rose during the peak of the Eurozone Migrant in September 2015. Few months after, there was a rise in spillover connectedness spanning the China crash period in January 2016. In the middle of 2016 marking adjustment of the BREXIT, a surge in the dynamic connectedness is noticeable. Finally, the peak of the COVID-19 pandemic in March 2020, which casted significant doubt about the future of most financial markets recorded the most contagion effect among the network of implied volatilities as found by Wang et al. (Citation2022). Hence, the 16 implied volatilities are responsive to serious economic events, and further capture faster the dynamics of contagion among markets (Maghyereh et al., Citation2016; Peng & Ng, Citation2012). This is supported by prior studies such as Adekoya and Oliyide (), Çelik et al. (Citation2022), and Thanh et al. (Citation2022), to mention a few.
It is instructive that a more useful and specific portfolios, assets allocation, rebalancing and redeployment strategies are carefully developed regarding the risk tolerance and objectives of investors. During these periods, the degree to which the implied volatilities could respond as safe haven assets is relevant for investors, policymakers, risk and portfolio managers. This is subsequently addressed.
We present the directional connectedness of each volatility index to the remaining implied volatilities in Figure . Implied volatilities such as RVX, NVX and VIX are nearly without any kind of change across time transmitting shocks beyond 100% interdependence. Conversely, EUVX, OVX, GVX, VHSI and VXCAC recorded the least transmitters of shocks over time. Particularly considering the COVID-19 pandemic period, contagion is noticeable with shocks from implied volatilities such as EUVX, OVX, GVX, VDAX, VHSI, VXEM, VIXCAC, and VSTOXX. This is also evident for some crises periods indicated by the dashed lines. It must be noted that, a rise in connectedness at benign market conditions demonstrates interdependence rather than contagion. This can be found in assets such as EUVX, GVN, VHSI, VVIX, GVX, VXES and VXOES occurring between 2017 and 2019.
Figure 3. Directional connectedness of volatility returns to others.
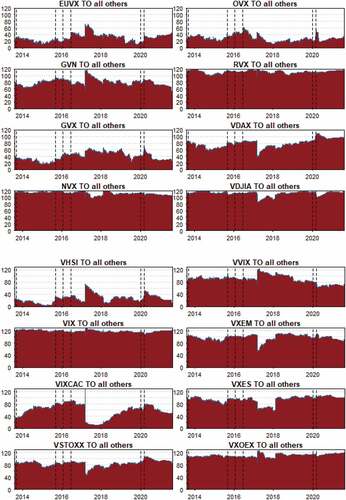
The strongest potential transmitters depicting stronger degree of interdependence or contagion may less likely offer hedge or safe haven benefits considering the market situations. Hence, observance of these assets (RVX, NVX and VIX) alone, may not warrant portfolio risk minimization. It becomes prudent for investors to relentlessly search for competing risks and rewards by having knowledge of assets such as EUVX, OVX, GVX, VDAX, VHSI, VXEM, VIXCAC, and VSTOXX. These assets are either uncorrelated or possibly, negatively correlated—save for net directional connectedness—with their implied volatility counterparts and are expected to retain or appreciate value in the event of a market crash.
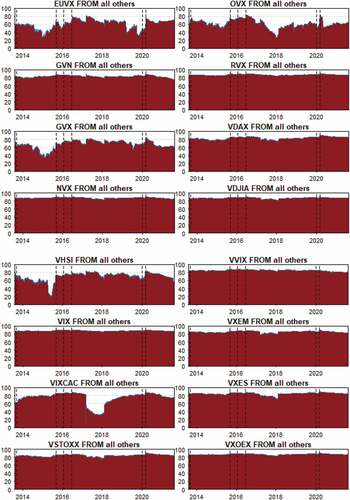
Having investigated directional connectedness to other implied volatilities, we further consider directional connectedness from other implied volatilities in Figure . This is important to examine whether strong transmitters of shocks are either strong or weak receivers. A glance at Figure indicates that aside EUVX, OVX, GVX and VHSI with connectedness below 80%, the remaining implied volatilities receive strong persisting shocks. It goes to reason that EUVX, OVX, GVX and VHSI are uncorrelated by observing their weak transmitting and receiving dynamics relative to the remaining implied volatilities. There are also assets that receive more shocks than what they give out, for instance, VDAX, VXEM, VIXCAC, and VSTOXX. Moreover, all the strongest transmitters are analogous receivers (RVX, NVX and VIX).
Figure 4. Directional connectedness of volatility returns from others.
After probing into the fundamental features of the implied volatilities regarding their transmitting and receiving capacities, we delve into their net responses to make valid portfolio strategies and assets allocation decisions. This is presented in Figure as net directional connectedness. The classification shown in Figure reveals net transmitting (positive values) and net receiving (negative values) implied volatilities. Hence, allowing a shift between the roles as found from Figures . We assess whether an implied volatility assumes (i) a persistent role—either net transmitting or net receiving in the system over time—(ii) assumes intermittently a net transmitting and net receiving role which can be further classified as geared toward either net transmitting or net receiving. Generally, since net receiving assets demonstrate negative correlations, they offer safe haven benefits in times of serious economic shocks or downturn, address the fact that it is better to receive than to give. We take significant insights from net persisting receivers to address effective portfolio diversification, hedge or safe haven sequel to the market conditions. Nonetheless, having knowledge of net persisting transmitters is relevant for portfolio redeployment or rebalancing.
Figure 5. Net directional connectedness among volatility returns.
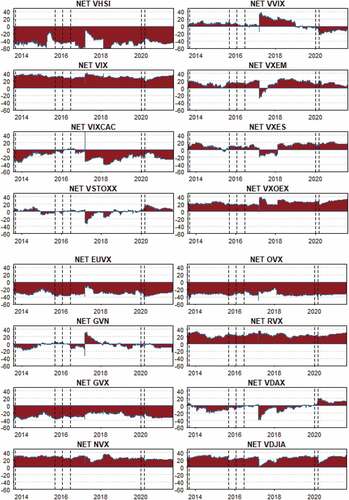
It is noticeable from Figure that EUVX, OVX, GVX, VHSI, and possibly, VIXCAC are net persisting receivers. Findings on OVX in the system of implied volatilities deviate that of Maghyereh et al. (Citation2016) and Balcilar et al. (Citation2021) when historical returns on crude oil was utilised. Bouri et al. (Citation2017) in addition revealed that in a network of OVX< GVN and Indian stock market, OVX and GVX had a spillover effect on implied volatility of the Indian stock market. Moreover, as Thanh et al. (Citation2022), Awartani et al. (Citation2016), and Dutta (Citation2018) found that historical returns from both crude and gold act as relevant net transmitters, we revealed that in a network of implied volatilities, their forward looking proxy (OVX and GVX) rather serve as net receivers.
On the other hand, RVX, NVX, VDJIA, VIX and VXOEX are net persistent transmitters of shocks into the systems. The net persistent transmitting role of the US VIX has been confirmed by prior studies to gauge fear among other financial assets (see, Del Castillo Olivares et al., Citation2018; Boateng et al., Citation2021; Owusu Junior, Adam et al., Citation2021; Asafo-Adjei, Frimpong et al., Citation2022; Amoako et al., Citation2022; Alsubaie et al., Citation2022).
The rest of the implied volatilities assume both roles over time with either net transmitting or net receiving dominating. Accordingly, the tendency to which implied volatilities induce future idiosyncratic risks to capture investor sentiments about future expectations of price movements (Badshah et al., 2018; Boateng et al., 2021; Asafo-Adjei, Frimpong et al., Citation2022) should be critically observed considering shocks they transmit or receive among the system of implied volatilities. Except for some few net directional connectedness that reveal contagion in the COVID-19 pandemic, for instance, EUVX, VDAX, VVIX and VSTOXX, the other implied volatilities are responsive to interdependencies.
4. Conclusion
In this study, we examined the dynamic connectedness among 16 implied volatilities across time while taking note of the impact of economic events using the TVP-VAR as the estimation technique. Additionally, the study revealed the extent of either contagion or interdependencies in the system of implied volatilities connectedness addressing heterogeneity and adaptability regarding financial markets’ inefficiencies.
It was revealed that the employed implied volatilities were highly connected to a degree of approximately 79.63%. Notwithstanding, dynamic connectedness varies across time addressing the HMH (Müller et al., Citation1997), AMH (Lo, Citation2004) and CMH (Owusu Junior, Frimpong et al., Citation2021). We found reasonable evidence to support contagion effects spanning economic events such as the peak of the Eurozone Migrant in September 2015, the China crash period in January 2016, BREXIT adjustment in the middle of 2016, and finally, the peak of the COVID-19 pandemic in March 2020 in the system of the 16 implied volatilities. Also, a rise in connectedness was revealed at non-crisis periods demonstrating that interdependencies exist among them.
Outcome from the directional connectedness indicated that implied volatilities such as RVX, NVX and VIX transmits similar shocks as they receive. Assets such as EUVX, OVX, GVX and VHSI received excess shocks relative to what they gave out. Nonetheless, it was further revealed that implied volatilities such as EUVX, OVX, GVX, VHSI, and possibly, VIXCAC were net persisting receivers. Hence, these assets would most likely warrant a portfolio of implied volatilities to retain or increase in value with the minimum possible risk during market crash. Conversely, we documented that RVX, NVX, VDJIA, VIX and VXOEX are better for implied volatilities achieving financial integration which facilitate the redeployment or rebalancing of portfolios. Generally, estimates of the size and direction of net connectedness succours investors to pair EUVX, OVX, GVX and VHSI with RVX, NVX, VDJIA, VIX and VXOEX for diversification in crises periods.
We recommend that investors, portfolio managers and risk managers should formulate portfolio and assets allocation strategies across time considering implied volatilities such as; EUVX, OVX, GVX and VHSI. Investors and policymakers of the Hang Seng Index (HSI) should be mindful of the shocks received by its expected index (VHSI) since the latter predicts a 30-day movement of the former. Hence, the connectedness between the HSI and VHSI should be observed across time to examine the extent of portfolio diversification. This would serve as a warning to investors of the HSI because having knowledge of the VHSI does not only gauge fear emanating from the sentiment of its traders but also presents more uncertainty considering shocks from other implied volatilities. Likewise, investors of the Euro area should be wary of the shocks received by the EUVX in their portfolio and assets allocation strategy decisions. Moreover, it becomes pertinent to incorporate expectations of the two most important commodities—crude oil and gold, as part of a portfolio considering their longstanding portfolio risk minimization. Policymakers should monitor the trajectories of implied volatilities across time to track the progress of prevailing crises to suggest early warnings to support the regulation of the securities markets.
The study is limited to investigating time varying perspective of the implied volatilities without considering the role of investment horizons of short, medium, and long terms. Further studies can utilize decomposition techniques in tandem with the TVP-VAR to observe connectedness across time and frequency.
Disclosure statement
No potential conflict of interest was reported by the author(s).
Data availability statement
Data used in support of this study is available upon request.
Additional information
Funding
References
- Adekoya, O. B., & Oliyide, J. A. (2021). How COVID-19 drives connectedness among commodity and financial markets: Evidence from TVP-VAR and causality-in-quantiles techniques. Resources Policy, 70, 101898. https://doi.org/10.1016/j.resourpol.2020.101898
- Agyei, S. K., Owusu Junior, P., Bossman, A., Asafo-Adjei, E., Asiamah, O., Adam, A. M., & Ghoshray, A. (2022). Spillovers and contagion between BRIC and G7 markets: New evidence from time-frequency analysis. PloS One, 17(7), e0271088. https://doi.org/10.1371/journal.pone.0271088
- Alsubaie, S. M., Mahmoud, K. H., Bossman, A., Asafo-Adjei, E., & Gherghina, S. C. (2022). Vulnerability of sustainable Islamic stock returns to implied market volatilities: An asymmetric approach. Discrete Dynamics in Nature and Society, 2022, 1–20. https://doi.org/10.1155/2022/3804871
- Amoako, G. K., Asafo-Adjei, E., Mintah Oware, K., Adam, A. M., & Gherghina, S. C. (2022). Do volatilities matter in the interconnectedness between world energy commodities and stock markets of BRICS? Discrete Dynamics in Nature and Society, 2022, 1–13. https://doi.org/10.1155/2022/1030567
- Archer, C., Junior, P. O., Adam, A. M., Asafo-Adjei, E., & Baffoe, S. (2022). Asymmetric dependence between exchange rate and commodity prices in Ghana. Annals of Financial Economics, 17(2), 2250012. https://doi.org/10.1142/S2010495222500129
- Asafo-Adjei, E., Adam, A. M., Arthur, C. L., Seidu, B. A., & Gyasi, R. M. (2022). Similarities among equities returns in multi-frequencies: Insights from sustainable responsible investing. Journal of Sustainable Finance & Investment, 1–23. https://doi.org/10.1080/20430795.2022.2112141
- Asafo-Adjei, E., Adam, A. M., & Darkwa, P. (2021). Can crude oil price returns drive stock returns of oil producing countries in Africa? Evidence from bivariate and multiple wavelet. Macroeconomics and Finance in Emerging Market Economies, 1–19. https://doi.org/10.1080/17520843.2021.1953864
- Asafo-Adjei, E., Boateng, E., Isshaq, Z., Idun, A. A. A., Owusu Junior, P., & Adam, A. M. (2021). Financial sector and economic growth amid external uncertainty shocks: Insights into emerging economies. PLoS One, 16(11), e0259303. https://doi.org/10.1371/journal.pone.0259303
- Asafo-Adjei, E., Frimpong, S., Owusu Junior, P., Adam, A. M., Boateng, E., & Ofori Abosompim, R. (2022). Multi-frequency information flows between global commodities and uncertainties: Evidence from COVID-19 pandemic. Complexity, 2022. https://doi.org/10.1155/2022/6499876
- Asafo-Adjei, E., Owusu Junior, P., & Adam, A. M. (2021). Information flow between global equities and cryptocurrencies: A VMD-based entropy evaluating shocks from COVID-19 pandemic. Complexity, 2021. https://doi.org/10.1155/2021/4753753
- Awartani, B., Aktham, M., & Cherif, G. (2016). The connectedness between crude oil and financial markets: Evidence from implied volatility indices. Journal of Commodity Markets, 4(1), 56–69. https://doi.org/10.1016/j.jcomm.2016.11.002
- Balcilar, M., Gabauer, D., & Umar, Z. (2021). Crude oil futures contracts and commodity markets: New evidence from a TVP-VAR extended joint connectedness approach. Resources Policy, 73, 102219. https://doi.org/10.1016/j.resourpol.2021.102219
- Barson, Z., Junior, P. O., Adam, A. M., & Asafo-Adjei, E. (2022). Connectedness between gold and cryptocurrencies in COVID-19 pandemic: A frequency-dependent asymmetric and causality analysis. Complexity, 2022. https://doi.org/10.1155/2022/7648085
- Bekaert, G., Ehrmann, M., Fratzscher, M., & Mehl, A. (2014). The global crisis and equity market contagion. The Journal of Finance, 69(6), 2597–2649. https://doi.org/10.1111/jofi.12203
- Boateng, E., Asafo-Adjei, E., Addison, A., Quaicoe, S., Yusuf, M. A., Adam, A. M., & Adam, A. M. (2022). Interconnectedness among commodities, the real sector of Ghana and external shocks. Resources Policy, 75, 102511. https://doi.org/10.1016/j.resourpol.2021.102511
- Boateng, E., Owusu Junior, P., Adam, A. M., Abeka, M., Jr, Qabhobho, T., & Asafo-Adjei, E. (2022). Quantifying information flows among developed and emerging equity markets. Mathematical Problems in Engineering, 2022. https://doi.org/10.1155/2022/2462077
- Bouri, E., Jain, A., Biswal, P. C., & Roubaud, D. (2017). Cointegration and nonlinear causality amongst gold, oil, and the Indian stock market: Evidence from implied volatility indices. Resources Policy, 52, 201–206. https://doi.org/10.1016/j.resourpol.2017.03.003
- Bouri, E., Lucey, B., & Roubaud, D. (2020). Dynamics and determinants of spillovers across the option-implied volatilities of US equities. The Quarterly Review of Economics and Finance, 75, 257–264. https://doi.org/10.1016/j.qref.2019.03.008
- Brunnermeier, M. K., & Pedersen, L. H. (2009). Market liquidity and funding liquidity. The Review of Financial Studies, 22(6), 2201–2238. https://doi.org/10.1093/rfs/hhn098
- Çelik, İ., Sak, A. F., Höl, A. Ö., & Vergili, G. (2022). The dynamic connectedness and hedging opportunities of implied and realized volatility: Evidence from clean energy ETFs. The North American Journal of Economics and Finance, 60, 101670. https://doi.org/10.1016/j.najef.2022.101670
- Cheuathonghua, M., Padungsaksawasdi, C., Boonchoo, P., & Tongurai, J. (2019). Extreme spillovers of VIX fear index to international equity markets. Financial Markets and Portfolio Management, 33(1), 1–38. https://doi.org/10.1007/s11408-018-0323-6
- Del Castillo Olivares, A. F., Kumiega, A., Sterijevski, G., & Van Vliet, B. (2018). An empirical study of volatility spillover worldwide. Wilmott, 2018(95), 48–59. https://doi.org/10.1002/wilm.10675
- Dutta, A. (2018). A note on the implied volatility spillovers between gold and silver markets. Resources Policy, 55, 192–195. https://doi.org/10.1016/j.resourpol.2017.11.017
- Forbes, K., & Rigobon, R. (2001). Measuring contagion: Conceptual and empirical issues. In Kristin J. F. (Ed.) International financial contagion (pp. 43–66). Springer. https://doi.org/10.1007/978-1-4757-3314-3_3
- Garvey, J. F., & Gallagher, L. A. (2012). The realised–implied volatility relationship: Recent empirical evidence from FTSE‐100 stocks. Journal of Forecasting, 31(7), 639–660. https://doi.org/10.1002/for.1244
- Ghosh, B., & Bouri, E. (2022). Long memory and fractality in the universe of volatility indices. Complexity, 2022. https://doi.org/10.1155/2022/6728432
- Grillini, S., Ozkan, A., & Sharma, A. (2022). Static and dynamic liquidity spillovers in the Eurozone: The role of financial contagion and the Covid-19 pandemic. International Review of Financial Analysis, 83, 102273. https://doi.org/10.1016/j.irfa.2022.102273
- Ji, Q., Bouri, E., & Roubaud, D. (2018). Dynamic network of implied volatility transmission among US equities, strategic commodities, and BRICS equities. International Review of Financial Analysis, 57, 1–12. https://doi.org/10.1016/j.irfa.2018.02.001
- King, M. A., & Wadhwani, S. (1990). Transmission of volatility between stock markets. The Review of Financial Studies, 3(1), 5–33. https://doi.org/10.1093/rfs/3.1.5
- Lee, H. S., & Kim, T. Y. (2022). A new analytical approach for identifying market contagion. Financial Innovation, 8(1), 1–35. https://doi.org/10.1186/s40854-022-00339-4
- Liu, Z., Tseng, H. K., Wu, J. S., & Ding, Z. (2020). Implied volatility relationships between crude oil and the US stock markets: Dynamic correlation and spillover effects. Resources Policy, 66, 101637. https://doi.org/10.1016/j.resourpol.2020.101637
- Lo, A. W. (2004). The adaptive markets hypothesis. The Journal of Portfolio Management, 30(5), 15–29. https://doi.org/10.3905/jpm.2004.442611
- Maghyereh, A. I., Awartani, B., & Bouri, E. (2016). The directional volatility connectedness between crude oil and equity markets: New evidence from implied volatility indexes. Energy Economics, 57, 78–93. https://doi.org/10.1016/j.eneco.2016.04.010
- Mensi, W., Hammoudeh, S., & Kang, S. H. (2017). Risk spillovers and portfolio management between developed and BRICS stock markets. The North American Journal of Economics and Finance, 41, 133–155. https://doi.org/10.1016/j.najef.2017.03.006
- Mishra, A. K., & Ghate, K. (2022). Dynamic connectedness in non-ferrous commodity markets: Evidence from India using TVP-VAR and DCC-GARCH approaches. Resources Policy, 76, 102572. https://doi.org/10.1016/j.resourpol.2022.102572
- Mullainathan, S. (1998). A memory based model of bounded rationality mimeo.
- Müller, U. A., Dacorogna, M. M., Davé, R. D., Olsen, R. B., Pictet, O. V., & Von Weizsäcker, J. E. (1997). Volatilities of different time resolutions—analyzing the dynamics of market components. Journal of Empirical Finance, 4(2–3), 213–239. https://doi.org/10.1016/S0927-5398(97)00007-8
- Müller, U. A., Dacorogna, M. M., Davé, R. D., Pictet, O. V., Olsen, R. B., & Ward, J. R. (1993). Fractals and intrinsic time: A challenge to econometricians. Unpublished manuscript, Olsen & Associates, Zürich, 130.
- Nkrumah-Boadu, B., Owusu Junior, P., Adam, A., & Asafo-Adjei, E. (2022). Safe haven, hedge and diversification for African stocks: Cryptocurrencies versus gold in time-frequency perspective. Cogent Economics & Finance, 10(1), 2114171. https://doi.org/10.1080/23322039.2022.2114171
- Obeng, C. K., Frimpong, S., Amoako, G. K., Agyei, S. K., Asafo-Adjei, E., Adam, A. M., & Yang, X. (2022). Asymmetric exchange rate pass-through to consumer prices in Ghana: Evidence EMD-NARDL approach. Journal of Mathematics, 2022, 1–8. https://doi.org/10.1155/2022/9075263
- Owusu Junior, P., Adam, A. M., Asafo-Adjei, E., Boateng, E., Hamidu, Z., & Awotwe, E. (2021). Time-frequency domain analysis of investor fear and expectations in stock markets of BRIC economies. Heliyon, 7(10), e08211. https://doi.org/10.1016/j.heliyon.2021.e08211
- Owusu Junior, P., Frimpong, S., Adam, A. M., Agyei, S. K., Gyamfi, E. N., Agyapong, D., & Tweneboah, G. (2021). COVID-19 as information transmitter to global equity markets: Evidence from CEEMDAN-based transfer entropy approach. Mathematical Problems in Engineering, 2021. https://doi.org/10.1155/2021/8258778
- Peng, Y., & Ng, W. L. (2012). Analysing financial contagion and asymmetric market dependence with volatility indices via copulas. Annals of Finance, 8(1), 49–74. https://doi.org/10.1007/s10436-011-0181-y
- Qabhobho, T., Asafo-Adjei, E., Junior, P. O., & Adam, A. M. (2022). Quantifying information transfer between commodities and implied volatilities in the energy markets: A multi-frequency approach. International Journal of Energy Economics and Policy, 12(5), 472–481. https://doi.org/10.32479/ijeep.13403
- Sarwar, G. (2020). Interrelations in market fears of US and European equity markets. The North American Journal of Economics and Finance, 52, 101136. https://doi.org/10.1016/j.najef.2019.101136
- Smimou, K., & Khallouli, W. (2015). Does the Euro affect the dynamic relation between stock market liquidity and the business cycle? Emerging Markets Review, 25, 125–153. https://doi.org/10.1016/j.ememar.2015.07.001
- Thanh, T. T., Linh, V. M., & Linh, V. M. (2022). An exploration of sources of volatility in the energy market: An application of a TVP-VAR extended joint connected approach. Sustainable Energy Technologies and Assessments, 53, 102448. https://doi.org/10.1016/j.seta.2022.102448
- Toparlı, E. A., Çatık, A. N., & Balcılar, M. (2019). The impact of oil prices on the stock returns in Turkey: A TVP-VAR approach. Physica A: Statistical Mechanics and Its Applications, 535, 122392. https://doi.org/10.1016/j.physa.2019.122392
- Troster, V., Bouri, E., & Roubaud, D. (2019). A quantile regression analysis of flights-to-safety with implied volatilities. Resources Policy, 62, 482–495. https://doi.org/10.1016/j.resourpol.2018.10.004
- Wagner, N., & Szimayer, A. (2004). Local and spillover shocks in implied market volatility: Evidence for the US and Germany. Research in International Business and Finance, 18(3), 237–251. https://doi.org/10.1016/j.ribaf.2004.04.008
- Wang, Z., Bouri, E., Ferreira, P., Shahzad, S. J. H., & Ferrer, R. (2022). A grey-based correlation with multi-scale analysis: S&P 500 VIX and individual VIXs of large US company stocks. Finance Research Letters, 48, 102872. https://doi.org/10.1016/j.frl.2022.102872
- Wen, F., Zhang, M., Deng, M., Zhao, Y., & Ouyang, J. (2019). Exploring the dynamic effects of financial factors on oil prices based on a TVP-VAR model. Physica A: Statistical Mechanics and Its Applications, 532, 121881. https://doi.org/10.1016/j.physa.2019.121881
- Yıldırım, H. (2022). VIX or ınvestors scare? Quality & Quantity, 56(2), 769–777. https://doi.org/10.1007/s11135-021-01153-3
- Yu, J. W., Xie, W. J., & Jiang, Z. Q. (2018). Early warning model based on correlated networks in global crude oil markets. Physica A: Statistical Mechanics and Its Applications, 490, 1335–1343. https://doi.org/10.1016/j.physa.2017.08.046
- Zhang, H., & Giouvris, E. (2022). Measures of volatility, crises, sentiment and the role of US ‘Fear’Index (VIX) on herding in BRICS (2007–2021). Journal of Risk and Financial Management, 15(3), 134. https://doi.org/10.3390/jrfm15030134