?Mathematical formulae have been encoded as MathML and are displayed in this HTML version using MathJax in order to improve their display. Uncheck the box to turn MathJax off. This feature requires Javascript. Click on a formula to zoom.
ABSTRACT
The use of environmental taxes can encourage a shift toward eco-friendly choices. When used in conjunction with other policy tools available, environmental taxes can help bring about the adjustments needed in order to address our current environmental and climate challenges. Therefore the objective of this study was to examine the impact of environmental taxes on energy consumption and energy intensity using panel data covering the period 1995–2014 from 35 OECD countries. I employed environmental tax to total tax ratio, total energy consumption, and total energy intensity to estimate the relation between energy consumption and environmental taxes. Using the fully modified and dynamic OLS techniques and I showed that environmental taxes have a negative effect on energy consumption and energy intensity in the long run. Furthermore, using the Dumitrescu and Hurlin’s panel granger causality test I found a bi-directional long-run causality between environmental taxes and energy consumption and intensity. With regards to the disaggregated effect of environmental taxes, this study found that energy taxes (including CO2 taxes) have a larger effect on energy consumption and energy intensity than pollution and transport taxes. To test for the robustness and sensitivity of my model, I resorted to the total environmental tax to GDP ratio and employed both GMM and quantile regressions. Thus, I concluded that environmental taxes have a significant impact on energy consumption and energy intensity among OECD member countries.
1. Introduction
Environmental challenges have become rampant over the last decades. According to researchers (Sintayehu, Citation2018 & Bellard, Citation2012) climate change will accelerate biodiversity loss by affecting natural environments, plants and animals in some regions. These impacts will affect many communities and sectors that rely on natural resources, including agriculture, fishing, energy, tourism, and water. Due to this, climate and the environment are receiving more international attention. Climate change has been one of the most significant environmental threat to living organisms. For instance, the rising global average temperature from 1.1 °C to 2 °C has prompted the need to keep the increase to a limit of 1.5 °C as stipulated by the Paris Agreement. Thus, the need to reduce the emission of greenhouse gases has seen a strong global campaign among international organisations like the International Monetary Fund (IMF) and other environmental organisations (UNDP, Citation2018).
Within the past few decades, OECD countries have made considerable progress in tackling a variety of environmental issues. In addition to reducing pollution from industrial sources, increasing the number and size of natural protected areas, phasing out many ozone depleting substances, and improving the efficiency of water and energy use per unit of GDP, environmental protection has largely been successful so far. Inspite of the effort made by the OECD and non-OECD in fighting environmental problems there is no end in sight (OECD, Citation2019). According to Abdullah and Morley (Citation2014) climate change mitigation will be more attractive if it simultaneously meets a number of other important societal goals, such as clean air, enhanced public health, and enhanced access to energy through distributed renewable energy generation. In effect, defeating the adverse effects of environmental issues calls for effective environmental regulation and initiatives aimed at reducing carbon dioxide (CO2) emissions, such as those outlined in the Kyoto Protocol (Abdullah & Morley, Citation2014).
Environmental regulations and taxes are considered fundamental driving forces of climate change policies to improve energy efficiency and mitigate environmental problems. Governments have numerous green policy tools to mitigate climatic or environmental challenges, including regulations, information programmes, innovation policies, and environmental subsidies (Organisation for Economic Co-operation and Development OECD, Citation2011). On the contrary, command and regulatory policies and environmental fees have proven inefficient instruments to reduce environmental damages (Baumol & Oates, Citation1988). For instance, OECD (Citation2011) and Bailey (Citation2002) argued that such complex arrangements (standards, bans, etc.) are authoritative and both environmentally and economically inefficient because they incentivize polluters to exceed standards while increasing compliance costs. Furthermore, they do not provide drivers for actions beneficial to the environment below the policy level.
Some studies argued that since the Pigouvian era (1932), efforts on institutionalizing environmental policy were achieved through the imposition of taxes and subsidies. Thus, fixing a price for the use of environmental resources ensures that economic decisions are considered (CCICED, Citation2009 & OECD, Citation2011). One compares abatement costs to using these resources and, consequently, may avoid potential environmentally harmful behaviour. For instance, many environmentally related taxes contribute to environmental improvements by causing price increases that reduce the demand for environmentally harmful products (OECD, Citation2006).
Environmental tax is an important policy instrument that can ensure that part, if not all, of the cost of externality and environmental cost, is internalised into the national economic-decision-making discus (Labeaga & Labandeira, Citation2019). Environmental taxes also ensures that polluters manage their production and consumption in such a way as to ensure pollution costs are considered when making production and consumption decisions (Labeaga & Labandeira,Citation2019).
In recent years, such taxes have been recognized as essential to promoting the transition to a sustainable economy and as a cost-effective corrective measure to encourage the adoption of clean technologies. Environmental taxes can address most environmental problems (Labeaga & Labandeira, Citation2019). According to the OECD (Citation2010), like many other objectives of taxation, environmental taxes have been successfully used to address a wide range of issues, including waste disposal, water pollution and air emissions.
It appears that the determination of the macroeconomic impact of environmental taxes depends on the design of the environmental taxes as well as the political economy considerations in their implementation (OECD, Citation2010). OECD member countries have consistently relied on environment-related taxes to stimulate consumption and internalise environmental costs. Environmental taxes have been a core area of the OECD’s work for many years. Between 1999 and 2000, it examined environmentally-related taxes in member countries and produced a report on environment-related taxes in force in the region. Over the past decade, most OECD countries have introduced environmental taxes in various forms, with an increasing number implementing comprehensive green-tax reforms, while others are considering it (OECD, Citation2019). For instance, in Germany, a great deal of controversy has surrounded the German Ecological Tax Reform since 1999. However, despite being an effective tool for reducing CO2 emissions, stimulating employment, and stimulating innovation, the Ecological Tax Reform is still heavily criticized or outright rejected, mainly due to its likely impact on economic competitiveness (Knigge, Citation2005).
Apart from the special role that environmental taxes play in protecting and improving the environment, they also serve to raise revenue. Besides funding future sustainable energy initiatives, revenues are also redistributed in other ways. For example, environmental taxes account for an average of 6.7% of total tax revenues and 2% of GDP in OECD countries in 2020 (Revenue statistics, OECD, Citation2020). It is worth noting that government revenues from environmental taxes vary widely across countries, ranging from 0.7 per cent of GDP to 1.9 per cent in the United States and 4.5 per cent of GDP in Slovenia (OECD, Citation2020). According to Enache (Citation2020, September), revenues from environmentally-related taxes have steadily declined over the past 21 years, despite continuous efforts to reform the tax base (see, Figure ). Environmental taxes brought in 2.3 per cent of gross domestic product (GDP) in 2017, which is less than the 2.4 per cent increase in 2000 and 2010 (see, Figure ). Environmental tax participation has declined due to volatile gasoline prices that have triggered substitution away from such fuels (OECD, Citation2015; see, Figure ). Since environmental taxes have a tremendous impact, many studies have examined these taxes’ efficiency and distributional effects (Hajko, Citation2013; Borozan, Citation2019).
Figure 1. Revenue from environmental taxes in the OECD 1994–2019, as a percentage of GDP and as a percentage of total tax revenue.
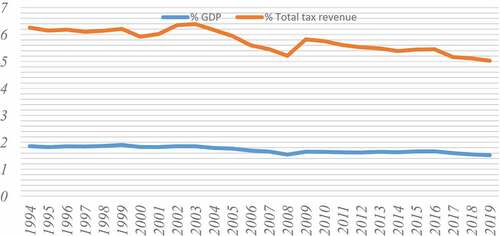
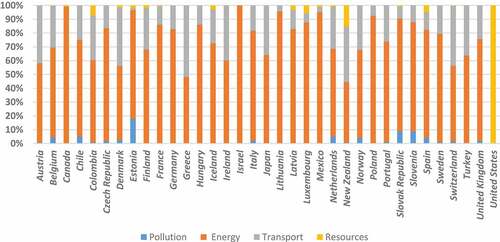
Figure 2. Composition of environmentally related tax revenue in OECD countries in 2019.
In addition, environmental taxes have affected economic agents by influencing the consumption of fossil fuels and other pollution-intensive goods. Energy consumption and energy intensity are the most popular indicators in energy policy debates used as climate change and energy efficiency measures (Bashir et al., Citation2021). According to Hajko (Citation2013), energy intensity refers to the total thermal aggregate of energy consumption per unit of GDP, while energy consumption is the direct use of all forms of energy at source or supply to users without transformation” (Burnett & Madariaga, Citation2017).
Among OECD countries, the need to reduce fossil fuel consumption and energy intensity is emphasised in order to achieve sustainable development. However, to ensure the success of such a goal, it is necessary to study the significant impact of environmentally related taxes on energy consumption and intensity. While some studies (Cadoret & Padovano, Citation2016; Paquet,2012 & Chang, Citation2015) suggest that environment-related taxes such as energy taxes lead to a reduction in energy consumption and carbon emissions, other studies (Liobikienė et al., Citation2019, Butkus &Matuzevičiūtė) contradict these findings. Although there is ample evidence in energy policy studies on the relationship between environmental taxes, energy consumption and energy intensity in developed and developing countries (Bashir et al., Citation2021; Borozan, Citation2019; Bozoklu & Yilanci, Citation2013; Sebastian & Vela, Citation2013; Brantley,2012; Massimo & Hunt, Citation2011), the results of these studies are mixed. For instance, using a cross-section regression and a panel dynamic regression, Sebastian and Vela (Citation2013) finds that countries with higher revenues from environmental taxes reduce CO2 emissions, particulate matter emissions, and energy consumption and production from fossil sources. Bashir et al. (Citation2021) used fully modified OLS and dynamic OLS to estimate the impact of environmental taxes on energy consumption and energy intensity. They confirmed that environmental taxes are an effective policy tool to prevent environmental degradation, which can be attributed to sustainable energy management policies to reduce dependence on fossil fuels. In terms of energy intensity, Convery et al. (Citation2007) pointed out that improving energy intensity will contribute to a 25% reduction in environmental pollution.
In contrast, Liobikienė et al. (Citation2019) argued that energy taxes do not directly or indirectly affect energy consumption and GHG emissions. Given these findings from the literature, it is noticeable that there are some ambiguities and conflicting results. This could be due to both the methods used and the time period considered, which have led to these different results. Other explanations for the results may also be based on different measures of energy consumption, including oil, electricity and coal consumption. Environmental tax specifications were also generally based on tax fragments rather than total componets of the environmental tax mix. This study is unique in that I employed a larger sample size and explored total environmental tax, total energy consumption, and total energy intensity, which is scarce in the literature. I have also conducted a number of robustness procedures that have rarely been used in previous studies. Thus, in this study, I look at the impact of environmental taxes on energy consumption and energy intensity in OECD countries and ask the question: “Does the introduction of environmental taxes have an impact on energy consumption and energy intensity?” The study also examines the impact of disaggregated environmental taxes on total energy consumption. In addition, the study attempts to estimate the causal relationship between total environmental taxes and energy consumption and intensity in OECD countries.
This study is similar to studies such as Celil Aydin and Esen (Citation2018), Morley (Citation2012), and Bashir et al. (Citation2021) and Sebastian, Miller and Mauricio (2013). Despite the similarities in terms of variables and methodology, there are still some differences worthy of note. My study differs in two ways from the study conducted by Bashir et al. (Citation2021). In terms of objectives, I sought to examine total environmental taxes and energy consumption and explore the impact of disaggregated environmental taxes on energy consumption. In terms of sample size, I have increased the number of OECD countries from 29 to 35. It is hoped that this study will contribute to the existing literature in several ways: First, despite the progress that OECD countries have made in environmental reforms, there is a need to introduce an optimal mix of environmental taxes.
Therefore, this study will assist policymakers in implementing and integrating environmental tax policies into economic policy reforms. This study considers energy consumption and energy intensity and estimate their impact on environmental taxes using the ratio of environmental taxes to GDP and environmental taxes to total taxation, which has rarely been used in the literature. At a time when most economies have been devastated by the Covid_19 pandemic and are trying to recover, they have an opportunity to better recover and ensure that their climate change ambitions are not derailed. By aligning recovery with climate targets, such as the Paris Agreement, well-designed environmental policies can limit warming to below 2°C. The study will be divided into five sections. Section one focuses on the introduction and general background of the topic. Section two reviews the empirical and theoretical literature. Section three also looks at the empirical and estimation strategy used to analyse the data, and section four also focuses on the empirical results and discussions. The final section concludes the study by drawing important conclusions and providing implications for future studies and possible limitations in conducting this study.
2. Section 2: literature review
2.1. Overview of environmental taxation in the OECD member countries
An Environmental tax, also referred to as environmentally related taxes, refers to any compulsory, unrequited payments made to the government and levied on tax bases of particular environmental relevance (OECD, Citation2004). According to the European Commission (1994), environmental taxes are taxes designed for environmental reasons or those that raise revenues for environmental solutions, usually through fiscal agencies, that increase the tax revenue and transfer to other units or utilise the funds in financing environmental activities (European Commission, 1994). The European Commission, (1994) defined environmental taxes as “any tax with a tax base consisting of a physical unit that harms the environment, which the European System of Accounts can also identify as a tax.” Thus, the emphasis of this definition lies in the impact of the tax on the cost of activities and the negative environmental impact such activities or products place on the environment. Furthermore, the environmental impact of the tax emanates from the effect on the relative prices of products and the price elastici.
Environmental taxes are also referred to as Pigovian tax (Eurostat (2013). “A Pigovian tax is levied on any market activity that produces negative externalities” (Morley, Citation2012). This tax is levied at a tax rate that equates to the marginal damaged cost intended to correct the inefficiency. Thus, in effect, the Pigovian tax faces the task of ensuring a tax level that will counterbalance the cost of environmental damage. In environmental economics theory, an externality is a concept that refers to a cost or benefit that is not transferable through prices. The benefit is a positive externality, while the cost is a negative externality.
2.1.1. The developments of environmentally related taxes among OECD member countries
The development of environmental tax policies among OECD countries since the 1970s follows three important trajectories. According to Cottrell et al. (Citation2016), environmental taxes were classified as either cost-covering charges during the 1960s and 1970s or exonerating taxes on “bad” like pollution in exchange for higher taxes on “good” such as labour. The first phase saw the development of several environmental protection principles designed for firms and to be in line with internationally recognised regulations (Barde, 1994). In the words of Barde (1994), the “Polluter pays principle” (PPP) was the first and most crucial principle. The PPP was an internationally recognised principle agreed upon among OECD countries in 1972, which was seen as a policy whereby the polluter bears the entire cost of activities (mainly decided by public authorities) that ensure a clean and safe environment. In other words, the polluter ensures that he pays a price that reflects the goods and services that cause pollution during production or consumption (Kingston, Citation2020). Such principles should be devoid of subsidies that create distortions in trade and investment at the international level.
The next stage, which covered the period during the 80s and 90s, saw the development and deployment of so-called “policy instruments” designed to implement and enforce environmental policies. In the 1980s, the OECD employed taxes on pollution and energy products to protect the environment and streamline consumption behaviour (Jiankun et al., Citation2019). The OECD and EU countries began implementing comprehensive green tax reforms in three stages during the 1990s. The first was to streamline or abolish environmentally harmful subsidies such as direct public expenditure, market price support and reduction and exemptions from environmental taxes. Furthermore, they sought to restructure existing relevant taxes by considering environmental standards. The OECD also introduced new environmental taxes (OECD, Citation2006).
During the mid-1990s, countries within the OECD implemented “ecological tax reforms” in different magnitudes, although the implementation encountered various barriers. Several issues were highlighted in countries such as Denmark, Germany, the United Kingdom, and France, where tax reform has not yet taken place. Some of these problems are a lack of general knowledge about the tax system, citizens’ scepticism about the use of tax money and the lack of connection between the introduction of environmental taxes and the reduction of other taxes. Presently, the environmental tax system has gained acceptance within the OECD and has become the main means of environmental policy in many countries (OECD, Citation2006).2.2 Main categories of environmental taxes
Environmental taxes have four main types: energy, transport, pollution, and resource(Dyduch & Stabryła-Chudzio, Citation2019).
2.1.1.1. Energy taxes (including fuel for transport)
Energy taxes are taxed on energy production and associated products (Eurostat,2020). Carbon dioxide (CO2) taxes are also included in this category of taxes. On the other hand, when included, they must be reported separately. Similarly, taxes on greenhouse gases, biofuels and renewable energy sources are also classified under energy taxes instead of pollution taxes (Tibulcă, Citation2021). Also included in this category is revenue generated from the selling of emissions permits are also included in this category. Harding (Citation2014) revealed that transport energy generates 85%, on average, of excise tax revenues from energy products in OECD countries. In 2017, environmental taxes accounted for 71% of total revenues in OECD countries on both a simple and weighted average basis and over 50% of total ERTRs. Similarly, taxes on energy in the EU accounted for more than three-quarters of the total revenues from environmental taxes. In 2019, energy taxes accounted for the majority (77.9% of the total) of taxes, well ahead of taxes on transportation taxes followed by taxes on pollution and resources (3.2%). (Eurostat database, 20)
2.1.2. Transport taxes
Transport taxes mainly includes taxes related to the possession and use of automobiles. Taxes on different transport equipment such as planes, ships, etc., and other associated transport services are also covered here if classified under the definition of environmental taxes (Schlegelmilch & Joas, Citation2015). Unlike energy taxes, transport taxes vary wide in tax base and tax rate. Taxes can be one-time or recurring taxes and relate to ownership or use. Sometimes, transportation taxes are one-time taxes, like those related to sales or imports of goods, or recurrent taxes like those associated with annual road taxes. Also included are taxes on the method of transport taken into consideration to be particularly of more tremendous environmentally friendly including railway, rolling inventory and public transport in popular. Taxes on automobile insurance, petrol, diesel and different delivery fuels are covered in transport taxes.
In some countries, taxes on the precise CO2 emissions of cars have been introduced, which can be one-off registration, import taxes, or annual vehicle taxes (The global automotive guide, 2019). According to Runkel and Mahler (Citation2018), revenue from transport taxes in the Netherlands is reported to be the third highest in Europe. In the years following the implementation of the tax, the Netherlands climbed in rankings from twelfth to first in lowest vehicle carbon emissions (Runkel & Mahler, Citation2018). The Dutch transport tax centred on vehicle registration tax based on the carbon efficiency of the vehicle, exempting vehicles that emitted below a certain threshold. Denmark generates the highest revenue from transport taxes in the region. However, it should be noted that Danish per capita transport emissions are still high, suggesting that transport tax regimes in Denmark are ineffective because they rely on high car purchase fees and low fuel taxes in the highest transport tax revenues. This creates a disincentive for the purchase of environmentally-friendly vehicles. In 2017, Eurostat reported that transport taxes were the second-largest share of environmental taxes (average, 26% weighted and 25% unweighted). In every country except Estonia, France, Lithuania, and the Slovak Republic and Slovenia).
2.1.3. Pollution taxes
Pollution taxes like resources taxes comprise a relatively low amount of green tax revenue. Despite the variations across countries, pollution taxes have been one of the most successfully implemented taxes with a higher level of success (Cottrell et al., Citation2016). Taxes on pollution are based on estimated emissions to air, water, solid waste, noise, and lubricating oils. The OECD (Citation2019) reported that taxes on pollution contributes little to the total environmental tax revenue. They found that OECD countries except for the Czech Republic, Estonia, France, Iceland, Lithuania, Netherlands, Slovak Republic, and Slovenia reported pollution taxes as around 5% of global environmental taxes in 2017. In general, charges collected from these activities help prevent pollution and clean up waste.
2.1.4. Resource taxes
According to Tibulcă (2021), resource taxes depend on natural resource extraction. They include water, forests, plant life, wild animals, and taxes for converting depleted resources back to environmentally friendly status. Households and businesses are responsible for more than 80% of the resource/pollution taxes in most European countries for which data are available (Georgescu et al., Citation2010).
2.2. Rational for using environmentally related taxes
The Institute for Fiscal Studies (IFS) (2011) observed that imposing an environmental tax like a pollution tax ensures that the polluter considers the cost when deciding how much to pollute. Thus, the polluter ensures that pollution is reduced to a reasonable level where the cost and benefit of production are efficiently considered. Internalising the cost of environmental taxes increases the cost of activities that generate the social cost or the negative externality concerning the “polluter pays principles.”
Environmental taxes also function as Pigouvian taxes since they ensure a transformational fiscal incentive. Economic operators are faced with a tax where they have to internalize the cost of the environmental damage by either paying for the harmful environmental impact or avoiding it. Where the tax successfully lowers negative environmental effects, the tax income generated will decrease, suggesting that economic actors have opted to change their behaviour (Institute for Fiscal Studies, Citation2011). However, this is possible in situations where the latter has a choice. Moving business activity may decrease yield, which shifts emissions; these relocating emissions are called “carbon leakage” (IFS, 2011).
According to the European Environmental Agency (Citation1996), environmental taxes help to encourage consumers and producers to modify their behaviour toward a more environmentally friendly use of resources, as well as to promote innovation and structural changes, as well as to reinforce regulatory compliance.
An important aspect of environmentally related taxes is their ability to provide revenue to states and governments. The OECD (Citation2011) stated that governments also implement explicit environmental taxes and other levies based on environmental factors to raise cash to fund government spending. Environmentally related taxes can generate revenue that can improve environmental spending and lower labour, capital, and savings taxes (OECD, 2016). For instance, the OECD (2016) found that revenues from environmentally-related taxes average around 2% of GDP among OECD countries in 2016. Because of the revenue-raising goal, environmental-related taxes may have higher tax rates than the projected value of social externalities. Such tax rates raise the cost of particular activities or items over the level of “correction” required to account for externalities (OECD, Citation2011). This may be justified in the case of final consumption if elasticities (and the resulting deadweight efficiency losses) are minimal enough. However, taxing intermediate products will likely cause distortions in the market, among other things(OECD, Citation2011).
Metcalf & Weisbach (Citation2009) argued that environmental taxes could also be an implicit way of taxing natural resource scarcity rents. The cost of taxes on fossil fuel consumption may, for example, fall primarily on the owners of fossil fuel deposits, as those taxes may affect the price of fossil fuels net of taxes. If environmental taxes are applied to the owners of inelastically supplied reserves, they function as an efficiency tax. Hence, the chances of the second (non-environmental) dividend improving (Metcalf & Weisbach, Citation2009). On the other hand, this same pattern suggests that there is less room for environmental improvement: the higher the tax paid by reserve owners, the lower the increase in the gross-of-tax price for consumers of these fuels.
2.3. Theories of environmental taxation and energy consumption
2.3.1. Energy consumption
Energy consumption refers to the amount of energy consumed by individuals or industries worldwide. Energy consumption refers to energy usage from power-generating sources such as fossil fuels and renewable energy. Oil, coal, and natural gas are the most common fossil fuels. Wind, solar, hydroelectric power, and biofuels are the most common renewable energy sources (EEA,2021). The world’s energy consumption is currently at 15 terawatts EEA,(2021). In recent decades, global energy consumption has increased significantly in practically all industries, with so-called rising economies like China and India leading the way. By 2040, non-OECD countries will make up 64.0% of global energy needs (739 quadrillions Btu; International Energy Agency, Citation2017). This shift in energy use in non-OECD countries is projected to shift the most towards Asia (International Energy Agency, Citation2017).
In the face of a global pandemic, global energy consumption growth slowed by 4% in 2020, compared to an average of 2% per year from 2000 to 2018 and 0.8 per cent in 2019 (Enerdata (2021). Most countries’ energy usage decreased, except for China, the world’s most significant energy consumer (24 per cent of global energy consumption in 2020), which recovered quickly from the COVID-19 crisis. Non-renewable energy sources, which are still prevalent, contribute to increased pollution, annoyances, and greenhouse gas emissions (United Nations Development Programme Citation2018). The disparity in per capita energy consumption between countries is usually due to differences in income or climate. However, considerable disparities in energy use remain across some of the world’s most industrialized economies, owing to differing attitudes about implementing energy-saving measures. For instance, the United States consumes significantly more energy per capita than Japan and Germany. Asia-Pacific area consumes the most primary energy, and China, with a rapidly developing economy and a population of over a billion people, is the world’s most significant primary energy consumer (Sönnichsen, Citation2020).
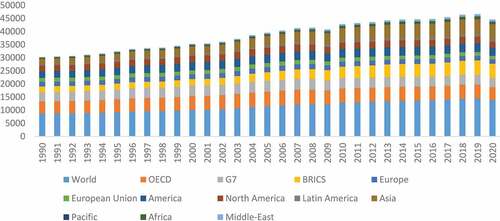
Fossil fuels have mostly met the world’s tremendous expansion in energy demand during the last four decades. In 2018, for instance, oil, coal, natural gas, hydroelectric, nuclear, and renewable energy accounted for 33.6, 27.2, 23.9, 6.8, 4.4, and 4% of global primary energy consumption, respectively. Meanwhile, fossil fuels accounted for 84.7% of the world’s primary energy consumption in 2018 (BP, 2019). Santamouris (Citation2018) argued that many social and economic factors and drivers influence energy consumption. The massive rise in population and the predicted considerable increase in domestic GDP may significantly increase energy consumption, particularly in less developed countries. shows the global overview of energy consumption over the past thirty years (1990 to 2020)
Figure 3. Energy consumption.
2.3.2. Energy intensity
According to the US department of energy (2021), the quantity of energy required to create a particular output or activity is called energy intensity. Reduced energy intensity is achieved by using less energy to manufacture a product or deliver a service. Economic growth has historically resulted in rising energy consumption, increasing the environmental pressures imposed by energy production and use (,European Environmental Agency, Citation1996). Therefore, energy intensity measures how much economic growth and energy consumption are separated. Relative decoupling develops when energy consumption grows slower than the economy ,(European Environmental Agency, Citation1996).
A unit of energy intensity is defined as the quantity of energy consumed per output unit. It is calculated by dividing the total energy consumed by the total output produced (Heidari et al., Citation2016). Heidari et al. (Citation2016) further observed that while physical energy intensity is obtained by measuring output in physical units, the dollar value of the output is used instead when calculating the economic energy intensity. Although this proposition has been argued in the literature, some studies adduced that energy intensity measures energy efficiency. As an indicator of energy efficiency trends, energy intensity is inversely proportional to efficiency (Hasanbeigi & Price, Citation2012; Heidari et al., Citation2016).
In contrast, energy efficiency does not reflect energy intensity because it is affected by several factors (climate, output composition, outsourcing of items produced by energy heavy businesses, and so on) that are not taken into account by the simple metric of energy supply to GDP (OECD, Citation2015). According to the international energy agency (Citation2021) , global energy intensity decreased by 0.4 per cent only in 2020, much slower than its historical trend (−1.5 per cent per year on average between 2000 and 2019), widening the gap with the 3.5 per cent per year reduction required to meet the 2°C targets (see ). This slowdown is primarily due to the 2020 economic recession, which negatively influenced economic activity but did not reduce energy consumption. The levels and trends of energy intensity vary significantly around the globe, reflecting disparities in economic structure and energy efficiency gains.
Figure 4. Energy intensity of GDP at constant purchasing power parities (koe/$15p) (from 2000–2020).
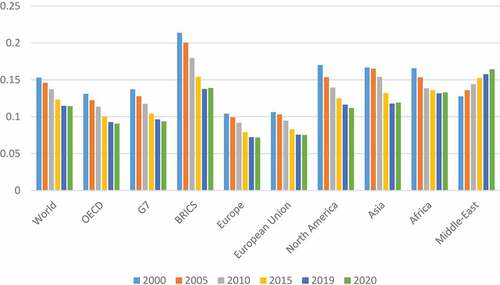
Despite changes in energy efficiency and, to a lesser extent, structural shifts toward less energy-intensive industry branches and an increasing role of services in GDP, the United States and the European Union have both reduced their energy intensity by about 2% since 2000 (the global energy statistical yearbook,2021). In 2020, the EU’s progress was substantially slower (−0.6 per cent), but it accelerated in the US (−4.2 per cent). China’s energy intensity remained stable in 2020 (+0.4%), compared to annual growth of 2.9 per cent from 2000 to 2019. In 2020, its energy intensity was 43% lower than in 2000, but it was still 27% higher than the global average.
Therefore, based on the above, one can conclude that energy intensity measures how much energy is consumed per unit of GDP, and a high energy intensity means a high cost of converting energy into GDP. A reduction in energy intensity may also indicate an improvement in energy efficiency with time (Baumann, Citation2008; Jamshidi, Citation2008; Nanduri, Citation1998). It can be noticed from the below that there has been a gradual decrease in the global energy intensity over time since the year 2000, with the exception of the middle-east countries. For instance, the International Energy Agency (Citation2021) revealed that despite the initial target set by the sustainable development goal to attain an even higher improvement in 2018 by 1.2%, this still lies below the expected target. In many major economies, recent slowdowns have resulted from weak policy implementations related to energy efficiency.
Furthermore, demand growth has been vital in countries with more energy-intensive economies. According to the Stated Policies Scenarios(IEA,2020), current and planned policies will improve energy intensity at 2.4% per year until 2030. The rate of improvement has doubled since 2018 but remains below the almost 3% needed to meet SDG 7.
2.4. The nexus between energy consumption and environmental taxes
2.4.1. Environmental taxes and carbon emissions
Many studies have argued that a carbon tax would aid internalizing external costs and making the polluter pay. In other words, by imposing a carbon tax, firms and individuals will be forced to pay for carbon pollution . Thus, theoretically, a carbon tax will reduce pollution and enforce environmentally friendly alternatives. However, such taxes will either positively or negatively impact carbon emissions.
Basing on the Irish economy, Wissema and Dellink (Citation2007) showed that an environmental tax of 10–15 euros per ton can reduce emissions by about 26%. As a result, demand would move from high-carbon-intensity fuels to lower-carbon-intensity energy sources and from energy to other commodities. Similarly, Sterner (Citation2007) contends that environmental taxes on fossil fuels have a long-term influence on lowering non-renewable energy usage and can reduce carbon emissions by up to 50%. Sundqvist (Citation2007) accessed the environmental effectiveness of Sweden’s energy taxes. Specifically, whether these have reduced CO2 emissions and how they have changed the structure of energy consumption. Using time-series data from 1960 to 2002, the author found that oil and coal taxes reduce CO2 emissions, whereas natural gas taxes increase them. Lin and Xuehui (Citation2011) argued that carbon tax is widely regarded as the most effective market-based mitigation tool. Using the difference-in-difference(DiD) method, the authors evaluated the mitigating effects of five north European countries in detail. They concluded that Finland’s carbon tax has a considerable and negative influence on the country’s per capita CO2 emissions rise.
Meanwhile, carbon taxes have a negative but insignificant impact in Denmark, Sweden, and the Netherlands. Furthermore, due to tax exemption regulations on certain energy-intensive businesses in these countries, the mitigating effects of carbon taxes are lessened. Nonetheless, the carbon tax has failed to achieve its mitigation goals in Norway, where the rapid growth of energy products has resulted in a significant increase in CO2 emissions in the oil drilling and natural gas exploitation sectors.
Sebastian and Vela (Citation2013) examine the efficiency of environmental taxes by comparing the environmental performance of 50 countries throughout the globe to the amount of income collected from environmentally-related taxes. Sebastian and Vela (Citation2013) finds that countries with higher revenues from environmental taxes reduce the amount of CO2 emissions, particulate matter emissions, and energy consumption and production from fossil sources. Hyland and Cosmo et al. (Citation2013) determined the long-run price and income elasticities underpinning energy consumption in Ireland using annual time series data from 1960 to 2008 and discovered that environmental taxes are associated with a decrease in carbon emissions. In terms of the impact of environmental taxes on greenhouse gas emissions, Kotnik et al. (Citation2014) used a panel data set of 19 EU economies from 1995 to 2010 to examine the impact of state environmental taxes on greenhouse gas (GHG) emissions. Estimating the direct and indirect effects of government environmental taxes on GHG emissions in industrial processes, Kotnik, Klun, and Skulj reported that the direct effect is negative. In contrast, the indirect effect through environmental expenditures is likewise negative and statistically significant. Empirically assessing the introduction of a carbon tax and a value-added tax on transportation fuel in Sweden, Andersson (2019) conducted a quasi-experimental analysis to discover a strong causal influence of carbon taxes on emissions. Compared to a synthetic control unit formed from a comparable set of OECD countries, the author revealed that carbon dioxide emissions from transportation decreased by over 11% after implementation, with the carbon tax accounting for most of the reduction. Khan et al. (Citation2019) used the Linear ARDL model to investigate the effect of environmental regulations on carbon emissions in China from 1991 to 2015. They discovered a negative and statistically significant relationship between environmental regulation and carbon emissions in both the short and long run.
On the contrary, Rapanos and Polemis (Citation2005) investigated the impact of energy taxes on the reduction of pollution in Greece. According to the study concerning household energy demand from 1965 to 1998, harmonizing Greek energy taxes to the average European Union levels would result in an annual rise of 6% in total CO2 emissions. CO2 emissions are significantly reduced if taxes are raised to the highest levels in the European Union. These data suggest that environmental taxes aren’t the only tool for reducing pollution. Within the constraints of the available longitudinal data set, Ulucak (Citation2020) used a panel smooth transition regression approach to study the non-linear effects of environmental carbon dioxide (CO2) emissions by controlling for environmental technologies, patents, and economic growth. The empirical findings suggest that environmental taxes reduce CO2 emissions at increasing degrees of globalization. Regarding environmental taxes and renewable energy demand, Bashir et al. (Citation2020) used system-GMM and quantile regression techniques to examine the impact of renewable energy and environmental on carbon emissions in OECD countries from 1995 to 2015, indicating that environmental taxes negatively impede carbon emissions. On the other hand, Silajdzic and Mehic (Citation2019) found that environmental taxes do not appear to change economic agents’ behaviour or protect the environment.
2.4.2. Environmental taxes and energy consumption
Morley (Citation2012) used data from 25 European countries from 1995 to 2005 to examine the long-term effects of environmental taxes on energy consumption and pollutant emissions. His study employed the two-step GMM technique and accounted for heterogeneity and endogeneity difficulties in econometric specifications. According to the findings, environmental taxes have no significant impact on energy consumption. Bashir et al. (Citation2021) use 29 OECD nations to offer new light on the uncertain function of environmental taxes in reducing energy usage and intensity from 1994 to 2018. The results from the FMOLS, DOLS, and panel quantile regression show that imposing an environmental tax encourages policymakers and industry to lower overall energy consumption and enhance energy efficiency.
Sterner (Citation2007) revealed that fuel taxes play a critical role in the environment; therefore, eliminating them would increase emissions. The author found that Fuel taxes have slowed the growth of fuel use and, as a result, CO2 emissions. Despite the fact that fuel consumption is enormous and expanding, it would have been substantially higher if domestic fuel taxes had not been imposed. Umer Shahzad (Citation2020) investigated the effects of environmental taxation, energy consumption, and energy efficiency on pollutant emissions and found that energy use for environmental taxes had a considerable impact. However, the role of environmental taxes still remains uncertain and requires further research. Using time-series data from 1960 to 2002, Sundqvist (Citation2007) investigated the environmental effectiveness of Swedish energy taxes. That is if environmental taxes have reduced CO2 and altered energy consumption structure. The author discovered that oil and coal taxes encourage people to switch to less CO2-intensive energy sources while the natural gas tax, on the other hand, is the polar opposite.
Similarly, the oil and petrol taxes have an energy-saving effect, but the electricity tax increases energy use. Furthermore, the oil and petrol taxes have an energy-saving effect, but the electricity tax increases energy use. In terms of overall CO2 emissions, oil and coal taxes appear to reduce CO2 emissions, whereas the natural gas tax appears to increase them.
Suphi and Herman (Citation2018) estimated the long-run effect of a carbon tax on energy consumption using a novel and unique cross-sectional dataset on OECD economies’ effective energy tax rates and an instrumental variables estimation approach. They discovered that raising energy taxes by one euro reduced carbon emissions and fossil fuel usage by 0.73 per cent over time. A panel autoregressive distributed lag (ARDL) model was used by He et al. (Citation2021) to examine the relationship between environmental tax, economic growth, energy consumption, and carbon dioxide emissions. They discovered an N-shaped relationship between carbon dioxide emissions and gross domestic product and energy consumption using the environmental Kuznets curve theory (EKC) and the double-dividend hypothesis. Furthermore, the study demonstrates that the environmental tax has a long-term double-dividend effect in all three countries. Deng & Huang (Citation2020) used the system-GMM estimation model to assess the impact of green taxation and decentralization of government environmental policies on energy consumption and efficiency in 30 provinces in China from 2007 to 2016. Their research found that a narrow green tax could reduce energy consumption and increase energy efficiency. On the contrary, the study reported that in the case of a broad green taxation program, there was an increase in energy usage and a fall in energy efficiency.
2.4.3. Relationship between energy intensity and environmental taxation
Some studies have concluded that environmental taxes effectively reduce energy intensity since they encourage firms to use renewable energy sources and minimize carbon emissions. Guochang et al. (Citation2013) analyzed the impact of a carbon tax on energy intensity and financial development in a novel four-dimensional energy-saving and emission-reduction framework with carbon assessment imperatives. By adjusting the correlation coefficients of the 4-dimensional device, the study found that extra powerful strategies are completed to progressively and diligently lessen energy intensity. The reshowed also showed that because the tax levy factor of carbon tax grows larger, the energy intensity of the 4-dimensional device was managed better.
Sundqvist (Citation2007) discovered whether or not the energy taxes impacted energy intensity in Sweden by employing time series data from 1960–1975. The results showed no significant negative correlation between the energy taxes and the economy’s energy intensity. Also, the electricity tax positively correlates with the energy intensity at a 5% significant level. This implies that the oil tax and coal tax have contributed to decreasing the energy intensity within the economy.
Adetutu and Odusanya (Citation2013) examined components of the energy intensity gain arising from the UK climate change tax using a two-stage econometric approach and observed that carbon taxes lower energy intensity. Liobikienė et al. (Citation2019) analyzed whether or not energy taxes extremely contribute to the reduction of greenhouse emission (GHG) emissions. The Granger causality test on time series and panel data analysis showed that energy taxes didn’t Granger-cause fossil energy consumption, energy intensity, renewable energy consumption, and GHG emissions in most EU countries. Regarding the panel estimation technique, the results showed that energy taxes didn’t, directly and indirectly, influence GHG emissions. Thus, indicating that the energy programme in EU countries is ineffective.
More recently, Ajayi and Reiner (Citation2020) examined the direct influence of technological innovation and other factors on industrial energy intensity across 17 EU countries from 1995 to 2009. Their analysis of regional carbon taxation in Northern Europe showed that energy intensity decreased significantly after the Nordic countries implemented a national carbon tax in the early 1990s.
2.4.4. Relationship between financial development, urbanisation, trade openness, economic growth and energy consumption
A relationship between energy consumption, economic growth, financial development, urbanisation, and trade has been extensively examined for developed and developing economies. However, not much policy direction has been prescribed to restrict energy consumption. Magazzino (Citation2016) argued that an increase in real GDP and oil prices significantly affect energy consumption in the long run. Hoang and Ho (Citation2019) reported a long-run, positive and significant association between renewable and non-renewable energy use, government spending, gross fixed capital formation, trade openness and financial development, and economic growth. Similarly, Omri et al. (Citation2015) explored the correlation between FDI, CO2 emissions, trade, and economic growth using panel data for 12 MENA countries for 22 years (1990–2011) and revealed bidirectional causality between CO2 emissions economic growth.
Similarly, Saboori et al. (Citation2014) used time series data for OECD countries to estimate the bi-directional long-run association between energy consumption, CO2 emissions, and economic growth and found a positive significant long-run bi-directional relationship between CO2 emissions and economic growth. Using the nonlinear autoregressive distributed lag bounds testing approach to estimate the impact of energy consumption on the Indian economy, Shahbaz et al. (Citation2017) showed that only negative shocks in energy consumption impact economic growth and financial development. On the contrary, In their study of economic growth and energy consumption, Wang,et.al (Citation2021) concluded that the relationship may be time-dependent. The authors concluded that there is a positive correlation between renewable energy consumption and economic growth in the long run but that this relationship is negative in the short run. Similar findings were made in relation to the relationship between energy consumption and financial development. Using panel data for 16 Latin America and Caribbean Emerging Market and Developing Economies (EMDEs) from 1990–2014, they stated that economic growth would positively impact energy consumption even in financial development.
The impact of financial development, trade openness, and economic growth on energy consumption was investigated by Rafindadi and Ozturk (Citation2017). Using time-series data from 1970–2011, Rafindadi and Ozturk (Citation2017) observed that financial development and trade openness positively drive energy demand in South Africa. Cetin et al. (Citation2018) propose that carbon emissions in investment decision-making are primarily determined by economic growth, energy consumption, and trade openness in the long run. Moreover, Shahbaz, Hye and Tiwari (2013) have observed that economic growth and energy consumption drive CO2 emissions while developing financial markets and trade openness reduce them. Ma and Fu (Citation2020) examined the role financial development played in energy consumption and trade among 120 countries and found that financial development impacts worldwide energy consumption. Its two components (financial institution and the financial market) have the same effect. In developing countries, Khan and Hou (Citation2021) found a decrease in the effect of trade openness on carbon emissions. On the contrary, Koengkan (Citation2018) demonstrated that economic growth and trade openness positively affect energy consumption, while financial openness exerts a negative effect.
Other studies have also reported the relationship between energy consumption and urbanisation. For instance, Wang (Citation2014) examined the impact of urbanisation on residential energy consumption and production using time series data and showed that urbanization positively increases energy consumption. Similarly, Al-mulali et al. (Citation2013) explored the impact of urbanization on energy consumption and CO2 emission among MENA countries. They employed dynamic OLS with panel data from 1980–2009 and found a long-run bi-directional positive relationship between urbanization, energy consumption, and CO2 emission. Furthermore, using a panel quantile approach, Alola and Ulrich (Citation2021) revealed that urbanization and energy consumption disproportionately negatively impact environmental quality across quantiles, with the impact being minimal in the upper levels. Sahar and Salim (Citation2014) used the STIRPAT model and data from 1980 to 2011 to investigate the impact of urbanization on renewable and non-renewable energy consumption in OECD countries and discovered that total population, urbanization, and population density are significant factors influencing non-renewable energy consumption.
Shahbaz and Ozturk (Citation2017) investigated the association between economic growth, urbanisation, financial development and electricity consumption in the United Arab Emirates. Using time-series data for the period 1975–2011 and the ARDL bounds testing approach, they specified that economic growth, electricity consumption and urbanisation showed an inverted U-shaped relationship. Zhaoa & Zhang (2017) also reported that for every 1% increase in the urban population relative to the total population, national energy consumption rose 1.4%. On the other hand, Mishra et al. (Citation2009) examined panel data from 13 Pacific island countries from 1980 to 2005 to confirm that urbanization and per capita energy consumption are negatively correlated.
2.4.5. Relationship between financial development, trade openness, urbanization, economic growth and energy intensity
Several studies have addressed the relationship between financial development, trade openness, economic growth and energy intensity. Gustavo et al. (Citation2019) investigated the impact of energy intensity on economic growth using a panel data approach for 134 countries between 1960–2010. They observed that improvements in energy intensity are associated with higher GDP growth. On the other hand, Mahmood and Ahmad (Citation2018) found a negative effect on the relationship between energy intensity and economic growth among European countries. To substantiate the results above, Aydin & Turan (Citation2020) find that with the Russia of exception, trade openness, financial openness, and economic growth have reduced energy intensity among BRICS countries. However, Feng et al. (Citation2018) observed otherwise. Using a structural vector autoregressive model to estimate the relationship between financial development, trade openness, technical innovation, and energy intensity. The authors argued that economic growth has a more significant effect on energy intensity in the short run. However, this decreases with time. Again, they found a significant positive influence of financial development, trade openness, economic growth, and technological innovation on energy intensity. As urban cities continue to evolve, energy intensity will eventually decrease due to the growth in the urban population (Bilgili et al., Citation2017).
Using panel data for Asian countries between 1990–2014, Bilgili et al. (Citation2017) further examined the impact of urbanization on energy intensity. They concluded that urbanization has significant influences on energy intensity in the short-run and the long-run. Rafiqa et al. (Citation2014) explored the effect of urbanization and trade openness on emissions and energy intensity in twenty-two increasingly urbanized emerging economies. They used three second-generation heterogeneous linear panel models to find that while population density and affluence increase emissions and energy intensity, renewable energy appears to be dormant in these emerging economies. In contrast, non-renewable energy increases CO2 emissions and energy intensity.
Using a nonlinear analysis of asymmetric adjustment, Liu & Xie(2012) analysed the relationship between energy intensity and urbanization from 1978–2010 in China and confirmed the existence of non-linear causal relationships between energy intensity and urbanization.
Based on the discussions from the literature, the following hypothesis has been derived as the subject of my analysis.
H1 Environmental taxes have a negative relationship with energy consumption and energy intensity
H2 An increase in economic growth will stimulate higher energy consumption and energy intensity
H3 Urbanization positively improves energy consumption and energy intensity
H4 Improvements in financial development will positively impact energy consumption and energy intensity.
H5 Trade openness will improve positively on energy consumption and energy intensity.
2.5. Gaps in literature
One important area of this study is to explore how environment-related taxes reduce energy consumption. Throughout the literature on environmental taxation, it is noticed that much of the research has focused on the emission of pollutants (CO2, GHG, etc.), with very limited studies environmental taxes and energy consumption.
3. Section 3: empirical model
3.1. Introduction
Part three covers the outline of the methods used for conducting this study. We discuss the empirical strategy of this study here. The models used, the research hypothesis and the analytical tools employed are all discussed here. This study analysed the impact of environmental taxes on energy consumption and energy intensity by utilising data from 32 OECD countries from 1995–2014.
3.1.1. Preliminary modelling
Since the data is made up of cross-sections (countries) and time series (years), this study is modelled using the panel data econometric setup. One of the main reasons for using the panel data modelling technique is the large number of observations that come with a panel dataset due to its multidimensional characteristic, which allows it to include numerous observations for various individuals over a long period (Baltagi, Citation2005). However, before I proceed to use the appropriate setup that fits our model, I will first check for cross-sectional dependence in my data.
3.1.1.1. Cross-sectional dependence (CD)
As noted by Batalgi et al. (2007), panel data can experience pervasive cross-sectional dependence, where all the units within the same cross-section are related. A common explanation for this is the effect of unobserved common elements that are shared by all units and affect all in different ways (Batalgi. et al., 2007). Ignoring the cross-sectional dependence of errors can lead to serious consequences. For instance, Wilson (Citation1999) noted that when it comes to environmental expenditures, policies of one country may affect the policies of others through strategic policy. In other words, countries act interdependently in choices related to environmental expenditures. OECD countries imitate their neighbours in determining their environmental efforts (Le Gallo and Ndiaye, 2021), thus, making it possible for cross-sectional dependence to exist when analysing panel data. For this purpose, we employ the CD (cross-sectional dependence) test developed by Pearson (2004) to ensure that our data is devoid of inconsistent and empirically biased findings as noted by (Phillips & Sul, Citation2003). Similarly, Basak and Das (Citation2017) found that the Chow type F-tests are severely oversized whenever a panel dataset contains such dependence. They demonstrated that the Hausman test was quite unstable when exposed to various forms of cross-sectional dependence.
The empirical equation explaining the CD test has been stated below as:
Where N represents the sample size and T also represents the time and estimation of cross-sectional correlation of country i and j is represented by . To test the presence of cross-sectional dependence or independence in the data, I set the null hypothesis H0, which assumes no cross-sectional dependence. In contrast, the alternative hypothesis H1 also assumes that there is cross-sectional dependence.
3.1.2. Test for stationarity and unit root
Further, I proceed to test the stationary properties of my data by taking the unit root test. Various techniques have been employed in testing for stationarity. Nonetheless, I will depend solely on the results of the LLC unit root technique. The LLC is one of the first unit-roots developed for panel data. This analysis is based on the equation
where represents the time trend, and αi represents the individual effects. The source of heterogeneity emanates from the deterministic components shown in this model since the coefficient of the lagged dependent variable is restricted to be homogeneous across all units in the panel.
is the error term. It is assumed here that the error term is independently distributed across individual countries.
The power of the LLC unit root test, according to Nell and Zimmermann (Citation2011), is the likelihood of rejecting the null hypothesis when it is false, and the null hypothesis is a unit root. However, one drawback of this test statistic is that it is heavily reliant on the assumption of cross-sectional independence; for instance, Austria’s GDP is unrelated to Germany’s GDP. Maddala (Citation1999) opined that in most cases, the null hypothesis of the LLC test might help to test for convergence in growth among countries, but the alternate hypothesis restricts every country to converge at the same rate. Furthermore, the null hypothesis that every cross-section has a unit root is extremely restricted. In addition, I performed three other unit root tests to argument the LLC. Thus in all, I performed Levin et al. (Citation2002) LLC, Im et al. (Citation2003) IPS and Maddala and Shaowen (Citation1999), ADF-Fisher and PP-Fisher tests. To apply the test, I followed the specification that only the intercept and trend can be employed in the test for stationarity. Furthermore, I based my study on the null hypothesis H0 that all variables employed exhibit unit root properties (non-stationary) whiles the also argues that the variables in question do not exhibit unit root properties (stationary).
3.1.3. Panel co-integration test
Next, the cointegration properties of the panel data were examined using second-generation panel unit root tests, which are robust to cross-sectional dependence. The movement of two or more time-series over the long run can be synchronized in such a way that they appear to be on the same trend; that is, they seem to share the same trend component (Stock and Watson, Citation2012).
Several types of co-integration tests have been proposed in the econometric literature. In this study, I employed Pedroni (Citation1999, Citation2004) and Westerlund (Citation2007, 2008) panel co-integration test as the source of my analysis for long and short-run relationships between energy consumption, energy intensity and environmental taxes. Pedroni (Citation1999, Citation2004) suggested various tests to employ for the null hypothesis of co-integration in panel data which permits heterogeneity by utilizing the coefficients of both the across cross-section in the equation. The test is based on the premise that the null hypothesis H0 assumes no co-integration against the alternative hypothesis H1, which also assumes panel co-integration. The model by Pedroni (Citation2004) can be explained by equation three below.
Where and
denote observable variables and has a dimension of and
represent observable variables with dimensions of m x (N*T) and 1 x (N*T), respectively.
and
represent the individual and trend effects respectively and can be assigned a value of zero if desired.
Since the interest is to test the null hypothesis of no co-integration against the alternate hypothesis for all the individual countries in the panel, I assumed from the null hypothesis that the residuals from Equationequation 3(3)
(3) will be integrated of order I(1). According to Pedroni (Citation2004), the regression residuals of the panel or the residuals of the between dimensions can be pooled in seven different ways. However, I will utilize only panel and group mean t-statistics in this paper. These two are assume to be the commonly used test statistics. (Pedroni, Citation1999). Furthermore, I also employed the error correction model(ECM) for Westerlund (Citation2007), which also test the null hypothesis of no co-integration and is based on whether the error correction term is equal to zero in the panel error correction model. Westerlund (Citation2007) developed a new group of panel cointegration tests that are not restricted by common factors and use structural rather than residual dynamics.
These tests are all normally distributed and provide the flexibility to explore short-run dynamics, trend and slope parameters, as well as, cross-sectional dependencies based on unit specifics.
The process for the error correction test follows
where t = 1, …,T and i = 1, …,N represent the index of the time-series and cross-sectional units respectively and contains the deterministic components and can be modelled in three cases. In the first instance, we assume that
= 0 means we estimate the model with not no deterministic terms. In the second instance, we further assume that
= 1, and the model is estimated with a constant. In the third instance, we assume that
= (1, t)’ so the model is estimated with constant and a trend.
3.2. Model specification
Since I aimed to model the relationship between environmental tax and energy consumption and energy intensity, I employed the ratio of environmental tax revenue to the total tax revenue as a proxy for environmental tax, whiles energy use and energy intensity were used as proxies for energy consumption and intensity, respectively. These variables were selected based on the review from the empirical literature. In addition, this study is also motivated by the work done by Bashir et al. (Citation2021); therefore, we employed the variables used by the authors; however, my data was also augmented with other details that were not employed by Bashir et al. (Citation2021). Based on the literature, I argue that it is reasonable to assume that environmental taxes will have an impact on energy consumption because they promote either more efficient use of resources or less energy consumption, excluding exemptions that may have significantly reduced their effectiveness. Similarly, I also argue that improvements in energy intensity can be largely associated with environmental taxes.
As noted by Ajayi and Reiner (Citation2020), environmental taxes can stimulate economic growth, decrease pollution intensity, and control resource intensity when accompanied by strong government control, active consumer awareness, and a technologically advanced level of innovation. Thus, I modelled energy consumption and energy intensity as dependent variables and environmental tax as the independent variable. The baseline models are specified below
Where i and t represent the individual country and time in our panel respectively. and
denotes energy consumption and energy intensity, respectively whereas
also denotes environmental tax. The vector of control variables is also represented by
whiles the β1 and γ represent the estimates or coefficients to be estimated, and the variable in the vector is defined by j.
In formulating the model, I consider the determinants of energy consumption, an approach that is followed by other studies (Grossman & Krueger, 995; Morley, Citation2012; Asuamah, Manu & Wereko, 2013; Mudakkar. et al., Citation2013). Hence, I added financial development, trade openness, urbanisation and economic growth as control variables. Thus the augmented model for the study for both energy consumption and energy intensity are specified below:
where represents energy consumption, in this case, the energy usage at a certain period,
is the energy intensity.
also represent the environmental tax.
,
,
and
are the control variables.
is the financial development index,
represent the economic growth rate,
denotes the urban population and
represents trade openness. The cross-section of countries used is defined by i, and t is the number of years covered by the study while
is the error or disturbance term. Here we assume that the error term is independent and identically distributed with mean zero and constant variance.
3.3. Estimation techniques
Considering that there is co-integration among the variables, I considered models that will be useful in estimating the long-run relationship between the variables in the presence of a heterogeneous panel framework. According to Pedroni and Kao (Citation2000), using the OLS estimator may not be appropriate here for several reasons. Pedroni and Kao (Citation2000) argued that the OLS estimator is biased and inconsistent estimator when applied to the cointegrated panel. On the other hand, Mark and Sul (Citation2003), for instance, also claimed that the standard OLS fixed effects estimator is super consistent in the presence of panel cointegration; however, it suffers from a second-order asymptotic bias arising from serial correlation and endogeneity. This concludes that the OLS t-ratio is not asymptotically normal and is thus useless for making inferences. For this reason, Pesaran et al. (Citation1999) identified three main approaches for exploring the long-run relationship when variables are co-integrated. These are the error correction model, the mean group and the pooled-mean group estimators.
Similarly, Pedroni (Citation2000), Mark and Sul (2001) and Kao and Chiang (Citation2000) showed that the fully-modified OLS and the dynamic OLS could both be employed in the face of co-integrated variables. Hence I consider these two main approaches to estimating the relationship between energy consumption, energy intensity and environmental taxes. These are the fully modified OLS and the dynamic OLS models.
3.3.1. The fully-modified OLS
The FMOLS considers the presence of the constant term and its possible correlation with the error termCitation2000. Nevertheless, to adjust for these factors, the dependent variable is adjusted non-parametrically and then regressed on the regressors to derive the long-run parameters. To address the issue of serial correlation effects and endogeneity caused by co-integrating relationships, the FMOLS allows us to adjust for serial correlation effects and endogeneity (Maeso-Fernandez, Osbat & Schnatz, Citation2004). The basic assumption is that the variables must be cointegrated at the order I(1) or I(0). Hence, the long-run coefficients can be generated as follows
Averaging the group estimates over N yields long-run FMOLS coefficients for the group-mean setting. There are two ways to compute the pooled FMOLS coefficients: weighted and unweighted. First, each group’s residuals and rights-side variables are weighted by the long-run covariance components to get the weighted component; then, these components are averaged in the second case. Pedroni (Citation2000) argued that the required parameters for the weighted statistics are presumed to be known in advance. For this reason, various authors propose different starting values for computing feasible weighted statistics. Kao and Chiang (Citation2000) use the parameters from a static fixed-effects model, while Pedroni (Citation2000) uses values derived from null hypothesis estimation.
3.3.2. The panel dynamic-OLS
The DOLS approach involves adjusting the static regression errors by a parametric estimation approach (Maeso-Fernandez, Osbat & Schnatz, Citation2004).DOLS involves a parametric adjustment to the errors of the fixed regression. In order to make the correction, the residuals from the static regression are related to the first differences of the leads, lags, and contemporaneous values of the regressors. The first step is to regress the endogenous variables of each equation on the lead and lag of the first differenced regressor of all equations, which controls for potential endogeneities. The residuals obtained from the first regression step are then used in the OLS method. The model estimated under the DOLS is given by
Where, represents the dependent variable adjusted for covariance between the error term and
and
is the adjustment for the presence of a constant term
represents the estimates.
3.4. Control variables
3.4.1. Financial development
The amount of capital flowing into financial institutions, capital markets, and foreign direct investment (FDI) is a measure of financial development. According to Sadorsky (Citation2010), the financial development of a country can increase the efficiency of the economy, allow a flow of financial capital, reduce financial risks, and increase financial transparency, which can increase consumption and fixed investments but can affect the energy demand. Many recent studies have established a link between energy consumption and financial development (Islam et al., Mielnik & Goldemberg, Citation2002; Sadorsky, Citation2010; M. Shahbaz et al., Citation2010). The general conclusion in the literature is that financial development impacts energy demand positively. Energy consumption is causally related to financial development in two possible ways: the positive or the negative. Regarding the first channel, financial development increases energy consumption as it contributes to economic growth, which in turn leads to a higher demand for energy (Sadorsky, Citation2010; Rashid & Yousaf, Citation2015). A second channel describes financial development leading to decreased energy consumption by promoting modern, less energy-consuming technologies.
3.4.2. Urbanization
Poumanyvong and Kaneko (Citation2010) argued that urbanization means a shift of the rural labour force from the agricultural sector to the industrial sector, which is mostly situated in urban areas. Madlener and Sunak (Citation2011) found that urbanization affects energy demand via changes in urban structure. Additionally, they argue that urbanization causes real and optimal energy consumption to increase substantially, but reduces efficiency of energy use.
3.4.3. Trade openness
There are several ways through which energy affects trade openness. Nasreen and Anwar (Citation2014) argued that if energy increases trade, then policies targeted to reduce energy consumption will eventually impact on export and import of goods which will translate into a reduction in openness to trade. As mentioned above, energy plays a crucial role in production due to the fact that machinery and equipment are powered by energy (Muhammad Shahbaz et al., Citation2013). Furthermore, energy is required to fuel transportation when exporting or importing manufactured goods. Thus, the trade will be largely impeded without energy. Hence it is expected that energy will affect trade significantly. Due to its importance in trade expansion, energy is an essential input needed to expand trade via increased exports and imports (Sadorsky, Citation2010).
3.4.4. Economic growth
Barro & Xavier (Citation2003) defined economic growth as the process whereby the country’s real national and per capita income increases over a long period. Many studies have argued that there is a positive relationship between energy consumption and economic growth. For instance, According to Ghali and El-Sakka (Citation2004), energy consumption is a contributing factor to output growth. Following the neoclassical production technology of one sector, they developed a VEC and tested the relationship between output, capital, labour, and energy integration. They found causality running in both directions between output growth and energy use. Table below shows the a priori expectation of the variables to be measured.
Table 1. An a prior expectation between energy consumption and determinants of environmental taxes. Dependent variable: energy consumption and energy intensity
3.5. Data
This study examined the effect of environmental taxes on energy consumption and energy intensity using data from 35 OECD countries between 1994 and 2014. Following the literature, I also estimate the determinants of energy consumption by considering several variables in my model. The environmental tax was measured according to the internationally accepted definition and is defined in this study as physically based taxes which show evidence of their environmental effects on the environment. Furthermore, to measure environmental tax, I employed the ratios “environmental tax revenue as a percentage of GDP” and “environmental tax as percentage of total tax revenue”, as a proxies for the tax rate. Energy use (kg of oil equivalent) per capita was used as the proxy for energy consumption, whiles intensity per GDP was also used as a proxy for energy intensity. To measure the role of the financial impact on energy consumption, I employed the index of financial development as a proxy. This is important since financial development ensures the ability of the financial institutions to provide funding for production expansion and to meet aggregate energy demand. The total urban population in millions was also included as an indicator for the level of urbanization. The inclusion of urbanization is driven by variations in GDP and population (Rafiq, Salim &Nielsen,2014). I also catered for the effect of international trade in the model by including trade openness. According to Sadorsky (Citation2011), international trade requires a functioning transportation network. Moving goods by air, rail and road consume a lot of energy. Finally, I account for the impact of income on energy consumption by including economic growth, which was measured in GDP constant 2010 US dollars. Furthermore, I obtained the data for this study from three sources: the World Bank’s world development indicators, the international monetary fund (IMF) data mapper, and the OECD database. Specifically, I obtained data for environmental taxes from the OECD database. At the same time, the data for energy consumption, energy intensity, urbanization, economic growth, and trade openness were accessed from world development indicators (WDI). In addition, the data for the financial development index was also obtained from IMF. It is also important to note that I used the natural log of the variables to generate simplified and linearized results.
4. Section 4: empirical results and discussion
4.1. Introduction
In this section, attempts have been made to present the empirical results of the study. The results are in two phases. The first phase presents the preliminary analysis of the results, including the data description and sources(see ) , CD test, unit root test, and co-integration test. The next stage presents the main results of the studies. I relied on the fully modified OLS and the dynamic OLS model.
Table 2. Definition and sources of variables
4.1.1. Results of cross-sectional dependence test
The results of the cross-sectional dependence test showed the presence of cross-sectional dependence within the residuals. This is evident because all the three tests, i.e. the Breusch-Pagan LM, Pesaran scaled LM and Pesaran CD, are all significant at 5% (see, ). Thus we reject the null hypothesis of no cross-sectional dependence in the residuals and conclude the residuals are cross-sectionally related.
Table 3. Cross-sectional dependence test
4.2. Results of panel unit root estimation
From the unit root test, the preferred LLC, the Im–Pesaran–Shin (2003), and the Phillips and Perron (Citation1988) tests showed that Environmental tax to GDP ratio, urbanization and energy consumption exhibited evidence of unit root properties at level I(0). On the other hand, the Fisher and Augmented dicky-fuller test showed otherwise. Owing to the presence of the unit root among the variables, I further test using the log difference of the values as stipulated by the literature. The results showed no evidence of unit root among the variables used at the first difference, as observed in . Thus all the variables showed evidence of stationarity at a 5% significance level in all tests at the first difference, hence, the rejection of the null hypothesis of the presence of non—stationarity (unit-root) among the variables used.
Table 4. Results of unit root test
4.3. Results of pedroni and westerlund panel co-integration test
In order to examine the long-run relationship between energy consumption, energy intensity and environmental taxes, the Pedroni and Westerlund co-integration test was employed. The null hypothesis of these tests argued that there is no long-run relationship between energy consumption/energy intensity and environmental taxes. The alternative hypothesis corroborates the presence of a long-run relationship. The empirical results in for all the models 1–4 showed all three tests for Pedroni residual co-integration, namely, the Phillips-Perron, modified Phillips-Perron, and the Augmented Dickey-Fuller tests, are significant at 5%. Similarly, evidence of co-integration has been proven through the empirical results of the Westerlund test at a 5% significance level. Thus, both Pedroni and Westerlund tests confirmed that we could reject the null hypothesis at a 5% significance level and argue that energy consumption and energy intensity are co-integrated with environmental taxes. The presence of co-integration, therefore, implies that both energy consumption and energy intensity move together. Similarly, the results also showed that energy consumption and energy intensity are co-integrated with the control variables, i.e., financial development, urbanization, trade openness and economic growth.
Table 5. Panel co-integration results
4.4. Results of estimation and discussions
This section explores the empirical results of the regression models employed in estimating the objectives of the study. Due to the existence of co-integration among the variable, I employed FMOLS and DOLS, which is the main focus of my econometric strategy. These two techniques are deemed very crucial in addressing the problems of serial autocorrelation and endogeneity, as stated in the methodology. FMOLS uses a nonparametric approach to address autocorrelation and endogeneity concerns; on the other hand, a parametric approach enables DOLS to eliminate these concerns by accounting for lags in independent variables. In estimating the FMOLS and DOLS equations, the weighted criteria were employed as this helps to control heterogeneity and long-run variance. This study aimed to examine the impact of environmental taxes on energy consumption and energy intensity. To do this, I employed two econometric equations constituting the baseline models (Model 1 and Model 2). Model 1 explains the impact of environmental taxes on energy consumption, whiles model 2 details the impact of environmental taxes on energy intensity. From model 1, environmental tax shows a negative effect on energy consumption in both the FMOLS and DOLS models, respectively, indicating that high levels of environmental tax revenues are associated with less energy consumption. Specifically, a percentage increase in environmental tax will lessen energy consumption by 0.14 per cent and 0.08 per cent, respectively, across OECD countries. Furthermore, it is interesting to note that this depreciation in energy consumption associated with an increase in environmental tax is statistically significant at 5%. Similar to the above findings, Bashir et al. (Citation2021) showed that environmental taxes have negative impact on energy consumption. According to the author imposing an environmental tax encourages policymakers and industry to lower overall energy consumption and enhance energy efficiency. Similarly, Shahzad (Citation2020) revealed that environmental taxes have a considerable impact on energy consumption, energy efficiency and pollutant emissions. Using the system-GMM Deng & Huang (Citation2020) showed that green tax could reduce energy consumption and increase energy efficiency. Thus the above studies corroborates the findings of this study. Contrary to the findings of this study Morley (Citation2012) found that environmental taxes have no significant impact on energy consumption. Furthermore, we find that with the exception of financial development index, trade openness, GDP and urbanization have recorded positive and significant relationship with energy consumption. The results further explain that energy consumption also correlates positively with economic growth in the long-run, since the coefficients are statistically different from zero. This is also true since energy serves as a catalyst for economic growth; hence, energy consumption changes affect income. This results corroborates much of the findings in the literature. Hoang and Ho (Citation2019) reported a long-run, positive and significant association between renewable and non-renewable energy use, government spending, gross fixed capital formation, trade openness and financial development, and economic growth. Similarly, Omri et al. (Citation2015) revealed bidirectional causality between CO2 emissions and economic growth. Wang (Citation2014) examined the impact of urbanisation on residential energy consumption and production using time series data and showed that urbanization positively increases energy consumption. Sahar and Salim (Citation2014) discovered that total population, urbanization, and population density are significant factors influencing non-renewable energy consumption. In effect, the results of this study is consistent with the findings of the above authors hence we can conclude that in the long-run GDP, trade openness and urbanization positively impact on energy consumption. In addition, the relationship between financial development and energy consumption showed a significant negative relationship which justifies the proposition by Sadorsky (Citation2010). Sadorsky (Citation2010) found that the financial development of a country can increase the efficiency of the economy, allow a flow of financial capital, reduce financial risks, and increase financial transparency, which can increase consumption and fixed investments but can affect the energy demand. In terms of energy intensity, the results also showed a significant negative relationship between energy intensity and environmental tax, as shown in . Both the FMOLS and the DOLS indicate that growth in environmental taxes would decrease energy intensity by a certain margin. In effect, a percentage increase in environmental tax will reduce energy intensity by 0.21 per cent and 0.28 per cent, respectively. The results indicate that energy intensity can be controlled through the introduction of stricter environmental regulations and tax reforms. The coefficients of Urbanization and trade openness are significant and positively correlated with energy intensity, as shown in . These results are not surprising since urbanization, for instance, is expected to improve industrialisation structures and propel growth in energy consumption and energy intensity.Similarly, in the case of trade, it is expected that energy will affect trade significantly. Due to its importance in trade expansion, energy is an essential input needed to expand trade via increased exports and imports (Sadorsky, Citation2010). Hence, an improvement in trade will eventually translate into higher demand for energy. Hossain (Citation2011) found that trade reforms promote economic activities which contribute to higher energy demand. This underscores the crucial role played by energy demand for future production.
Table 6. Results of estimation
4.5. Decomposition of the environmental tax effect
To further explore the impact of environmental taxes on energy consumption, as stated in the objectives of this study, I decomposed the total environmental tax into the different tax categories (i.e. pollution tax, energy tax, resource tax and transport tax). The aim was to measure the individual tax effect on energy consumption and account for the difference between the total environmental tax effect and the individual environmental tax effect(see ). Apart from the Carbon tax, little attention has been devoted to the disaggregated taxes within the OECD. The same control variables were included as before; however, I present here the results without the control variables and given that the disaggregation of the tax revenue was not available for all countries, I employed fewer countries in some instances. Also, in this case, I utilize both the DOLS and the FMOLS in analysing the disaggregation effect of environmental taxes on energy consumption. The results from Table showed that energy taxes (including CO2 taxes) have a larger effect on energy consumption than pollution and transport taxes. This is not surprising since energy taxes constitute a larger share of the total environmental tax as compared to the other components. In effect, it can be noted that a 1% increase in energy tax revenue reduces energy consumption and energy intensity by 0.05% and 0.08%, respectively (using the FMOLS model).
Table 7. Disaggregation of environmental tax effect (long-run coefficients)
Consequently, these results confirm that in the long run, when energy tax (including CO2 taxes) is used as the fiscal policy instrument, we expect a negative relationship between energy taxes and energy consumption. Similar findings were reported by authors Kouvaritakis et al. (Citation2003), Niu et al. (Citation2018) and Djula (Citation2019). Kouvaritakis et al. (Citation2003) showed that an energy tax of 15€ per ton on CO2 reduce energy consumption by 1% and 2.7% of CO2 among EU countries. Similarly, Djula, for instance, found that a rise in energy tax will result in a decrease in final energy consumption and energy intensity. Concurring with Djula, Niu et al. (Citation2018) revealed that introducing clean energy to the market and reducing fossil fuel use are two ways that an energy tax can improve energy structure and reduce carbon emissions. The results of the study are therefore consistent with the findings of the authors stated above.
In the case of pollution taxes, the results showed a negative and significant effect on energy consumption and energy intensity, indicating that the marginal effect of a pollution tax on energy consumption is negative. Specifically, the coefficients of −0.0371**, −0.0621**, −0.0263**, and −0.0331** respectively were recorded for both energy consumption and energy intensity using both FMOLS and DOLS models. This finding is corroborated by Celil Aydin and Esen (Citation2018), Shi-Chun et al. (Citation2014) and Rapanos and Polemis (Citation2005), who showed that above a certain threshold, pollution taxes have a negative effect on CO2 emissions per capita, while they do not have any correlation below the threshold. Thus one can argue that environmental taxes discourage potentially harmful behaviour of the environment and help reduce the burden on the environment.
Furthermore, this study also reports a negative and insignificant effect of transport taxes on the overall energy consumption and intensity. The results seem to validate efforts that seek to project a proactive policy of emission reduction among most OECD countries using vehicle taxes. Consistent with our findings it has been shown by Klier and Linn (Citation2015) that vehicle taxes have a significant short-run negative effect on vehicle registrations and emissions reductions in all countries, although the impact of CO2-based taxes and subsidies was greater in France than in Germany and Sweden. Thus, demonstrating that taxing greenhouse gases acts as a price signal, which ensures that polluters factor in the environmental costs of pollution into their production decisions.
4.6. Causal relationship between energy consumption, energy intensity and environmental taxes
To estimate the causal relationship between the dependent and independent variables. I employed the pairwise Dumitrescu and Hurlin (Citation2012) panel granger causality test. The estimation results showed that there exist a bi-directional relationship between energy consumption and environmental taxes. Hence, we reject the null hypothesis of no relationship at the 5% significance level and argue that past values of energy consumption and environmental taxes were likely to influence each other.
4.7. Robustness checks
In this study, I incorporated several forms of robustness checks, which have been specified below
4.7.1. Using different proxy
One concern that came up in the composition of environmental tax revenues is the fact that the revenue could also be influenced by adjustments in other parts of the tax system or structural changes in the economy while keeping environmental policy unchanged, leaving the interpretation of environmental taxes misleading (Bruvoll, Citation2009). To address this concern, I further explore the impact of environmental taxes using total environmental taxes as a share of GDP as a proxy for environmental taxes and employed the FMOLS and DOLS models. Furthermore, I used the same control variables as in the previous estimation. The results in indicate a significant negative relationship between environmental taxes and energy consumption, thus confirming that an increase in environmental taxes will result in a decrease in energy consumption and energy intensity. On the other hand, it is noticed that with the exception of financial development and economic growth, controlling for trade and urbanization showed a negative but insignificant relationship to energy consumption. Thus this study can establish that irrespective of the composition of the environmental tax revenue, the impact on energy consumption remains the same.
Table 8. Estimation results (using Share of environmental tax to GDP as independent variable)
4.7.2. Using different estimation techniques
Furthermore, I also investigated whether different estimation techniques could render any different outcomes by using the dynamic panel estimation technique (GMM) and the quantile regression technique. The GMM method is advantageous because it assumes that a variable is endogenous with respect to the dependent variable and ensures that Strong consistency and asymptotically normality are presented by the GMM estimator (Arellano & Bond, Citation1991). Similarly, quantile regression methodology offers a significant advantage in that it can be used to analyze relationships outside the mean of the data, making it useful for analyzing outcomes with nonlinear relationships with their predictor variables. The results from the GMM estimation indicates that both energy consumption and energy intensity indicates positive but insignificant relationship with environmental taxes (see Appendix). The reason although not tested could be due to the presence of multi-collinearity. In contrast, the results from the quantile regression were deemed significant. From the Quantile regression results (see Appendix), both energy consumption and energy intensity are significant at both 25th quantiles (lower) and 75th and 90th quantiles, respectively. Thus, these results indicate that environmental taxes at the lower and upper quantiles can influence energy consumption and energy intensity.
Environmental taxes are therefore seen as an important tool within every facet of the economic sphere of OECD countries. These findings therefore shows that my model is robust and produced consistent estimates.
4.8. SECTION 5: Conclusion and policy implications
Almost all countries face climate change as one of their most significant challenges. Developing or developed countries have the same need to mitigate and adapt to the impacts of climate change. In terms of climate change adaptation, it is believed that developed countries are considered better able than developing countries. To mitigate the burden of climate change, developing countries have employed series of environmental protection policies, including environmental taxes. In order to combine economic efficiency and environmental protection, policymakers are increasingly pursuing sustainable economic practices that are aimed at combining economic efficiency and minimizing environmental impact.
This paper argues aimed to examine the impact of total environmental taxes on total energy consumption and energy intensity among OECD. The study also sought to examine the impact of the disaggregated environmental taxes on the overall energy consumption and energy intensity and to further estimate the causal relationship between total environmental taxes, energy consumption, and energy intensity among the OECD countries.
I employed the fully modified OLS and the dynamic OLS and data covering the period 1995–2014 and 35 OECD countries to investigate the impact of environmental taxes on energy consumption. The study accounted for several factors such as economic growth and financial risk, rise in urban population, and trade-in explaining the behaviour of energy consumption and intensity in the face of environmental taxes acting as policy instruments. Preliminary estimations techniques were undertaken, which include a cross-sectional dependence test to ensure I obtained consistent estimates. Furthermore, a stationary test was carried using four different unit root estimation techniques, and the result showed that most of the variables used were stationary at a level and first difference, which enabled the use of panel co-integration test. Pedroni and Westerlund co-integration tests were performed, and the results showed that there was the presence of co-integration; hence the null hypothesis of no co-integration was rejected. This set the pace for the deployment of FMOLS and DOLS estimation techniques for estimating the relationship between environmental taxes and energy consumption and energy intensity. From the results, environmental tax shows a negative effect on energy consumption in both the FMOLS and DOLS models, respectively, indicating that high levels of environmental tax revenues are associated with less energy consumption. However, it should also be noted that this results are inconsistent with some studies in the literature.
Similarly, the results also showed that there is a significant negative relationship between energy intensity and environmental tax.
The results further indicate that both energy consumption and energy intensity can be controlled through the introduction of stricter environmental regulations and tax reforms. It is also noticed that Urbanization and trade openness are significant and positively correlated with energy consumption and energy intensity. The results further explain that energy consumption also correlates positively with trade and economic growth in the long-run, since the coefficients are statistically different from zero. This is also true since energy serves as a catalyst for economic growth. Hence changes in energy consumption affect income. The results on the relationship between financial development and energy consumption showed a significant negative relationship which justifies the proposition by Sadorsky (Citation2010).
Subsequently,I explored the relationship between the various components of environmental taxes and energy consumption and energy intensity. It was discovered that energy taxes (including CO2 taxes) have a larger effect on energy consumption and energy intensity than pollution and transport taxes. In the case of pollution taxes, the results showed a negative and significant effect on both energy consumption and energy intensity. Furthermore, this study also reports a negative and insignificant effect of transport taxes on the overall energy consumption and energy intensity. Though previous studies have questioned the effectiveness of environmental taxes due to the inefficiencies, the findings of this paper show that, despite all that, environmental taxes are an effective tool. Thus, I conclude that environmental taxes have a significant impact on energy consumption among OECD member countries.
The study also concludes that there is a bidirectional impact between environmental taxes and energy consumption. Furthermore, it is noticed that energy taxes have an effective impact in reducing energy consumption. From the above findings this study can suggest that environmental taxes influence energy consumption and energy intensity among OECD countries. Considering these results it appears that environmental taxes may be having significant effect on reducing the climate change impact among OECD countries although the relationship with other taxes has to be taken into account. For instance, the negative impact of the pollution tax suggests that OECD countries are significantly adapting better strategies to reduce the effect from pollution. Also, these results indicate that environmental taxes can have a substantial effect when measured alongside other taxes, as measuring environmental taxes relative to total taxes has the most impact. However, a good policy mix must be reached in order to ensure effective use of environmental taxes and their impact on other taxes. The impact of financial development on energy consumption has also been strongly highlighted by this study. The results showed that investment in financial development reduces energy consumption. This underscores investment in the financial sector and energy friendly technologies which eventually help to reduce energy consumption by encouraging expenditure on low-emission products. Thus, by addressing distorted incentives, capacity gaps, and inadequate climate risk transparency and pricing, OECD countries will be able to fully account for long-term climate threats and opportunities, which prevent funding for low-emission, resilient infrastructure from being allocated. This study encountered various challenges that is worthy of note. Firstly, the porous nature of the environmental tax data limited the period of years that was initially anticipated to be covered in this study. Secondly, this study failed to captures uncertainties in the energy demand and the impact of prices . It is therefore recommended that further studies must be carried out to include current data where necessary and to include uncertainties in energy demand due to the high level of energy market liberalisations. Again, since environmental taxes act as policy instruments, there is the need to include several macroeconomics variable to ascertain the true effect of the environmental tax on the energy consumption and intensity on an economy.
Disclosure statement
No potential conflict of interest was reported by the author(s).
Additional information
Funding
References
- Abdullah, S., & Morley, B. (2014). Environmental taxes and economic growth: evidence from panel causality tests. Energy Economics, 42, 10. https://doi.org/10.1016/j.eneco.2013.11.013
- Adetutu, M., Odusanya, K., & Weyman-Jones, T. (2020). Carbon Tax and Energy Intensity: Assessing the Channels of Impact using UK Microdata. The Energy Journal, 41. https://doi.org/10.5547/01956574.41.2.made
- Ajayi, V., & Reiner, D. (2020). European industrial energy intensity: innovation, environmental regulation, and price effects. Energy Journal, 41(4). https://doi.org/10.5547/01956574.41.4.vaja
- Al-mulali, U., Gholipour Fereidouni, H., Lee, J. Y. M., & Normee Binti Che Sab, C. (2013). Exploring the relationship between urbanization, energy consumption, and CO2 emission in MENA countries. Renewable and Sustainable Energy Reviews, 23, 107–41. https://doi.org/10.1016/j.rser.2013.02.041
- Alola, A. A., & Ulrich Ti, D. (2021). Environmental Implication of Coal and Oil Energy Utilization in Turkey: Is the EKC Hypothesis Related to Energy?. Management of Environmental Quality, 32(3), 543–559. https://doi.org/10.1108/MEQ-10-2020-0220
- Arellano, M., & Bond, S. (1991). Some tests of specification for panel data: Monte carlo evidence and an application to employment equations. The Review of Economic Studies, 58(2), 277. https://doi.org/10.2307/2297968
- Aydin, C., & Esen, Ö. (2018). Does the level of energy intensity matter in the effect of energy consumption on the growth of transition economies? Evidence from dynamic panel threshold analysis. Energy Economics, 69, 185–195. https://doi.org/10.1016/j.eneco.2017.11.010
- Aydin, M., & Turan, E. Y. (2020). The influence of financial openness, trade openness, and energy intensity on ecological footprint: revisiting the environmental kuznets curve hypothesis for BRICS countries. Environmental Science and Pollution Research International, 27(34), 43233–43245. https://doi.org/10.1007/s11356-020-10238-9
- Bailey, I. (2002). European environmental taxes and charges: Economic theory and policy practice. Applied Geography (Sevenoaks, England), 22(3), 235–251. https://doi.org/10.1016/S0143-6228(02)00011-5
- Baltagi, B. H. (2005). Econometric Analysis of Panel Data (3rd ed.). John Wiley & Sons Inc. https://link.springer.com/content/pdf/10.1007/978-3-030-53953-5.pdf
- Baltagi, B. H. (2005). Econometric Analysis of Panel Data (3rd Ed.). John Wiley & Sons. https://link.springer.com/content/pdf/10.1007/978-3-030-53953-5.pdf
- Barro, R. J., & Xavier, S. (2003). Fifteen years of growth economics: What have we learnt?. http://www2.econ.iastate.edu/tesfatsi/negrowth.salaimartin.pdf
- Basak, G., & Das, S. (2017). Intercept homogeneity test for fixed effect models under cross- sectional dependence: Some insights. Journal of Econometric Methods, 6(1). https://doi.org/10.1515/jem-2015-0004
- Bashir, M. F., Benjiang, M., Shahbaz, M., Jiao, Z., & Xue, B. (2020). The nexus between environmental tax and carbon emissions with the roles of environmental technology and financial development. PloS One, 15(11), e0242412. https://doi.org/10.1371/journal.pone.0242412
- Bashir, M. F., Benjiang, M., Shahbaz, M., Shahzad, U., & Xuan Vinh, V. (2021). Unveiling the heterogeneous impacts of environmental taxes on energy consumption and energy intensity: Empirical evidence from OECD countries. Energy (Oxford, England), 226(120366), 120366. https://doi.org/10.1016/j.energy.2021.120366
- Baumann, F. (2008). Energy security as multidimensional concept. Centre for Applied Policy Research.
- Baumol, W. J., & Oates, W. E. (1988). Theory of environmental policy. Prentice Hall. https://doi.org/10.1017/CBO9781139173513
- Baumol, W. J., & Oates, W. E. (1988). The Theory of Environmental Policy (2nd ed.). Cambridge University Press. https://doi.org/10.1017/CBO9781139173513
- Baum, C. F., Schaffer, M. E., & Stillman, S. (2003). Instrumental variables and GMM: Estimation and testing. The Stata Journal, 3(1), 1–31. https://doi.org/10.1177/1536867X0300300101
- Bellard, C. (2012). Impacts of climate change on the future of biodiversity. Ecology. https://doi.org/10.1016/j.rser.2015.10.080
- Bilgili, F., Kocak, E., & Bulut, U. (2017). The dynamic impact of renewable energy consumption on CO2 emissions: A revisited environmental kuznets curve approach. Renewable and Sustainable Energy Reviews, 54, 838–845. https://doi.org/10.1016/j.rser.2015.10.080
- Borozan, D. (2019). Unveiling the heterogeneous effect of energy taxes and income on residential energy consumption. Energy Policy, 129, 13–22. https://doi.org/10.1016/j.enpol.2019.01.069
- Bozoklu, S., & Yilanci, V. (2013). Energy consumption and economic growth for selected OECD countries: Further evidence from the granger causality test in the frequency domain. Energy Policy, 63, 877–881.”. https://doi.org/10.1016/j.enpol.2013.09.037
- Bruvoll, A. (2009). Pricing of CO2 emissions in Norway, documents 16. Statistics Norway.
- Burnett, J. W., & Madariaga, J. (2017). The convergence of US State-level energy intensity. Energy Econ, 62(357). https://doi.org/10.1016/j.rser.2015.10.080
- Cadoret, I., & Padovano, F. (2016). The political drivers of renewable energies policies. Energy Economics, 56, 261–269. https://doi.org/10.1016/j.eneco.2016.03.003
- CCICED.2019. “China’s Green Prosperity Future – Environment, Energy and Economy”. http://www.cciced.net/cciceden/NEWSCENTER/CCICEDUpdate/2009n/201205/P020160810400936182963.pdf. Accessed on 17 September,2021
- Cetin, M., Ecevit, E., & Gokhan Yucel, A. (2018). The impact of economic growth, energy consumption, trade openness, and financial development on carbon emissions: empirical evidence from Turkey. Environmental Science and Pollution Research International, 25(36), 36589–36603. https://doi.org/10.1007/s11356-018-3526-5
- Chang, S.-C. (2015). Effects of financial developments and income on energy consumption. International Review of Economics & Finance, 35, 28–44. https://doi.org/10.1016/j.iref.2014.08.011
- Convery, F., McDonnell, S., & Ferreira, S. (2007). The most popular tax in Europe? Lessons from the Irish plastic bags levy. Environmental & Resource Economics, 38(1), 1–11. https://doi.org/10.1007/s10640-006-9059-2
- Cosmo, D., Valeria, & Hyland, M. (2013). Carbon tax scenarios and their effects on the Irish energy sector. Energy Policy, 59, 404–414. https://doi.org/10.1016/j.enpol.2013.03.055
- Cottrell, J., Schlegelmilch, K., Runkel, M., & Mahler, A. (2016). Environmental tax reform in developing, emerging and transition economies. Studies, 93. https://www.idos-research.de/uploads/media/Study_93.pdf
- Deng, X., & Huang, H. (2020). Green Tax Policy, Environmental Decentralization and Energy Consumption: Evidence from China. Modern Economy, 11, 1528–1543. https://doi.org/10.4236/me.2020.119109
- Djula, B. (2019). Unveiling the heterogeneous effect of energy taxes and income on residential energy consumption. Energy Policy, 129, 13–22. https://doi.org/10.1016/j.enpol.2019.01.069
- Dumitrescu, E.-I., & Hurlin, C. (2012). Testing for granger non-causality in heterogeneous panels. Economic Modelling, 29(4), 1450–1460. https://doi.org/10.1016/j.econmod.2012.02.014
- Dyduch, J., & Stabryła-Chudzio, K. (2019). Fiscal impacts of environmental tax reform in selected Eu member States. Ekonomia i ŚRODOWISKO, 1(68). https://doi.org/10.34659/xddw-ah43
- Enache, ca. 2020. Countries eye environmental taxation. Taxfoundation.Org. Tax Foundation. September 29, 2020. https://taxfoundation.org/countries-eye-environmental-taxation/
- European Environmental Agency (1996). Environmental Taxes Implementation and Environmental Effectiveness. Available at https://www.eea.europa.eu/publications/92-9167-000-6/download
- Eurostat. 2018. Environmental taxes in the EU. Eurostat. January 31, 2018. https://ec.europa.eu/eurostat/web/products-eurostat-news/-/ddn-20180131-1
- Feng, C., Shen, Q., Yi, J., Xu, T., Sai, L., Anthony, S. F. C., & Ming, X. (2018). Uncovering Urban Food-Energy-Water Nexus Based on Physical Input-Output Analysis: The Case of the Detroit Metropolitan Area. Applied Energy, 252(113422), 113422. https://doi.org/10.1016/j.apenergy.2019.113422
- Georgescu, A., Pendolovska, V., & Cabeça, J. C. (2010). Distribution of environmental taxes in Europe by tax payers in. https://www.intechopen.com/chapters/16281
- Ghali, K. H., & El-Sakka, M. I. T. (2004). Energy Consumption and Output Growth in Canada: A Multivariate Co-Integration Analysis. Energy Economics, 26, 225–238. https://doi.org/10.1016/S0140-9883(03)00056-2
- Ghali, K. H., & El-Sakka, M. I. T. (2004). Energy use and output growth in Canada: A multivariate cointegration analysis. Energy Economics, 26(2), 225–238. https://doi.org/10.1016/S0140-9883(03)00056-2
- Global Energy Trends 2021 : Consolidated Energy Statistics & World Trends 2021. n.d. Enerdata.Net. Accessed December 1, 2021. https://www.enerdata.net/publications/reports-presentations/world-energy-trends.html
- Grossman, G. M., & Krueger, A. B. (1995). Economic growth and the environment. The Quarterly Journal of Economics, 110(2), 353–377. https://doi.org/10.2307/2118443
- Guochang, F., Lixin, T., Min, F., Mei, S., Ruijin, D., & Menghe, L. (2013). Investigation of Carbon Tax Pilot in YRD Urban Agglomerations—Analysis and Application of a Novel ESER System with Carbon Tax Constraints. Energy Procedia, 88, 290–296. https://creativecommons.org/licenses/by-nc-nd/4.0
- Gustavo, M., Díaz, A., Puch, L., & Rodríguez, J. (2019). Economic growth, energy intensity and the energy mix. Energy Economics, 81, 1056–1077. https://doi.org/10.1016/j.eneco.2019.05.022
- Hajko, V. (2013). The energy-GDP nexus in EU countries. Energy Studies Review, 20(2), 2. https://doi.org/10.15173/esr.v20i2.546.
- Hajko, V. (2013). The Energy-GDP Nexus in EU Countries. Energy Studies Review, 20(2), 23–26. https://doi.org/10.15173/esr.v20i2.546
- Harding, M. (2014). Personal tax treatment of company cars and commuting expenses: Estimating the fiscal and environmental costs. OECD Taxation Working Papers, (20). https://doi.org/10.1787/22235558
- Hasanbeigi, A., & Price, L. (2012). A review of energy use and energy efficiency technologies for the textile industry. Renewable and Sustainable Energy Reviews, 16(6), 3648–3665. https://doi.org/10.1016/j.rser.2012.03.029
- Heidari, H., Babaei, B. S., & Ebrahimi, T. (2016). Energy intensity of GDP: A nonlinear estimation of determinants in Iran. International Journal of Economics and Management Studies, 1(2). https://mpra.ub.uni-muenchen.de/79237/1/khu-eco-v1n2p1-en.pdf
- He, P., Ning, J., Yu, Z., Xiong, H., Shen, H., & Jin, H. (2019). Can environmental tax policy really help to reduce pollutant emissions? An empirical study of a panel ARDL model based on OECD countries and China. Sustainability, 11(16), 4384. https://doi.org/10.3390/su11164384
- Hoang, B. N., & Ho, M. N. (2019). Energy consumption - economic growth nexus in Vietnam: An ARDL approach with a structural break. Journal of Asian Finance, Economics and Business, 7: 1, 101–109. https://doi.org/10.13106/jafeb.2020.vol7.no1.101
- Hossain, M. S. (2011). Panel estimation for CO2 emissions, energy consumption, economic growth, trade openness and urbanization of newly industrialized countries. Energy Policy, 39(11), 6,991–6,999. https://doi.org/10.1016/j.enpol.2011.07.042
- Huang, J., Liu, F., & Xie, J. 2016. A method for determining the energy consumption of machine tools in the spindle start-up process before machining. Proceedings of the Institution of Mechanical Engineers, Part B: Journal of Engineering Manufacture 230 (9): 1639–1649.
- Im, K. S., Hashem Pesaran, M., & Shin, Y. (2003). Testing for unit roots in heterogeneous panels. Journal of Econometrics, 115(1), 53–74. https://doi.org/10.1016/S0304-4076(03)00092-7
- Institute of Fiscal Studies,IFS (2011) The distributional consequences of environmental taxes. Available at https://ifs.org.uk/publications/distributional-consequences-environmental-taxes
- International Energy Agency. (2017). Energy Efficiency 2017. OECD.
- International Energy Agency. (2021). Global Energy and Climate Model. Documentation. https://iea.blob.core.windows.net/assets/2db1f4ab-85c0-4dd0-9a57-32e542556a49/GlobalEnergyandClimateModelDocumentation2022.pdf:
- Jamshidi, M. (2008). An analysis of residential energy intensity in Iran, a system dynamics approach (pp. 20–24). https://mpra.ub.uni-muenchen.de/id/eprint/79237
- Jiankun, H., Lanlan, L., & Wang, H. (2019). The win-win pathway of economic growth and CO2 emission reduction: A case study for China. China Population Resources and Environment, 1–12. https://doi.org/10.1080/10042857.2019.1574485
- Kao, C. D., & Chiang, M.-H. (2000). On the estimation and inference of a cointegrated regression in panel data. SSRN Electronic Journal. https://doi.org/10.2139/ssrn.1807931.
- Kao, C., & Chiang, M. H. (2000). On the Estimation and Inference of a Cointegrated Regression in Panel Data. In B. Baltagi (Ed.), Nonstationary Panels, Panel Cointegration, and Dynamic Panels (Advances in Econometrics). JAI Press.
- Khan, I., & Hou, F. (2021). Does multilateral environmental diplomacy improve environmental quality? The case of the United States. Environmental Science and Pollution Research International, 28(18), 23310–23322. https://doi.org/10.1007/s11356-020-12005-2
- Khan, M. K., Teng, J.-Z., Imran Khan, M., & Owais Khan, M. (2019). Impact of globalization, economic factors and energy consumption on CO2 emissions in Pakistan. The Science of the Total Environment, 688, 424–436. https://doi.org/10.1016/j.scitotenv.2019.06.065
- Kingston, S. (2020). The polluter pays principle in EU climate law: An effective tool before the courts? Climate Law, 10(1), 1–27. https://doi.org/10.1163/18786561-01001001
- Klier, T., & Linn, J. (2015). Using taxes to reduce carbon dioxide emissions rates of new passenger vehicles: evidence from France, Germany, and Sweden. American Economic Journal. Economic Policy, 7(1), 212–242. https://doi.org/10.1257/pol.20120256
- Knigge, M. (2005) “Effects of Germany's Ecological Tax Reforms” available at https://www.ecologic.eu/1156
- Koengkan, M. (2018). The positive impact of trade openness on consumption of energy: Fresh evidence from Andean community countries. Energy (Oxford, England), 158, 936–943. https://doi.org/10.1016/j.energy.2018.06.091
- Kotnik, Ž., Klun, M., & Škulj, D. (2014). The effect of taxation on greenhouse gas emissions. Transylvanian Review of Administrative Science, 10(43), 168–185. http://rtsa.ro/tras/
- Kouvaritakis, N., Paroussos, L., & Regemorter, D. (2003). The macroeconomic evaluation of energy tax policies within the EU, with the GEM-E3-Europe model. Directorate General Taxation and Customs. https://ec.europa.eu/taxation_customs/sites/taxation/files/resources/documents/economictaxation_final_report.pdf
- Labandeira, X., & Labeaga, J. (2005). Combining input-output analysis and micro-simulation to assess the effects of carbon taxation on Spanish households. Fiscal Studies, 20(3), 305–320. https://doi.org/10.3390/su12010350
- Labeaga, J. M., & Labandeira, X. (2019). Environmental taxes Economics of Environmental Taxes and Green Tax Reforms. Sustainability, 12(350), 1–3. https://doi.org/10.3390/su12010350
- Levin, A., Lin, C. F., & Chu, C. S. J. (2002). Unit Root Tests in Panel Data: Asymptotic and Finite-Sample Properties. Journal of Econometrics, 108, 1–24. https://doi.org/10.1016/S0304-4076(01)00098-7
- Lin, B., & Xuehui, L. (2011). The effect of carbon price on per capita CO2 emissions. Energy Policy, 39(9), 5137–5146. https://doi.org/10.1016/j.enpol.2011.05.050
- Liobikienė, G., Butkus, M., & Matuzevičiūtė, K. (2019). The contribution of energy taxes to climate change policy in the European Union (EU). Resources, 8(2), 63. https://doi.org/10.3390/resources8020063
- Maddala, M. (1999). On the use of panel data methods with cross-country data. Annales d’Économie et de Statistique, 55(55/56), 429–449. n ±. https://doi.org/10.2307/20076206.
- Maddala, G. S., & Shaowen, W. (1999). A comparative study of unit root tests with panel data and a new simple test. Oxford Bulletin of Economics and Statistics, 61(S1), 631–652. https://doi.org/10.1111/1468-0084.0610s1631
- Madlener, R., & Sunak, Y. (2011). Impacts of urbanization on urban structures and energy demand: What can we learn for urban energy planning and urbanization management? Sustainable Cities and Society, 1(1), 45–53. https://doi.org/10.1016/j.scs.2010.08.006
- Maeso-Fernandez, F., Osbat, C., & Schnatz, B. (2004). Towards the estimation of equilibrium exchange rates for transition economies: Methodological issues and a panel cointegration perspective. Journal of Comparative Economics, 34(3), 499–517. https://doi.org/10.1016/j.jce.2006.05.003
- Maeso-Fernandez, F., Osbat, C., & Schnatz, B. (2004). Towards the estimation of Equilibrium Exchange Rates for Transition Economies: Methodological Issues and a Panel Cointegration Perspective. Journal of Comparative Economics, 34(3), 499–517. https://doi.org/10.1016/j.jce.2006.05.003
- Ma, X., & Fu, Q. (2020). The Influence of Financial Development on Energy Consumption: Worldwide Evidence. International Journal of Environmental Research and Public Health, 17 (4), 1428. https://doi.org/10.3390/ijerph17041428.
- Magazzino, C. (2016). The relationship between CO2 emissions, energy consumption and economic growth in Italy. International Journal of Sustainable Energy, 35(9), 844–857. https://doi.org/10.1080/14786451.2014.953160
- Mahmood, T., & Ahmad, E. (2018). The relationship of energy intensity with economic growth: Evidence for European economies. Energy Strategy Reviews, 20, 90–98. https://doi.org/10.1016/j.esr.2018.02.002
- Mark, N., & Sul, D. (2003). Cointegration Vector Estimation by Panel DOLS and Long-Run Money Demand. Oxford Bulletin of Economics and Statistics, 65, 655–680. https://doi.org/10.1111/j.1468-0084.2003.00066.x
- Massimo, F., & Hunt, L. C. (2011). Energy demand and energy efficiency in the OECD countries: A stochastic demand frontier approach. Energy Journal, 32, 2. https://doi.org/10.5547/0195-6574-ej-vol32-no2-3
- Metcalf, G. E., & Weisbach, D. A. (2009). Design of a carbon tax. SSRN Electronic. Journal. https://doi.org/10.2139/ssrn.1324854.
- Metcalf, G. E., & Weisbach, D. A. (2009). Design of a Carbon Tax. SSRN Electronic, Journal. https://doi.org/10.2139/ssrn.1324854
- Mielnik, O., & Goldemberg, J. (2002). Foreign direct investment and decoupling between energy and gross domestic product in developing countries. Energy Policy, 30(2), 87–89. https://doi.org/10.1016/S0301-4215(01)00080-5
- Mishra, V., Sharma, S., & Smyth, R. (2009). Are fluctuations in energy consumption per capita transitory? Evidence from a panel of pacific Island countries. Energy Policy, 37(6), 2318–2326. https://doi.org/10.1016/j.enpol.2009.02.022
- Morley, B. (2012). Empirical evidence on the effectiveness of environmental taxes. Applied Economics Letters, 19(18), 1817–1820. https://doi.org/10.1080/13504851.2011.650324
- Mudakkar, S., Zaman, K., Shakir, H., Arif, M., Naseem, I., & Naz, L. (2013). Determinants of energy consumption function in SAARC countries: Balancing the odds. Renewable and Sustainable Energy Reviews, 28, 566–574. https://doi.org/10.1016/j.rser.2013.08.006
- Nanduri, M. (1998). An assessment of energy intensity indicators and their role as policy- making tools. Simon Fraser University.
- Nasreen, S., & Anwar, S. (2014). Causal relationship between trade openness, economic growth and energy consumption: A panel data analysis of Asian countries. Energy Policy, 69, 82–91. https://doi.org/10.1016/j.enpol.2014.02.009
- Nell, C., & Zimmermann, S. (2011). Summary based on chapter 12 of baltagi: Panel unit root tests. Department of Economics at University of Vienna.
- Niu, T., Yao, X., Shao, S., Li, D., & Wang, W. (2018). Environmental tax shocks and carbon emissions: An estimated DSGE model. Structural Change and Economic Dynamics, 47, 9–17. https://doi.org/10.1016/j.strueco.2018.06.005
- OECD.2004. Environmentally related taxes. https://www.oecd.org/greengrowth/tools-evaluation/environmentallyrelatedtaxesdatabase.htm. Accessed on 17 September,2021
- OECD .2006. The political economy of environmentally related taxes.
- OECD.2010. Taxation, innovation and the environment. https://www.oecd.org/greengrowth/tools.evaluation/taxationinnovationandtheenvironment.htm
- OECD. (2011). environmental taxation a guide for policy makers. https://www.oecd.org/env/toolsevaluation/48164926.pdf
- OECD.2015. Energy Efficiency in the Steel Sector: Why It Works Well, But Not Always. Available at https://one.oecd.org/document/DSTI/SU/SC()6/en/pdf
- OECD. 2019. Taxing energy use for sustainable development opportunities for energy tax and subsidy reform in selected developing and emerging economies. https://www.oecd.org/tax/tax-policy/taxing-energy-use-for-sustainable-development.pdf
- OECD . 2020. Revenue statistics 2020. https://www.oecd.org/ctp/revenue-statistics-2522770x. Accessed on 20.09.2021
- Omri, A., Daly, S., Rault, C., & Chaibi, A. (2015). Financial Development Environmental quality, trade and economic growth: What causes what in MENA countries. Energy Economics, 48. (242–252). https://doi.org/10.1016/j.eneco.2015.01.008
- Pedroni, P. (1999). Critical values for cointegration tests in heterogeneous panels with multiple regressors. Oxford Bulletin of Economics and Statistics, 61(s1), 653–670. https://doi.org/10.1111/1468-0084.61.s1.14
- Pedroni, P. (2000). Fully Modified OLS for Heterogeneous Cointegrated Panels. Advances in Econometrics, 15, 93–130. https://doi.org/10.1016/S0731-9053(00)15004-2
- Pedroni, P. (2004). Panel cointegration: asymptotic and finite sample properties of pooled time series tests with an application to the Ppp hypothesis. Econometric Theory, 20(3), 03. https://doi.org/10.1017/s0266466604203073
- Pesaran, M. H., Shin, Y., & Smith, R. P. (1999). Pooled Mean Group Estimation of Dynamic Heterogeneous Panels. Journal of the American Statistical Association, 94(446), 621–634. https://doi.org/10.2307/2670182
- Phillips, P. C. B., & Perron, P. (1988). Testing for unit roots in time series regression. Biometrika, 75(2), 335–346. https://doi.org/10.1093/biomet/75.2.335
- Phillips, P., & Sul, D. (2003). Dynamic Panel Estimation and Homogenity Testing Under Cross Section Dependence. Cowles Foundation, Yale University, Cowles Foundation Discussion Papers. 6. https://doi.org/10.1111/1368-423X.00108.
- Poumanyvong, P., & Kaneko, S. (2010). Does urbanization lead to less energy use and lower CO2 emissions? A cross-country analysis. Ecological Economics, 70(2), 434–444. https://doi.org/10.1016/j.ecolecon.2010.09.029
- PricewaterhouseCoopers. n.d. Global Automotive Tax Guide 2018. Pwc.De. Accessed December 1, 2021. https://www.pwc.de/en/automotive-industry/global-automotive-tax-guide-2018.html
- Rafindadi, A. A., & Ozturk, I. (2017). Impacts of renewable energy consumption on the German economic growth: Evidence from combined cointegration test. Renewable and Sustainable Energy Reviews, 75, 1130–1141. https://doi.org/10.1016/j.rser.2016.11.093
- Rafiq, S., Bloch, H., & Salim, R. (2014). Determinants of renewable energy adoption in China and India: A comparative analysis. Applied Economics, 46(22), 2700–2710. https://doi.org/10.1080/00036846.2014.909577
- Rafiq, S., Bloch, H., & Salim, R. (2014). Determinants of Renewable Energy Adoption in China and India: A Comparative Analysis. Applied Economics, 46(22), 2700–2710. https://doi.org/10.1080/00036846.2014.909577
- Rapanos, V. T., & Polemis, M. L. (2005). Energy demand and environmental taxes: The case of Greece. Energy Policy, 33(14), 1781–1788. https://doi.org/10.1016/j.enpol.2004.02.013
- Rashid, A., & Yousaf, N. (2015). Linkage of financial development with electricity growth, nexus of India and Pakistan. Macroeconomics and Monetary Economics, 2(34), 151–160. http://journals.univ-danubius.ro/index.php/euroeconomica/article/view/3037
- Runkel, M., & Mahler, A. (2018). A comparison of CO2-based car taxation in EU-28, Norway and Switzerland. Green Budget Germany.
- Saboori, B., Sapri, M., & Baba, M. (2014). Economic growth, energy consumption and CO2 emissions in OECD (Organization for economic co-operation and development)’s transport sector: A fully modified bi-directional relationship approach. Energy, 66. https://doi.org/10.1016/j.energy.2013.12.048
- Sadorsky, P. (2010). The impact of financial development on energy consumption in emerging economies. Energy Policy, 38(5), 2528–2535. https://doi.org/10.1016/j.enpol.2009.12.048
- Sadorsky, P. (2011). Trade and Energy Consumption in the Middle East. Energy Economics, 33(5), 739–749. https://doi.org/10.1016/j.eneco.2010.12.012
- Sahar, S., & Salim, R. A. (2014). Non-renewable and renewable energy consumption and CO2 emissions in OECD countries: A comparative analysis. Energy Policy, 66, 547–556. https://doi.org/10.1016/j.enpol.2013.10.064
- Santamouris, M. (2018). Minimizing Energy Consumption, Energy Poverty and Global and Local Climate Change in the Built Environment: Innovating to Zero.Casualties and Impacts in a Zero-Concept World.University of New. https://doi.org/10.1016/C2016-0-01024-0
- Schlegelmilch, K., & Joas, A. (2015). Fiscal Considerations in the Design of Green Tax Reforms. GGKP Research Committee on Fiscal Instruments. https://www.greengrowthknowledge.org/sites/default/files/Schlegelmilch_Fiscal_considerations_in_the_design_of_green_tax_reforms.pdf
- Sebastian, M., & Vela, M. A. (2013). Are environmentally related taxes effective? SSRN Electronic. Journal. https://doi.org/10.2139/ssrn.2367708.
- Shahbaz, M., Muhammad Adnan Hye, Q., Kumar Tiwari, A., & Carlos Leitão, N. (2013). Economic growth, energy consumption, financial development, international trade and CO2 emissions in Indonesia. Renewable and Sustainable Energy Reviews, 25, 109–121. https://doi.org/10.1016/j.rser.2013.04.009
- Shahbaz, M., & Ozturk, I. (2017). Does urbanization cause increasing energy demand in Pakistan? Empirical evidence from STIRPAT model. Energy, Elsevier, 122(C), 83–93. https://ideas.repec.org/a/eee/energy/v122y2017icp83-93.html
- Shahbaz, M., Shamim, S. M. A., Aamir, N., Shahbaz, M. M., Mahalick, H. M. K., & Sadorsky, P. (2010). Macroeconomic environment and financial sector’s performance: Econometric evidence from three traditional approaches. IUP J. Financ. Econ, 1–2, 103–123. https://icrier.org/pdf/Aamir%20Shamim-Paper.pdf
- Shahzad, U. (2020). Environmental taxes, energy consumption, and environmental quality: Theoretical survey with policy implications. Environmental Science and Pollution Research International, 27(20), 24848–24862. https://doi.org/10.1007/s11356-020-08349-4.%20.
- Shi-Chun, X., Zheng-Xia, H., & Long, R.-Y. (2014). Factors that influence carbon emissions due to energy consumption in China: Decomposition analysis using LMDI. Applied Energy, 127, 182–193. https://doi.org/10.1016/j.apenergy.2014.03.093
- Silajdzic, S., & Mehic, E. (2019). Absorptive capabilities, FDI, and economic growth in transition economies. Emerging Markets Finance and Trade, 52(4), 904–922. https://doi.org/10.1080/1540496X.2015.1056000
- Sintayehu, D. W. (2018). Impact of climate change on biodiversity and associated key ecosystem services in Africa: A systematic review. Ecosystem Health and Sustainability, 4(9), 9, 225–239. https://doi.org/10.1080/20964129.2018.1530054
- Sönnichsen, N. (2020). Change in primary energy demand globally by fuel. https://www.statista.com/statistics/1114717/change-in-primary-energy-demand-globally-by-fuel/
- Sterner, T. (2007). Fuel taxes: An Important instrument for climate policy. Energy Policy, 35(6), 3194–3202. https://doi.org/10.1016/j.enpol.2006.10.025
- Stock,J.H. & Watson, M W.(2012).Has the Business Cycle Changed and Why?.NBER Macroeconomics Annual ,17. http://www.nber.org/books/gert03-1
- Sundqvist, P. (2007). “Do energy taxes decrease carbon dioxide emissions?” Nationalekonomiska institutionen.
- Suphi, S., & Herman, V. (2018). The effectiveness of taxing the carbon content of energy consumption. Journal of Environmental Economics and Management, 92, 74–99. https://doi.org/10.1016/j.jeem.2018.08.017
- Țibulcă, I.-L. (2021). Debt sustainability: can EU member states use environmental taxes to regain fiscal space? Sustainability, 13(11), 5952. https://doi.org/10.3390/su13115952
- Ulucak, R., Koçak, E., Erdoğan, S., & Kassouri, Y. (2020). Investigating the non-linear effects of globalization on material consumption in the EU countries: Evidence from PSTR estimation. Resources Policy, Elsevier, 67(C). https://ideas.repec.org/a/eee/jrpoli/v67y2020ics0301420720300921.html
- Umer, S. (2020). Environmental taxes, energy consumption, and environmental quality: Theoretical survey with policy implications. Environmental Science and Pollution Research. https://doi.org/10.1007/s11356-020-08349-4
- UNDP (2018) Long-Term Low Greenhouse Gas Emission Development Strategies. Input Document for the G20 Climate Sustainability Working Group. A paper prepared by World Resources Institute and the United Nations Development Programme for the G20 Climate Sustainability Working Group under the Argentine G20 Presidency. undp-ndcsp-greenhouse-gas-emission-strategies-report–2018. World Resources Institute. https://www.argentina.gob.ar/sites/default/files/wri_-_long-term_low_greenhouse_gas_emission_development_strategies.pdf
- Wang, X., Xu, J., Zhu, M., & Yang, Y. (2021). Environmental regulation and corporate tax avoidance—evidence from China. Plos One, 17(1), e0261037. https://doi.org/10.1371/journal.pone.0261037
- Wang, Z., Zhang, B., Yin, J., & Li, G. (2014). Determinants of energy-saving behavioral intention among residents in Beijing: Extending the theory of planned behavior. Journal of Renewable and Sustainable Energy, 6, 053127. https://doi.org/10.1063/1.4898363
- Westerlund, J. (2007). Testing for error correction in panel data. Oxford Bulletin of Economics and Statistics, 69(6), 709–748. https://doi.org/10.1111/j.1468-0084.2007.00477.x
- Wilson, J. D. (1999). Theories of tax competition. National Tax Journal, 52(2), 269–304. https://doi.org/10.1086/NTJ41789394
- Wissema, W., & Dellink, R. (2007). AGE analysis of the impact of a carbon energy tax on the Irish economy. Ecological Economics, Elsevier, 61(4), 671–683. https://econpapers.repec.org/scripts/redir.pf?u=http%3A%2F%2Fwww.sciencedirect.com%2Fscience%2Farticle%2Fpii%2FS0921-8009%2806%2900459-9;h=repec:eee:ecolec:v:61:y:2007:i:4:p:671-683
APPENDIX A
Table A1. Descriptive statistics
APPENDIX B
Table B1. Quantile regression estimates (dependent variable: energy consumption)
APPENDIX C
Table C1. Quantile regression estimates (dependent variable: energy intensity)
Table C2. Panel generalized methods of moments Dependent variable: Energy Intensity
Table C3. Panel generalized methods of moments. dependent variable: energy consumption
APPENDIX F
Relationship between energy consumption and environmental taxes