
 ?Mathematical formulae have been encoded as MathML and are displayed in this HTML version using MathJax in order to improve their display. Uncheck the box to turn MathJax off. This feature requires Javascript. Click on a formula to zoom.
Abstract
This study investigated the impact of investor sentiment impact on sectoral returns and their volatility on the Johannesburg Stock Exchange using a proxy-based composite investor sentiment index and generalised autoregressive conditional heteroscedasticity models. Overall, findings showed a negative relationship between prevailing sentiment and subsequent returns and a positive relationship between investor sentiment and sector returns volatilities. Additionally, there was evidence of variability of sentiment effects on the sector returns and volatilities. Accordingly, firms that raise financing through the stock market, portfolio managers with investments thereon and policymakers seeking to ensure that markets operate efficiently need to consider the impact of market-wide investor sentiment on volatility and returns.
Public interest statement
In this study, the authors sought to ascertain whether investor sentiment, an amalgam of investors’ various behavioural biases, has any explanatory power on the returns and volatility of different sector indices from the South African market. As there is no universally accepted measure of investor sentiment, the authors constructed a composite index using various proxies shown to be indicative of prevailing investor sentiment in literature. For the method of analysis, the generalised autoregressive conditional heteroscedasticity (GARCH) models were used due to their popularity in modelling stock market volatility. The results indicated that investor sentiment does have a degree of explanatory power on the returns and volatilities of the sector indices. However, the impact seems to be sector-dependent. These findings have implications for investors, firms and policymakers.
1. Introduction
In the classical financial theory, particularly the efficient market hypothesis, security prices are said to always reflect all available market information as investors are assumed to be generally rational (Fama, Citation1970; C. Huang et al., Citation2014). This theory also asserts that irrational investors trade randomly. Therefore, their impact on the pricing of financial market securities is short-lived and the short-term mispricing they cause is rapidly arbitraged away by their rational counterparts (Huang & Fang, Citation2021). However, the theory has faced substantial criticism due to the understanding that investors are not consistently rational but subject to behavioural biases. This has resulted in the emergence of a new paradigm in finance, termed behavioural finance, which refers to the study of how psychology and behavioural biases impact investment decisions (Zahera & Bansal, Citation2018). The incidence of suboptimal decisions on a large scale due to behavioural bias-driven investors trading in concert may result in significant mispricing, which may turn into long-term incongruous pricing patterns termed financial market anomalies ().
In recent decades, particular attention has fallen on investor sentiment which, according to Baker and Wurgler (Citation2006), refers to general investors’ expectations about future cash flows and risks of financial assets that are not based on fundamental information but noise. This definition accords with Rupande et al. (Citation2019) who described the phenomenon as an amalgam of behavioural biases that influence investors’ decision-making. Kurov (Citation2010) explains that investor sentiment manifests in asset pricing through trading activity; rising and falling prices indicate bullish and bearish sentiment, respectively. This observation is consistent with the early work of Keynes (Citation1936), who argued that asset prices fluctuate wildly owing to the effects of investors’ animal spirits. Therefore, a significant incidence of sentiment-driven investors who trade in concert can cause protracted mispricing of securities (De Long et al., Citation1990). Accordingly, Baker and Wurgler (Citation2007) explained that the focus should be shifted from determining whether sentiment affects prices to determining how to measure the phenomenon and quantify its effects.
High sentiment periods often exhibit high volatility and a distorted price discovery process (Lin et al., Citation2018). These periods attract overoptimistic noise traders who under-assess risk due to the positive outlook, lower risk aversion and overreliance on recent non-fundamental data, all of which result in overpricing of financial assets and, in the worst-case scenarios, the development of pricing bubbles (Chiang et al., Citation2011; Shen et al., Citation2017). The mean reversion of sentiment and the bursting of the pricing bubbles increases volatility on markets. Even with the enduring argument that sentiment effects are transient due to rational arbitrageurs, there are substantial constraints to arbitrage—trading costs, taxation costs, information asymmetries and limited liquidity—that erode the ability of rational arbitrageurs to drive away sentiment traders. Thus, sentiment effects can persist for a long time. However, in low sentiment periods characterised by a negative outlook, their incidence is low because of their reluctance to take on short positions (Uygur & Taş, Citation2014b). Thus, only predominantly rational, utility-maximising, and risk-averse traders remain on markets.
It is, therefore, unsurprising that investor sentiment has been linked to stock market returns. For example, Baker and Wurgler (Citation2006) found that the returns of securities of which valuations are highly subjective and difficult to arbitrage were higher following low sentiment periods than high sentiment periods. Da et al. (Citation2011) found that their new and direct measure of investor attention timely captured investor attention. An increase in the measure predicted higher stock prices in the subsequent two weeks and an eventual price reversal within the year. It also predicted first-day return and long-run underperformance of IPO stocks. Zouaoui et al. (Citation2011) found a link between financial market crisis returns and sentiment in the fifteen countries. The effect was more significant on stock markets with investors that were prone to herding and overreaction. Sprenger et al. (Citation2014) found an association between sentiment expressed in tweets on the social media platform and stock returns, message volume and trading volume, as well as disagreement and volatility. They also found that users providing above-average investment advice are retweeted more often and have more followers.
Dalika and Seetharam (Citation2015) reported a significant effect of sentiment on the cross-section of returns in South Africa. When sentiment is low, subsequent returns are relatively high on smaller stocks, high volatility stocks, extreme growth stocks, and young stocks and vice versa. Green and Hudson (Citation2015) found that United States investor sentiment was highly significant in explaining the United Kingdom s equity returns. They also found that sentiment was a more significant determinant of returns in the period immediately preceding a crisis than at other times. Sayim and Rahman (Citation2015) found that unexpected changes in investor sentiment have a significant positive impact on Turkish returns and a negative significant effect on volatility. This indicates that optimism creates positive expectations and reduces uncertainty and volatility of stock market returns. Sayim and Rahman (2015b) found a significant spillover effect of U.S. investor sentiment on stock return and volatility in Turkey, with the impact of institutional sentiment greater than that of individual sentiment and the effect of rational sentiment faster than that of irrational sentiment.
Naik and Padhi (Citation2016) found that sentiment significantly influences market excess returns in India. However, there was a bi-directional causality between excess return and investor sentiment at the third lag. Further, positive and negative sentiments had asymmetric impacts on return volatility. Ryu et al. (Citation2017) found that high investor sentiment induces higher stock market returns on the Korean market. They also found that institutional trades are positively associated with stock returns, suggesting the information of institutional investors. The opposite was true for individual trades. Kim et al. (Citation2019) found that investor sentiment becomes pessimistic prior to bad news being released, significantly affecting the response of stock returns to downgrade announcements on the Korean stock market. Wang, Su, et al. (Citation2022) confirmed a conditional impact of investor sentiment on stock returns via direct and indirect channels: In bull regimes, optimistic shifts in investor sentiment would increase stock returns, while in bear regimes, optimistic shifts would decrease stock returns. The opposite was true for pessimistic shifts.
Chakraborty and Subramaniam (Citation2020) found that investor sentiment caused stock returns at extreme quantiles in India. Lower sentiment induced fear-induced selling, thereby lowering the returns and high sentiment is followed by lower future returns as the market reverts to fundamentals. McGurk et al. (Citation2020) found that their investor sentiment measure has a positive and significant effect on abnormal stock returns on the US market. These findings were consistent across several different models and specifications, providing further evidence against non-behavioural theories. Phuong (Citation2020) found that the influence of investor sentiment to return stocks on the Vietnamese stock market was significant. The study also found that the effect of firm size on stock returns was more pronounced when investor sentiment was used in research models. Al-Nasseri et al. (Citation2021) found that the effects of sentiment are heterogeneous throughout the return distribution on the US market. Sentiment was positively contemporaneously associated with stock returns at higher quantiles, but it was a negative predictor of future returns at lower quantiles.
Fu et al. (Citation2021) found a significant positive relationship between firm-specific investor sentiment and stock price crash risk. The positive relationship was found to be robust to different measures of crash risk and more pronounced for low liquidity firms. Zhang et al. (Citation2021) found that higher firm-specific investor sentiment induces lower stock price synchronicity, which shows that low-price synchronicity represents high-price informativeness. They also found a negative relationship between price synchronicity and future crash risk, suggesting that return comovement is associated with noise. Obaid and Pukthuanthong (Citation2022), using an investor sentiment index obtained from news photos, found that photo pessimism predicts market return reversals and trading volume. The relation was strongest among stocks with high limits to arbitrage and during periods of elevated fear. Abdul Karim et al. (Citation2022) found that market sentiment indices strongly and positively influenced firms’ equity returns in Malaysia. Excellent market sentiment encouraged a bullish strategy, increasing share prices and, consequently, stock returns.
Sentiment has also been linked to volatility. For example, Baker et al. (Citation2012) found that investor sentiment had an essential role in market volatility across seven developed countries’ markets through private capital flows. Uygur & Taş, Citation2014a) reported a negative relationship between sentiment and future returns and an asymmetric effect of sentiment on market volatility in the United States, Japan, Hong Kong, London, France, and Germany. Kumari and Mahakud (Citation2016) found definitive evidence that investor sentiment drove stock conditional market volatility in India. López-Cabarcos et al. (Citation2017) found that the sentiment of non-technical investors influences market risk, their experience and their holding period. This reveals that investor profile is important when trying to understand the influence of sentiment on the stock market. Qadan (Citation2019) found that investor sentiment influences risk appetite which occupies a significant role in the relationship between expected returns and idiosyncratic volatility. Specifically, when risk appetite increases, there is a shift from safer to more speculative stocks.
Rupande et al. (Citation2019) reported a significant connection between investor sentiment and stock return volatility in South Africa. Reis and Pinho (Citation2020a) established a link between their global sentiment index and the conditional market volatility on the European and American markets. Jiang and Jin (Citation2021) found that sentiment positively influences stock return volatility in China, both temporally and spatially. Idilbi-Bayaa and Qadan (Citation2022) found prominent non-random movement patterns of volatility mainly on Mondays and Fridays which they linked to rational and irrational drivers on the US market that included sentiment. Gao et al. (Citation2022) found that sentiment had a significant positive impact on realised, continuous, and jump volatilities in China. Further, investor sentiment was found to influence volatilities through the volume-synchronised probability of informed trading. Gong et al. (Citation2022) found that their sentiment index predicted volatility. This was the case in both non-crisis and crisis periods.
Various other authors have established a connection between investor sentiment and various pricing anomalies, leading to the blame being shifted to asset pricing models. Avramov and Chordia (Citation2006), for example, argued that the capital asset pricing model (CAPM) beta cannot fully capture all the systematic risk of an asset. Thus, abnormal returns are simply compensation for this salient risk that the beta fails to capture. Replacement models such as the Intertemporal CAPM (Merton, Citation1973), the Arbitrage Pricing Theory (Ross, Citation1976) and the Consumption CAPM (Lucas, Citation1978) have been developed based on this assertion. However, introducing models that do not incorporate behavioural factors in their formulations is futile. Rupande et al. (Citation2019) held that financial market anomalies are too significant to be dismissed as model inadequacy. This could be why these subsequent models have not been able to fully replace the original CAPM formulation. The argument that the continued reporting of pricing anomalies on financial markets is a result of behavioural biases, among which is investor sentiment, cannot, therefore, be dismissed (Kapoor & Prosad, Citation2017).
In this regard, Ali and Gurun (Citation2009) found that for small stocks mispricing per unit of accruals was greater in high-sentiment periods as compared with low-sentiment periods. This result is consistent with the assumption that in high sentiment periods individual investors pay less attention towards understanding the accruals and cash flow components of earnings. Antoniou and Subrahmanyam (Citation2010) confirmed the linkage between investor sentiment, momentum strategies and a broad set of anomalies in the United States market. T. Kim and Ha (Citation2010) reported the presence of a connexion between investor sentiment and value effect on the Korean market and Anusakumar and Ali (Citation2017) reported significant effects of global sentiment on momentum in Asian stock markets. Stambaugh et al. (Citation2012), in the examination of a broad set of anomalies, found that each anomaly is stronger—the long-short strategy was more profitable—following high levels of sentiment on the US market. The short leg of each strategy was more profitable following high sentiment. However, sentiment exhibited no relation to returns on the long legs of the strategies.
Bathia and Bredin (Citation2013) found a negative relationship between investor sentiment and future returns on the G7 markets. They also found evidence of commonality across all the sentiment measures with the value stocks having a particularly strong effect relative to growth stocks. D. Huang et al. (Citation2015), using their new investor sentiment index, found that it had statistically and economically significant predictive power of returns and could also predict cross-sectional stock returns sorted by industry, size, value, and momentum. In South Africa, Dalika and Seetharam (Citation2015) found that investor sentiment significantly affected various financial market anomalies such as momentum, value, size, and the weekend effect. This observation matches the findings by Muguto (Citation2015) and Mahlophe and Muzindutsi (Citation2017). Shu and Chang (Citation2015), by linking psychological research and a traditional asset-pricing model, found that a modified Lucas (Citation1978) model can adequately interpret prominent financial market anomalies, such as high volatility, bubble and crash formation, and the relationships among investor sentiment, asset prices and expected returns.
Smales (Citation2017) demonstrated that investor sentiment drove returns across US firm-size and value. Sentiment had a greater influence on market returns during the recession, particularly true for stocks most susceptible to speculative demand. Xavier and Machado (Citation2017) found that investor sentiment had explanatory power for the value anomalies when included in the capital asset pricing model on the Brazilian market and was robust to all risk factors. Beer et al. (Citation2018) found that investors’ sentiment influences accruals mispricing across European countries, more pronounced for stocks whose valuations are highly subjective and difficult to arbitrage and in countries with weaker outside shareholder rights, lower legal enforcement, lower equity market development, higher allowance of accrual accounting and in countries where herd-like behaviour and overreaction behaviour are strong.
R. Chen et al. (Citation2019) found that the internet finance investor sentiment had a more significant impact on stocks of firms intricately linked to internet financial products. It also had significant incremental explanatory power, beyond Fama and French s (Citation2015) five factors, on return comovements for stocks with larger market capitalisation and the size anomaly. Qadan and Aharon (Citation2019) found that the size premium correlates with and is predictable using investor sentiment because investors overvalue small stocks during times associated with overly optimistic moods. Hudson et al. (Citation2020) found that fund managers exhibit herd behaviour based on the market portfolio, size, and value factors. They also found a unidirectional investor sentiment effect on the herding of UK mutual fund managers. Though, the sentiment factors affecting open-end and closed-end fund managers’ herding behaviour were different due to the differences in funds’ structure. Byun et al. (Citation2022) found a significant association between the MAX effect and sentiment on the Korean market. Stocks with extremely positive returns underperformed the market following periods of low investor sentiment.
Han and Shi (Citation2022) found that while the anomalies in the trading frictions category are the most pronounced in the Chinese market, the anomaly returns increase over time with the trend of investor sentiment. That is, investor sentiment drives the wave of anomaly returns, and anomaly returns are higher during periods of higher sentiment. Han et al. (Citation2022) found that sentiment has been mean-reverting on the US market, implying the diminished effect of noise investors and their associated mispricing. These changes in sentiment persistence affected equity anomalies, suggesting that the presence and impact of sentiment-driven investors is significantly time-variant. K. Kim and Ryu (Citation2022) examined whether investor sentiment changes explain the Monday effect. They found that absolute changes in sentiment significantly and positively impacted stock returns, whereas its positive impact declined after weekends. The negative stock returns on Mondays disappeared after controlling for the impact of over-the-weekend sentiment changes under the pessimistic sentiment.
Investor sentiment is also found as a major factor not only in equities but also in other assets such as bonds (Lee & Kim, Citation2019; Piñeiro-Chousa et al., Citation2021; Su et al., Citation2020), commodities (Akçay, Citation2022; Dai et al., Citation2022; Le & Luong, Citation2022; Luo et al., Citation2022; Qadan & Jacob, Citation2022; Qadan & Nama, Citation2018) and cryptocurrencies (López-Cabarcos et al., Citation2021; Naeem et al., Citation2021; Rathilal, Citation2021). There is also evidence that investor sentiment can have varying effects on different sectors within one market, which allows for arbitraging (Uygur & Taş, Citation2014a; Curatola et al., Citation2016; Reis & Pinho, Citation2020; Padungsaksawasdi, Citation2020; Rehman et al., Citation2021; Shi et al., Citation2022). This can be attributed to the different risk-return profiles and different levels of attractiveness to noise traders of these sectors. As such, analyses in which aggregate data is employed (for example, Dash & Maitra, Citation2018; Kumari & Mahakud, Citation2016; Rupande et al., Citation2019) instead of disaggregated sector indices or firm-level data may yield insufficiently detailed results on the impact of sentiment on that market.
The realisation of a possible differential effect of investor sentiment on returns and volatility across different sectors informed the decision in this study to employ sector-level data in this analysis on the Johannesburg Stock Exchange. The results of this study will be of particular interest not only to scholars but valuable for portfolio management, mispricing arbitrage, risk management and policymaking purposes. It is in this respect that this study differs from Rupande et al. (Citation2019) who, despite examining the same market, employed aggregated data on the broad market index. However, this analysis is more aligned with Chipunza et al. (Citation2020a) and Chipunza et al. (Citation2020b) in their consideration of sector-level data, even though the later studies did not consider the impact of investor sentiment. The specific aim of this study was to examine the impact of investor sentiment on both the returns and volatility of South African sector indices. This entailed the construction of a proxy-based index using principal component analysis to measure sentiment and the employment of sentiment-augmented GARCH models.
While there are various studies conducted on different emerging countries’ stock markets, the choice of South Africa was warranted by the growing foreign investment on the African continent, with a huge share flowing into South Africa. Its relative stability makes it the easiest way to gain exposure to the continent s growth. South Africa is also part of a group of emerging markets that have been exhibiting signs of growing dominance globally. According to Muguto and Muzindutsi (Citation2022), through globalisation and financial market liberalisation, the opening up of markets and the increased cross-border investments as investors search for higher risk-adjusted returns have resulted in more dominance of emerging markets. This is particularly so for those countries that belong to economic blocs that have become more influential (Yang, Citation2019). Thirdly, the cultural differences between South African investors and investors from other emerging markets in Asia and Europe motivated the study. Scholars such as Ikram (Citation2016), Ahmad et al. (Citation2017) and Zahera and Bansal (Citation2018) have shown how culture influences investor decision-making and susceptibility to behavioural biases.
The rest of the study is structured as follows: Section 2 describes the methodology—the data description and the method of analysis description. Section 3 presents the results and analysis—Section 3.1 provides the preliminary analysis; Section 3.2 contains the mean equation results and analysis while Section 3.3 contains the variance equation results and analysis. Section 4 concludes the study.
2. Data and methods
Daily closing prices and dividend yields data on seven sector indices—Basic materials (J510), Industrials (J520), Consumer Services (J550), Telecommunications (J560), Travel and leisure (J575), Financials (J580), Technology (J590)—and the benchmark All-Share Index (J203) were employed from July 2009 to June 2020 based on data availability. As alluded to above, this is the only point of difference from Rupande et al. (Citation2019) who only employed aggregate index data. These sectors are classified based on the industry classification benchmark, which is a globally utilised standard for the categorisation and comparison of companies by industry and sector. It is the official sector classification used across FTSE Russell indices for analysis, attribution and performance measurement (Johannesburg Stock Exchange, Citation2022). This classification of sectors varies from the classification on the other markets (Costa et al., Citation2022; Matos et al., Citation2021) but has been used in various South African studies (Chipunza et al., Citation2020a, Citation2020b; Mokoena & Nomlala, Citation2022; Muzindutsi et al., Citation2020; Vengesai et al., Citation2022). This data was obtained from the IRESS database.
Various studies do not include dividends in the calculation of returns (Muguto & Muzindutsi, Citation2022; Muzindutsi et al., Citation2020). This is because of how tedious it is to estimate the dividends of constituent stocks in the indices. Yet, this analysis included them because they have become more critical to investors, and their portion of total returns has recently increased (Muguto, Citation2015; Rupande et al., Citation2019). This was achieved by multiplying the dividend yield on day t of each index by its closing price on day t (Chipunza et al., Citation2020a, Citation2020b; Muguto, Citation2015). Daily data was used to improve the accuracy of tests, as movements can be missed in lower frequency data and, if so, may lead to inadequate modelling of returns and volatility (Rupande et al., Citation2019). Accordingly, and following studies such as Rupande et al. (Citation2019), the daily return, Rt, was calculated by using Pt, the daily closing price on day t, Pt-1, the closing price the day before, and DYt the dividend yield on day t, as:
The measurement of sentiment was less straightforward than returns. According to Baker and Wurgler (Citation2007), the phenomenon does not have a universally agreed-upon measure. As such, multiple methods such as surveys, lexicons, and proxies are often used. Surveys, as used by studies such as Brown and Cliff (Citation2004), Lux (Citation2011), Finter et al. (Citation2012) and Hengelbrock et al. (2013), can capture the psychological dimension of individuals independent of sophisticated financial theories. However, they suffer from prestige bias, confounding influences and an inability to distinguish between diverse levels of optimism or pessimism (Baker & Wurgler, Citation2007; Bormann, Citation2013; Beer and Zouaoui, Citation2018). The lexicon approach involves determining the orientation of articles by categorising words in an article and then gleaning the tone of that article to draw inferences about investors’ prevailing sentiment (Uhl, 2014; Hendershott et al., Citation2015; Smales, Citation2017). Yet, lexicons can be subjective, often fail to detect conflicting opinion words and may not be able to detect domain and context-specific opinion words (Rajput et al., Citation2016).
Proxies, on the other hand, are factors that indirectly reflect the prevailing investor sentiment based on simple market data (Pandey & Sehgal, Citation2019). Numerous studies showed that proxies are much more successful in measuring the sentiment on financial markets (Baker & Wurgler, Citation2006; Uygur & Taş, Citation2014b; Han and Li, Citation2017; Muguto et al., Citation2019; Rupande et al., Citation2019). The popularity of this approach is founded on the ease with which proxies are accessible and how proxies are observed in real time and reflect the strength of market participants’ bullishness or bearishness (Muguto et al., Citation2019; Rupande et al., Citation2019). However, proxies are not without their shortcomings. For example, they rely on controversial theoretical explanations to link them to sentiment (Muguto, Citation2015) and contain both a sentiment component and an idiosyncratic, non-sentiment-related component (Baker & Wurgler, Citation2006). The sheer number of sentiment proxies that have been employed in literature also reflects the fact that there is no clear, general and standard conception of investor sentiment (Baker & Wurgler, Citation2006).
The solution to several of the disadvantages of proxies is to combine them into one composite index to capture sentiment from different angles, filter out the idiosyncratic noise and exclusively measure sentiment (Baker & Wurgler, Citation2006). In this regard, Baker and Wurgler (Citation2006), Liao et al. (2011), Finter et al. (Citation2012), Beer and Zouaoui (2013), H. Chen et al. (Citation2014), Rupande et al. (Citation2019), Muguto et al. (Citation2019) and Reis and Pinho (Citation2020a) found that indices formed from various proxies were more accurate in measuring sentiment than an individual, potentially imperfect proxies. Techniques such as the principal component analysis can separate the sentiment and the non-sentiment component in a proxy. This technique reduces data dimensionality and removes unrelated qualities to improve the accuracy of the dataset in measuring a common component, which is sentiment in this study. This is done by producing a linear combination of proxies with the first principal component that captures the maximum variance (Deeney et al., 2015; Jolliffe & Cadima, Citation2016). Accordingly, six proxies were used in this study to construct a global sentiment index, as described in below.
Table 1. Proxies employed to construct the composite sentiment index
Following Jaadi (2021), the variables were standardised to remove the effect of different units of measurement. This is because the principal components based on the covariance matrix are sensitive to the units of measurement, especially if they are vastly different (Jolliffe & Cadima, Citation2016). Subsequently, each proxy was regressed against four global aggregates of exports, gross domestic product, inflation and population to orthogonalise them. The residuals from each equation were extracted to represent each sentiment proxy in the construction of the sentiment index. Per Muguto (Citation2015) and Reis and Pinho (Citation2020a), using macroeconomic variables to orthogonalise variables removes the macro effects from sentiment proxies and ensures that their explanatory power is purely behavioural. The correlations between the orthogonal proxies were higher than those between the raw proxies in the majority of cases. This is consistent with Baker and Wurgler (Citation2006) who argued that orthogonalisation of the sentiment proxies creates variables that measure a common component better than non-orthogonalised variables.
Muguto (Citation2015) and Rupande et al. (Citation2019), following Baker and Wurgler (Citation2006), noted that several sentiment proxies take longer to reveal sentiment than others. To account for this, these studies first constructed an index with the first principal components of the current values and the one-period lagged values. Subsequently, the correlation between the first stage index and the current and lagged values of each of the proxies was examined to determine which between the lagged or the current values of each of the proxies revealed sentiment effects better. From then, they defined their sentiment indices as the first principal component of the correlation matrix of the factors—each corresponding proxy s current or lagged value, whichever had a greater correlation with the first-stage index. Following the same procedure herein did not change the predictive power of the sentiment index. Therefore, CompSentt was defined as the first principal component of the correlation matrix of each corresponding proxy s current values as shown in Equation 2 below:
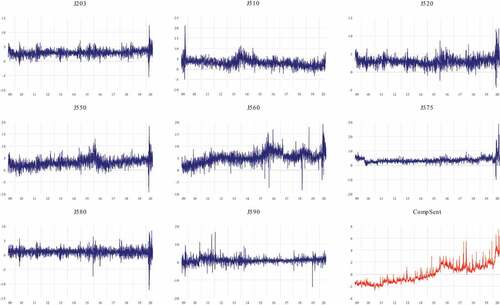
From the principal component analysis, the first principal component accounted for 59.74% of the total variance, higher than the 53% reported by Baker and Wurgler (Citation2006). Further, the first two principal components explain 85% of the variation in the data. The inclusion of the following two principal components accounts for 99%. Looking at Figure of the sentiment index, it is apparent that it exhibits significant volatility, suggestive of sharp changes in sentiment. However, as with Baker and Wurgler (Citation2006) in their US sentiment index, Rupande et al. (Citation2019) in their South African sentiment index and Reis and Pinho (Citation2020a) in their European sentiment index, CompSent visibly lined up with various accounts of bubbles and crashes on the stock markets. It is vital to note that all constructed proxies in Equation 2, namely oil price, exchange rate, repo rate, trading volume, gold price and the volatility index have positive signs, showing that sentiment rises and falls with these factors.
Figure 1. Sector index returns and investor sentiment.
The positive coefficients on the first four proxies are consistent with descriptions of how they reflect sentiment. However, considering that gold is a haven and a high-quality asset in the flight to a quality phenomenon (Pandey & Sehgal, Citation2019; Akhtaruzzaman et al., 2020) and that VIX is a measure of market fear and stress (Lei et al., 2012; So and Lei, Citation2015), negative signs were expected. It is possible that these two proxies might be capturing future expectations rather than the current expectation, despite their lagged values being outperformed by current values. It could also be an indication that some proxies can capture the sentiment of individual, unsophisticated investors whereas other proxies can better capture the sentiment of sophisticated institutional investors. This is consistent with the longstanding argument on the identity of sentiment-driven traders (Beaumont et al., Citation2005; Muguto et al., Citation2019).
To model the returns and volatility of the sector indices and determine the impact of investor sentiment thereon, three GARCH models—GARCH (Bollerslev, Citation1986), GJR-GARCH (Glosten et al., Citation1993) and E-GARCH (Nelson, Citation1991)—were employed following Rupande et al. (2020). This framework counters the shortcomings of Engle s (1982) ARCH model, such as its requirement of long lag lengths and a large number of parameters. Further, the ARCH model is only a function of past squared residuals and assumes that past volatility does not affect current volatility which in the GARCH framework, the conditional variance depends on the squared residuals and the conditional variance in the previous period. Furthermore, in the parsimonious GARCH specification with only one lag of the past volatility and squared residuals, it is needless to include additional lags of either of the two components. However, different residuals tests—normality, autocorrelation, heteroscedasticity and ARCH-LM—had to be conducted before the GARCH models were employed. The presence of ARCH effects confirmed the appropriateness of the GARCH models (Muguto & Muzindutsi, Citation2022).
Each model s mean equation for returns was similar in all specifications, and the variance equation for volatility was specified differently. The sentiment index, , was then added to the equations. The basic and sentiment-augmented mean equations for each model were estimated as:
Where yt is the index return, is the mean,
captures the effect of past returns,
captures the effect of past shocks, and
is the risk premium. The impact of investor sentiment on returns
was determined by observing the significance, sign and size of the coefficient. Coefficients from EquationEquations 3
(3)
(3) and Equation4
(4)
(4) were also compared to determine the effect of investor sentiment on the significance and signs of the other variables in the equations. The impact of investor sentiment on stock return volatility was determined by estimating the variance equation. The non-augmented conditional variance equations for the GARCH (1.1), GJR-GARCH (1.1) and E-GARCH (1.1) were estimated in EquationEquations 5
(5)
(5) , Equation7
(7)
(7) and Equation9
(9)
(9) while the same equations were estimated with the augmentation of CompSentt to capture the effect of investor sentiment on sectoral return volatility in Equationequations 6
(6)
(6) , Equation8
(8)
(8) and Equation10
(10)
(10) as:
where is the conditional variance,
is the intercept,
and
capture the effect of shocks in volatility and past volatility on current volatility, respectively. A statistically significant coefficient on
indicated a significant impact of sentiment on stock return volatility, while an insignificant coefficient indicated sector return volatility s insensitivity to sentiment. If positive, this meant that sentiment increases with volatility and vice-versa for a negative coefficient. The GARCH (1.1) model in EquationEquation 5
(5)
(5) (and EquationEquation 6)
(6)
(6) assumes that the response of time-varying volatility to negative and positive shocks is the same, and hence shocks are modelled symmetrically. To counter this limitation, the GJR-GARCH (1.1) model, an extension of the GARCH (1.1), accounts for asymmetries in the response of volatility to negative and positive shocks. The conditional variance of the GJR-GARCH (1.1) in EquationEquation 7
(7)
(7) (and EquationEquation 8)
(8)
(8) adds a multiplicative dummy term to EquationEquation 5
(5)
(5) , such that
captures the leverage effects (Shamiri & Hassan, Citation2007). A statistically significant and positive
denotes the leverage effect (Brooks, Citation2019).
However, even though the GJR-GARCH (1.1) accounts for leverage effects, it may still violate the non-negativity constraints. Therefore, non-negativity conditions (,
,
and
) were artificially imposed to ensure that coefficients are positive. To counter the drawback of artificially imposing non-negativity constraints, the E-GARCH (1.1) model in EquationEquation 9
(9)
(9) (and EquationEquation10
(10)
(10) ) employs logs to ensure that the non-negativity conditions are never violated. More so, like the GJR-GARCH (1.1), the E-GARCH (1.1) captures the leverage effects in stock return volatility. Therefore, in EquationEquation 9
(9)
(9) , a statistically significant and negative
denotes the leverage effects. Lastly, the stationarity condition (
should be met in all the equations for the models to be admissible (Brooks, Citation2019). Three distribution assumptions—normal, student-t and the generalised error distribution assumption (GED)—were assumed. The Schwarz Bayesian Information Criterion (SBIC) was used to select the most appropriate model for each sector. In addition, model diagnostic tests were conducted on the standardised residuals to ensure that the selected GARCH models are correctly specified.
3. Results and analysis
This section describes the results of the study—from the preliminary tests to the discussion of the mean and variance equation results.
3.1. Preliminary analysis
Table below reports the descriptive statistics for the sectoral returns, the broad market index and the sentiment index. All sectors had positive average daily returns with Telecommunications having the highest daily return of 5.07% and Technology having the lowest return of 0.97% over the sample period. Additionally, the Telecommunications sector had the highest standard deviation of 2.48%, whereas Financials had the lowest standard deviation of 1.24%. The benchmark index recorded 2.91%. Three sectors—Industrials, Financials and Technology were outperformed by the benchmark. These differences in returns of sectors suggest heterogeneity, which is advantageous for cross-sector diversification. They also suggest that these sectors respond differently to macroeconomic shocks and the shocks in sentiment. All the return series were positively skewed except for Financials, suggesting a period with more average daily returns and non-normal distribution. The kurtosis and Jarque-Bera results also confirm the non-normality of these series.
Table 2. Summary of descriptive statistics and preliminary tests
Furthermore, all return series were serially correlated. This suggests the use of the ARMA process to model the mean equations (Brooks, Citation2019). The ARCH-LM and the Ljung-Box test results showed significant ARCH effects in all sectors, confirming the use of the GARCH models in the analysis of the impact of investor sentiment on JSE sectoral returns and volatility. The results of the ADF and the KPSS unit root and stationarity tests are reported in Table . From the ADF test, all the stock returns series are stationary or have no unit root at levels. From the KPSS test, none of the series was found to be stationary at levels. They were only stationary at first difference. As the KPSS is considered a stronger test than the ADF test, the variables were all deemed to be integrated of order 1 and were differenced before estimations were conducted. The returns plots in Figure confirm some of the descriptive statics; they show that variance was not constant over the sample period and that it followed an autoregressive pattern which gives rise to volatility clustering.
Volatility clustering in most periods coincided with notable financial market events, chief among which was the Covid-19 pandemic. The plots also suggest that the series were not stationary due to the absence of constant means over the sample period. As such, they needed to be differenced once before estimations. Further, there were notable differences in the return patterns across the sectors. These differences indicate that cross-sector diversification is possible in South Africa. Investor sentiment was negative from 2009 to 2015, due to the 2008 financial crisis (Rupande et al., Citation2019). After 2010, there was a steady improvement in sentiment as the market recovered and, after 2015, sentiment changed from negative to positive up to 2019. Between 2019 and 2020 investors’ sentiment experienced a sharp decline that may be a result of the COVID-19 pandemic. Overall, the South African investor sentiment exhibits significant volatility, as shown by the rapid upturns and downturns in the index throughout the sample period.
Table reports the SBICs for the three GARCH models under the three distribution assumptions which were used in the selection of the best model for each of the sectors and the broad market index—both the non-augmented and augmented ones. Of note, all models estimated under the normal distribution assumption were not selected in any case. This is in accordance with the distribution statistics as well as the pictorial evidence from the graphs in Figure above. The sentiment-augmented models were the most selected relative to the non-augmented models, suggesting the relevance of investor sentiment in explaining returns and volatility on the South African market. The differences, however, suggest the presence of arbitrage based on prevailing sentiment. The E-GARCH (1.1) with a student s t distribution was selected the most, suggesting the presence of leverage effects. The model selection findings are partly consistent with Rupande et al. (Citation2019) ’s findings on the South African market. However, their selected model was the GJR-GARCH (1.1) model. The difference was due to the different study periods.
Table 3. Model selection
3.2. Discussion of the mean equations and results
Table below contains the outputs from the selected models for all the sector indices and the broad market index. From the mean equation, there is evidence of return serial correlation in the six sector indices as shown by the positive and statistically significant serial correlation coefficient, Φ. This means that these indices are affected by market frictions such as non-synchronous trading which gives rise to autocorrelation (Hounyo, Citation2017). Expectantly, the broad market index returns also exhibited significant serial correlation (0.9961***) in line with the six sector indices, all of which are inconsistent with Fama s (Citation1970) weak-form efficient market. The finding also contradicts some studies that designated the South African market as at least a weak-form efficient market (Smith et al., Citation2002) but is in support of those that designated the same market as inefficient (Grater & Struweg, Citation2015; Lim, Citation2009). The contradiction between these findings and various past studies could be because the South African market has adaptive efficiency (Obalade & Muzindutsi, Citation2018).
Table 4. The selected model outputs
The study did not find evidence of serial correlation in the Industrials sector returns after augmenting the model with the sentiment index. The serial correlation coefficient changed from a statically significant 0.992*** to an insignificant 0.1634. This suggests that investor sentiment may be used to explain a significant component of the serial correlation in this sector s returns. The same applies to the effect of past shocks on current returns. The coefficient that captures the effect of past shocks on current returns, υ, was negative and statistically significant for all the six sector indices and the broad market index. However, the Industrials sector had a negative but statistically insignificant coefficient. This implies that past negative shocks could be used to explain the current returns of these sectors except for Industrials. Investor sentiment accounts for or encapsulates the effect of past shocks on the returns of the Industrials sector only in the same way it did with the broad market index for which the coefficient turned from negative −0.9541*** to positive 0.0269*** when sentiment was considered.
The risk premium parameter, δ, was positive and statistically significant for Basic Materials, Industrials and Telecommunications. This indicates the pricing of volatility as an increase in the conditional variance leads to an increase in the mean return (Brooks, Citation2019). However, the parameter was negative for the Financials. This finding is similar to Mandimika and Chinzaras (Citation20102). The broad market index returns exhibited a positive risk premium (0.5725***), driven by the Basic Materials risk premium (0.7073***). On the other hand, the risk-premium coefficients were positive and insignificant for Travel and leisure, Consumer services and Technology, suggestive of the absence of feedback from the conditional variance to the conditional mean equation (Brooks, Citation2019). This finding is consistent with findings by Makhwiting et al. (2012) and Kgosietsile (2015). However, it should be noted that the risk premium, which is also the coefficient of risk aversion, accounts for total risk and, therefore, may not be correlated with returns in accordance with the capital asset pricing model which focuses on systematic risk.
The investor sentiment parameter, θ, was negative and statistically significant for three out of four sectors—Industrials, Telecommunications and Financials—for which the investor sentiment augmented models were chosen based on the SBICs. These findings are consistent with Corredor et al. (Citation2015) on the US market and Yang et al. (Citation2017) on the Korean market, who also found that investor sentiment impacted stock market sector returns. The negative coefficients suggest that a change in investor sentiment results in a change in the sector returns in the opposite direction. That is, an increase in sentiment is followed by low future returns. This could be due to the mean reversion of the market to the fundamentals as reported by Da et al. (Citation2011), Dalika and Seetharam (Citation2015) Chakraborty and Subramaniam (Citation2020). Except for Basic materials (0.0288), the investor sentiment coefficients for all sector returns and the broad market index returns were negative. This supports the general idea of a negative relationship between changes in sentiment and returns attributed to the overvaluation and mean reversion cycles.
Yet, some studies reported positive contemporaneous relationships between sentiment and returns, attributed to how optimism creates positive expectations and reduces uncertainty and volatility of stock market returns (Sayim & Rahman, Citation2015a; Ryu et al., Citation2017; McGurk et al., Citation2020; Al-Nasseri et al., Citation2021; Abdul Karim et al., Citation2022). The differences suggest that in the South African market, an increase in sentiment leads to overpricing rather than a reduction of uncertainty and volatility. This could be a consequence of differences in investor composition and type. This is more in line with some financial market anomalies that have been linked to sentiment on the same market (Dalika & Seetharam, Citation2015; Mahlophe & Muzindutsi, Citation2017; Muguto, Citation2015). For the Consumer Services sector, however, the insignificant coefficient suggests that there are diverse types of investors in each sector (Curatola et al., Citation2016) which results in differences in proneness to sentiment (Cakan & Balagyozyan, Citation2016). This provides an opportunity for arbitrage and diversification based on the prevailing sentiment.
3.3. Discussion of the variance equation and results
From the same Table , all the variance equation parameters for all the selected models for the seven sectors were statistically significant. This indicates that current volatility can be explained by volatility in the previous period and past innovations (Brooks, Citation2019). However, the explanatory power of volatility in the previous period was stronger than the explanatory power of past innovations as seen by the differences in the coefficients. Expectantly, the coefficients on the broad market index were both statistically significant, with past volatility (0.8868***) explaining more of current volatility than past innovations (0.0284**). The asymmetry parameter, γ, was significant and positive for the Consumer services and the Financials sectors. This confirms the presence of the leverage effect where negative shocks increase volatility more than positive shocks of the same magnitude. Similarly, the broad market index returns also exhibited a significant leverage effect on the same market, consistent with studies by Mandimika & Chinzara (2010), Rupande et al. (Citation2019) and Muguto and Muzindutsi (Citation2022).
The degree of volatility persistence in the sector returns, as measured by the coefficients α + β, was high but less than 1 for all the sectors. This suggests the presence of volatility clustering in the returns, a common phenomenon in financial time series data. The plots of the sector returns across the sample period above in Figure confirm this finding. Significant volatility persistence implies that current volatility shocks influence the expectation of volatility for many periods in the future (Engle & Patton, Citation2001). A high degree of volatility persistence reveals that stock return volatility has a large effect on stock prices and that mean reversion to the average volatility occurs slowly. This was the case in the Technology sector returns (0.9936) for which the highest persistence was recorded, suggestive of its sensitivity to external influences. On the other hand, the broad market index exhibited the lowest persistence in volatility shocks (0.9152), indicative of how diversified the index is. The difference in the volatility persistence across the indices may facilitate some level of diversification, albeit minimum.
The investor sentiment parameter, φ, was positive and statistically significant in all four selected sentiment-augmented models. This indicates that behavioural factors played a relevant role in driving volatility in these sectors and that an increase in investor sentiment increased volatility. The broad market index returns, despite the sentiment-augmented model not being chosen, also had a positive and statistically significant sentiment coefficient (0.3779***). This shows that sentiment increases volatility in the South African stock market and is in line with several studies (Gao et al., Citation2022; Gong et al., Citation2022; Idilbi-Bayaa & Qadan, Citation2022; Jiang & Jin, Citation2021; Kumari & Mahakud, Citation2016; Qadan, Citation2019). As sentiment increases, so does the incidence of noise traders and mispricing on the market. Subsequently, as sentiment mean reverts, volatility increases in the market. However, this contradicts the findings of Naik and Padhi (Citation2016) and Rupande et al. (Citation2019), who reported negative coefficients. This difference may be attributable to a change in the incidence of sentiment-driven investors through different time periods and chosen markets.
The non-negativity conditions in the volatility equation (ω > 0, β > 0, α ≥ 0 and β + γ ≥ 0) and the stationarity condition (α + β < 1) were all satisfied. This means that all the selected models for the conditional variance were admissible for all the sector indices. Diagnostic tests on the residuals were performed to validate the inferences made from the estimated models on the sector returns and broad market indices and check whether the mean and variance equations of the chosen models were correctly specified. These tests were found to have been satisfied. Therefore, taken together, the negative relationship between investor sentiment and sectoral returns from the mean equation and the positive relationship between sentiment and variance suggests that sentiment can affect returns by shaping the conditional volatility which Wang et al. (Citation2022) regard as an indirect channel.
5. Conclusion
This study examined the effect of market-wide investor sentiment on the returns and volatility of seven sectoral indices and the broad market index on the South African stock market. The principal component analysis technique was employed to construct a composite investor sentiment index from a set of six proxies and the GARCH models were employed as a method of analysis. The sentiment index lined up well with previous periods of bubbles and bubble bursts. It was also comparable with indices constructed in some past studies. The findings of the study indicated the presence of sentiment-sensitive and sentiment-insensitive sectors within the South African stock market. The sentiment coefficient in the sentiment-sensitive sectors was negative, indicative of the mean reversion of sentiment effects. The broad market index returns were found to be sentiment-sensitive, meaning that overall, sentiment has a role in asset pricing in South Africa. In other words, the study results are against the efficient market hypothesis and investor sentiment can assist to explain some of the asset pricing anomalies in the South African market.
In terms of volatility, like sectoral returns, some sectors exhibited significant sentiment sensitivity in their volatilities, as indicated by the significantly high coefficients. However, the other sectors exhibited no sensitivity to sentiment as indicated by the insignificant coefficients and the selection of non-augmented models. For the former, sector return volatility increased with sentiment, mostly likely due to the noise trader effects. The broad market index volatility had a positive coefficient, meaning that overall, investor sentiment increases volatility in the South African market. The overall findings suggest that investors are prone to irrational behaviour, and this behaviour is significant enough to impact market returns and volatility. Taken together, the negative relationship between investor sentiment and sectoral returns from the mean equation and the positive relationship between sentiment and variance suggests that sentiment can affect returns by shaping the conditional volatility which is regarded as an indirect channel. This is consistent with some studies that have linked investor sentiment to financial market anomalies on the South African market.
As a recommendation, firms that use capital markets to raise financing must consider sentiment effects on the availability and the cost of that capital. Proper market timing might result in a lower overall cost of capital. Investors must consider sentiment as an additional risk factor when making investment decisions. There is an opportunity for diversification and arbitrage based on prevailing sentiment between sentiment-sensitive and insensitive sectors. Lastly, policymakers need to ensure that markets operate efficiently by considering the impact of sentiment on volatility and returns. Mechanisms that counteract the increase in volatility in high sentiment periods should be developed. For research on sentiment, future studies should consider employing longer sample periods and cross-country comparisons of similar sectors to produce a more rounded view of sentiment. The use of firm-level data could also avoid dilution of sentiment effects on individual stocks which is unavoidable in indices, even disaggregated sector indices. The approach would also avoid concerns with the industry/sector classification of firms.
Disclosure statement
The authors have o potential conflict of interest to declare.
Additional information
Notes on contributors
Hilary Tinotenda Muguto
Hilary Tinotenda Muguto is a PhD candidate in the School of Accounting, Economics and Finance, at the University of KwaZulu-Natal. His research interests include healthcare equity and finance, financial markets, behavioural finance, investment analysis and development economics.
Lorraine Muguto (PhD) is a Finance postdoctoral fellow in the School of Accounting, Economics and Finance, University of KwaZulu-Natal, South Africa. Her research interests include volatility modelling, financial markets, behavioural finance and financial risk.
Lorraine Muguto
Lorraine Muguto (PhD) is a Finance postdoctoral fellow in the School of Accounting, Economics and Finance, University of KwaZulu-Natal, South Africa. Her research interests include volatility modelling, financial markets, behavioural finance and financial risk.
Azra Bhayat
Azra Bhayat is a postgraduate student in the School of Accounting, Economics and Finance at the University of KwaZulu-Natal. Her research interests include behavioural finance, financial risk and financial markets.
Hawaa Ncalane
Hawaa Ncalane is a Finance postgraduate student at the University of KwaZulu-Natal. Her research interests include investor sentiment and financial markets.
Kara Jasmine Jack
Kara Jasmine Jack is a Finance postgraduate student at the University of KwaZulu-Natal. Her research interests include volatility modelling and financial markets.
Saadia Abdullah
Saadia Abdullah is a Finance postgraduate student at the University of KwaZulu-Natal. Her research interests include volatility modelling and financial markets.
Thabile Siphesihle Nkosi
Thabile Siphesihle Nkosi is a Finance postgraduate student at the University of KwaZulu-Natal. Her research interests include investor sentiment and financial markets.
Paul-Francois Muzindutsi
Paul-Francois Muzindutsi (PhD) is a Professor of Finance in the School of Accounting, Economics and Finance, University of KwaZulu-Natal. His research interests include financial markets, behavioural finance, financial risk management, investment portfolios and time series analysis of macroeconomic variables.
References
- Abdul Karim, Z., Muhamad Fahmi, F. S. R., Abdul Karim, B., & Shokr, M. A. (2022). Market sentiments and firm-level equity returns: Panel evidence of Malaysia. Economic Research-Ekonomska Istraživanja, 1(1), 1–24. https://doi.org/10.1080/1331677X.2021.2025126
- Ahmad, Z., Ibrahim, H., & Tuyon, J. (2017). Institutional investor behavioural biases: Syntheses of theory and evidence. Management Research Review, 40(5), 578–603. https://doi.org/10.1108/MRR-04-2016-0091
- Akçay, S. (2022). Investor sentiment and oil prices in the United States: Evidence from a time-varying causality test. Energy Research Letters, 3(2), 32633. https://doi.org/10.46557/001c.32633
- Ali, A., & Gurun, U. G. (2009). Investor sentiment, accruals anomaly, and accruals management. Journal of Accounting, Auditing & Finance, 24(3), 415–431. https://doi.org/10.1177/0148558X0902400305
- Al-Nasseri, A., Ali, F. M., & Tucker, A. (2021). Investor sentiment and the dispersion of stock returns: Evidence based on the social network of investors. International Review of Financial Analysis, 78(1), 101910. https://doi.org/10.1016/j.irfa.2021.101910
- Antoniou, C. D. J. A., & Subrahmanyam, A. (2010). Sentiment and momentum. Working paper. United States: University of California, 1–54.
- Anusakumar, S. V., & Ali, R. (2017). Momentum and Investor Sentiment: Evidence from Asian Stock Markets. Capital Markets Review, 25(1), 26–42.
- Avramov, D., & Chordia, T. (2006). Asset pricing models and financial market anomalies. Review of Financial Studies, 19(3), 1001–1040. https://doi.org/10.1093/rfs/hhj025
- Baker, M., & Wurgler, J. (2006). Investor sentiment and the cross‐section of stock returns. Journal of Finance, 61(4), 1645–1680. https://doi.org/10.1111/j.1540-6261.2006.00885.x
- Baker, M., & Wurgler, J. (2007). Investor sentiment in the stock market. Journal of Economic Perspectives, 21(2), 129–152. https://doi.org/10.1257/jep.21.2.129
- Baker, M., Wurgler, J., & Yuan, Y. (2012). Global, local, and contagious investor sentiment. Journal of Financial Economics, 104(2), 272–287. https://doi.org/10.1016/j.jfineco.2011.11.002
- Bathia, D., & Bredin, D. (2013). An examination of investor sentiment effect on G7 stock market returns. European Journal of Finance, 19(9), 909–937. https://doi.org/10.1080/1351847X.2011.636834
- Beaumont, R., Van Daele, M., Frijns, B., & Lehnert, T. (2005). On individual and institutional noise trading. In Recuperado de: https://www.fep.up.pt/conferencias/pfn2006/Conference%20Papers/508.pdf
- Beer, F., Hamdi, B., & Zouaoui, M. (2018). Investors’ sentiment and accruals anomaly: European evidence. Journal of Applied Accounting Research, 19(4), 500–517. https://doi.org/10.1108/JAAR-03-2017-0043
- Bloomberg database (2020). Data. https://www.bloomberg.com/professional/product/data/
- Bollerslev, T. (1986). Generalised autoregressive conditional heteroskedasticity. Journal of Econometrics, 31(3), 307–327. https://doi.org/10.1016/0304-4076(86)90063-1
- Bormann, S. K. (2013). Sentiment indices on financial markets: What do they measure? Economics Discussion Papers, No. 2013-58.
- Brooks, C. (2019). Introductory Econometrics for Finance (4th ed.). Cambridge University Press.
- Brown, G., & Cliff, M. (2004). Investor sentiment and the near-term stock market. Social Science Research Network Electronic Journal, 11(4), 627–643. https://doi.org/10.1016/j.jempfin.2002.12.001
- Byun, S. J., Jeon, B., & Kim, D. (2022). Investor sentiment and the MAX effect: Evidence from Korea. Applied Economics, 1(1), 1–13. https://doi.org/10.1080/00036846.2022.2087858
- Cakan, E., & Balagyozyan, A. (2016). Sectoral herding: Evidence from an emerging market. Journal of Accounting and Finance, 16(4), 87–96.
- Chakraborty, M., & Subramaniam, S. (2020). Asymmetric relationship of sentiment with stock return and volatility: Evidence from India. Review of Behavioral Finance, 12(4), 435–454. https://doi.org/10.1108/RBF-07-2019-0094
- Chen, H., Chong, T. T. L., & She, Y. (2014). A principal component approach to measuring investor sentiment in China. Quantitative Finance, 14(4), 573–579. https://doi.org/10.1080/14697688.2013.869698
- Chen, R., Yu, J., Jin, C., & Bao, W. (2019). Internet finance investor sentiment and return comovement. Pacific-Basin Finance Journal, 56(1), 151–161. https://doi.org/10.1016/j.pacfin.2019.05.010
- Chiang, M. C., Tsai, I. C., & Lee, C. F. (2011). Fundamental indicators, bubbles in stock returns and investor sentiment. Quarterly Review of Economics and Finance, 51(1), 82–87. https://doi.org/10.1016/j.qref.2010.11.001
- Chipunza, K. J., Muguto, H. T., Muguto, L., & Muzindutsi, P. F. (2020a). Stock returns and valuation ratios at sector level in South Africa: The regime-switch modelling approach. Global Business Review, 1, 0972150920976641. https://doi.org/10.1177/0972150920976641
- Chipunza, K. J., Muguto, H. T., Muguto, L., Muzindutsi, P. F., & McMillan, D. (2020b). Return predictability and valuation ratios: Sector-level evidence on the Johannesburg stock exchange. Cogent Economics & Finance, 8(1), 1817252. https://doi.org/10.1080/23322039.2020.1817252
- Corredor, P., Ferrer, E., & Santamaria, R. (2015). The impact of investor sentiment on stock returns in emerging markets, the case of central European markets. Eastern European Economics, 54(4), 328–355. https://doi.org/10.1080/00128775.2015.1079139
- Costa, A., Matos, P., & da Silva, C. (2022). Sectoral connectedness: New evidence from US stock market during COVID-19 pandemics. Finance Research Letters, 45(1), 102124. https://doi.org/10.1016/j.frl.2021.102124
- Curatola, G., Donadelli, M., Kizys, R., & Riedel, M. (2016). Investor sentiment and sectoral stock returns: Evidence from world cup games. Finance Research Letters, 17(1), 267–274. https://doi.org/10.1016/j.frl.2016.03.023
- Da, Z., Engelberg, J., & Gao, P. (2011). In search of attention. Journal of Finance, 66(5), 1461–1499. https://doi.org/10.1111/j.1540-6261.2011.01679.x
- Dai, Z., Zhu, J., & Zhang, X. (2022). Time-frequency connectedness and cross-quantile dependence between crude oil, Chinese commodity market, stock market and investor sentiment. Energy Economics, 1(1), 106226. https://doi.org/10.1016/j.eneco.2022.106226
- Dalika, N., & Seetharam, Y. (2015). Sentiment and returns: An analysis of sentiment in the South African market. Investment Management and Financial Innovations, 12(1–2), 267–276.
- Dash, S. R., & Maitra, D. (2018). Does sentiment matter for stock returns? Evidence from the Indian stock market using wavelet approach. Finance Research Letters, 26(1), 32–39. https://doi.org/10.1016/j.frl.2017.11.008
- Davidsson, V. (2022). The effect of conventional monetary policy on stock market prices in Sweden: Stock market reaction to announcements of repo rate changes made by the Swedish Central Bank. Master’s thesis. Jönköping University.
- DDu, D., & Zhao, X. (2017). Financial investor sentiment and the boom/bust in oil prices during 2003–2008. Review of Quantitative Finance and Accounting, 48(2), 331–361.
- De Long, J. B., Shleifer, A., Summers, L. H., & Waldmann, R. J. (1990). Noise trader risk in financial markets. Journal of Political Economy, 98(4), 703–738. https://doi.org/10.1086/261703
- Ding, X., Liu, B., & Yu, P. S. (2008). A holistic lexicon-based approach to opinion mining. In Proceedings of the 2008 International Conference on Web Search and Data Mining, 231–240. February 11- 12, Palo Alto California USA. https://doi.org/10.1145/1341531.1341561
- Engle, R. F., & Patton, A. J. (2001). What good is a volatility model?. Quantitative Finance, 1(2), 237–245.
- Fama, E. F. (1970). Efficient capital markets: A review of theory and empirical work. Journal of Finance, 25(2), 383–417. https://doi.org/10.2307/2325486
- Fama, E. F., & French, K. R. (2015). A five-factor asset pricing model. Journal of Financial Economics, 116(1), 1–22.
- Finter, P., Niessen-Ruenzi, A., & Ruenzi, S. (2012). The impact of investor sentiment on the German stock market. Zeitschrift für Betriebswirtschaft, 82(2), 133–163. https://doi.org/10.1007/s11573-011-0536-x
- Finter, P., Niessen-Ruenzi, A., & Ruenzi, S. (2012). The impact of investor sentiment on the German stock market. Zeitschrift für Betriebswirtschaft, 82(2), 133–163.
- Fu, J., Wu, X., Liu, Y., & Chen, R. (2021). Firm-specific investor sentiment and stock price crash risk. Finance Research Letters, 38(1), 101442. https://doi.org/10.1016/j.frl.2020.101442
- Gao, Y., Zhao, C., Sun, B., & Zhao, W. (2022). Effects of investor sentiment on stock volatility: New evidence from multi-source data in China’s green stock markets. Financial Innovation, 8(1), 1–30. https://doi.org/10.1186/s40854-022-00381–2
- Glosten, L. R., Jagannathan, R., & Runkle, D. E. (1993). On the relation between the expected value and the volatility of the nominal excess return on stocks. Journal of Finance, 48(5), 1779–1801. https://doi.org/10.1111/j.1540-6261.1993.tb05128.x
- Gong, X., Zhang, W., Wang, J., & Wang, C. (2022). Investor sentiment and stock volatility: New evidence. International Review of Financial Analysis, 80(1), 102028. https://doi.org/10.1016/j.irfa.2022.102028
- Grater, E., & Struweg, J. (2015). Testing weak form efficiency in the South African market. Journal of Economic and Financial Sciences, 8(2), 621–632. https://doi.org/10.4102/jef.v8i2.112
- Green, C., & Hudson, Y. (2015). Is investor sentiment contagious? International sentiment and UK equity returns. Journal of Behavioural and Experimental Finance, 5(2), 46–59. https://doi.org/10.1016/j.jbef.2015.02.004
- Han, X., & Li, Y. (2017). Can investor sentiment be a momentum time-series predictor? Evidence from China. Journal of Empirical Finance, 42, 212–239.
- Han, X., Sakkas, N., Danbolt, J., & Eshraghi, A. (2022). Persistence of investor sentiment and market mispricing. Financial Review, 57(1), 617–640. https://doi.org/10.1111/fire.12301
- Han, C., & Shi, Y. (2022). Chinese stock anomalies and investor sentiment. Pacific-Basin Finance Journal, 73(1), 101739. https://doi.org/10.1016/j.pacfin.2022.101739
- Hendershott, T., Livdan, D., & Schürhoff, N. (2015). Are institutions informed about news?. Journal of Financial Economics, 117(2), 249–287.
- Hoffmann, A. O., Post, T., & Pennings, J. M. (2015). How investor perceptions drive actual trading and risk-taking behaviour. Journal of Behavioral Finance, 16(1), 94–103. https://doi.org/10.1080/15427560.2015.1000332
- Hounyo, U. (2017). Bootstrapping integrated covariance matrix estimators in noisy jump-diffusion models with non-synchronous trading. Journal of Econometrics, 197(1), 130–152. https://doi.org/10.1016/j.jeconom.2016.11.002
- Huang, B., & Fang, X. (2021). Market sentiment, valuation heterogeneity, and corporate investment: Evidence from China’s a-share stock market. Emerging Markets Finance and Trade, 57(8), 2230–2245. https://doi.org/10.1080/1540496X.2019.1672531
- Huang, D., Jiang, F., Tu, J., & Zhou, G. (2015). Investor sentiment aligned: A powerful predictor of stock returns. Review of Financial Studies, 28(3), 791–837. https://doi.org/10.1093/rfs/hhu080
- Huang, C., Yang, X., Yang, X., & Sheng, H. (2014). An empirical study of the effect of investor sentiment on returns of different industries. Mathematical Problems in Engineering, 1(1), 1–11. https://doi.org/10.1155/2014/545723
- Hudson, Y., Yan, M., & Zhang, D. (2020). Herd behaviour and investor sentiment: Evidence from UK mutual funds. International Review of Financial Analysis, 71(1), 101494. https://doi.org/10.1016/j.irfa.2020.101494
- Idilbi-Bayaa, Y., & Qadan, M. (2022). Tell me why i do not like Mondays. Mathematics, 10(11), 1850. https://doi.org/10.3390/math10111850
- Ikram, Z. (2016). An empirical investigation on behavioural determinants on, impact on investment decision making, moderating role of locus of control. Journal of Poverty, Investment and Development, 26(1), 44–50.
- Jiang, S., & Jin, X. (2021). Effects of investor sentiment on stock return volatility: A spatio-temporal dynamic panel model. Economic Modelling, 97(1), 298–306. https://doi.org/10.1016/j.econmod.2020.04.002
- Johannesburg Stock Exchange (2022). Industry Classification Benchmark (ICB) [Online]. Available from: https://clientportal.jse.co.za/technical-library/industry-classification-benchmark-(ICB) [Accessed 21 September 2022].
- Jolliffe, I., & Cadima, J. (2016). Principal component analysis: A review and recent developments. Philosophical Transactions of the Royal Society, 374(2065), 1–16. https://doi.org/10.1098/rsta.2015.0202
- Kapoor, S., & Prosad, J. M. (2017). Behavioural finance: A review. Procedia Computer Science, 122(1), 50–54. https://doi.org/10.1016/j.procs.2017.11.340
- Keynes, J. M. (1936). The supply of gold. Economic Journal, 46(183), 412–418. https://doi.org/10.2307/2224879
- Kim, T., & Ha, A. (2010). Investor sentiment and market anomalies. Australasian Finance and Banking Conference, Vol. 1(1), pp. 1–23, 14th–16th December, UNSW Business School, Sydney Australia. https://doi.org/10.2139/ssrn.1663649
- Kim, K., & Ryu, D. (2022). Sentiment changes and the Monday effect. Finance Research Letters, 1(1), 102709. https://doi.org/10.1016/j.frl.2022.102709
- Kim, K., Ryu, D., & Yang, H. (2019). Investor sentiment, stock returns, and analyst recommendation changes: KOSPI stock market. Investment Analysts Journal, 48(2), 89–101. https://doi.org/10.1080/10293523.2019.1614758
- Kumari, J., & Mahakud, J. (2016). Investor sentiment and stock market volatility: Evidence from India. Journal of Asia-Pacific Business, 17(2), 173–202. https://doi.org/10.1080/10599231.2016.1166024
- Kurov, A. (2010). Investor sentiment and the stock market’s reaction to monetary policy. Journal of Banking and Finance, 34(1), 139–149. https://doi.org/10.1016/j.jbankfin.2009.07.010
- Lee, K., & Kim, M. (2019). Investor sentiment and bond risk premia: Evidence from China. Emerging Markets Finance and Trade, 55(4), 915–933. https://doi.org/10.1080/1540496X.2018.1466276
- Le, T., & Luong, A. T. (2022). Dynamic spillovers between oil price, stock market, and investor sentiment: Evidence from the United States and Vietnam. Resources Policy, 78(1), 102931. https://doi.org/10.1016/j.resourpol.2022.102931
- Lim, K. P. (2009). Weak-form market efficiency and nonlinearity: Evidence from the Middle East and African stock indices. Applied Economics Letters, 16(5), 519–522. https://doi.org/10.1080/13504850601032032
- Lin, C. B., Chou, R. K., & Wang, G. H. (2018). Investor sentiment and price discovery: Evidence from the pricing dynamics between the futures and spot markets. Journal of Banking & Finance, 90(1), 17–31. https://doi.org/10.1016/j.jbankfin.2018.02.014
- López-Cabarcos, M. Á., Pérez-Pico, A. M., Piñeiro-Chousa, J., & Šević, A. (2021). Bitcoin volatility, stock market and investor sentiment. Are they connected? Finance Research Letters, 38(1), 101399. https://doi.org/10.1016/j.frl.2019.101399
- López-Cabarcos, M. Á., Piñeiro-Chousa, J., & Pérez-Pico, A. M. (2017). The impact technical and non-technical investors have on the stock market: Evidence from the sentiment extracted from social networks. Journal of Behavioral and Experimental Finance, 15(1), 15–20. https://doi.org/10.1016/j.jbef.2017.07.003
- Lucas, J. R. E. (1978). Asset prices in an exchange economy. Journal of the Econometric Society, 1(1), 1429–1445. https://doi.org/10.2307/1913837
- Luo, J., Demirer, R., Gupta, R., & Ji, Q. (2022). Forecasting oil and gold volatilities with sentiment indicators under structural breaks. Energy Economics, 105(1), 105751. https://doi.org/10.1016/j.eneco.2021.105751
- Lux, T. (2011). Sentiment dynamics and stock returns: The case of the German stock market. Empirical economics, 41(3), 663–679.
- Mahlophe, M. I., & Muzindutsi, P. F. (2017). Testing For Market Anomalies in Different Sectors of the Johannesburg Stock Exchange. International Journal of Economics and Finance Studies, 9(1), 219–234. https://dergipark.org.tr/en/pub/ijefs/issue/36093/405317
- Mandimika, N. Z., & Chinzara, Z. (2012). Risk–return trade‐off and behaviour of volatility on the south african stock market: Evidence from both aggregate and disaggregate data. South African Journal of Economics, 80(3), 345–366.
- Matos, P., Costa, A., & da Silva, C. (2021). COVID-19, stock market and sectoral contagion in the US: A time-frequency analysis. Research in International Business and Finance, 57(1), 101400. https://doi.org/10.1016/j.ribaf.2021.101400
- McGurk, Z., Nowak, A., & Hall, J. C. (2020). Stock returns and investor sentiment: Textual analysis and social media. Journal of Economics and Finance, 44(3), 458–485. https://doi.org/10.1007/s12197-019-09494-4
- Mensi, W., Beljid, M., Boubaker, A., & Managi, S. (2013). Correlations and volatility spillovers across commodity and stock markets: Linking energies, food, and gold. Economic modelling, 32, 15–22.
- Merton, R. C. (1973). An intertemporal capital asset pricing model. Journal of the Econometric Society, 1(1), 867–887. https://doi.org/10.2307/1913811
- Mokoena, S., & Nomlala, B. (2022). Analysis of the relationship between COVID-19 and the stock market performance in South Africa. International Journal of Finance & Banking Studies, 11(2), 25–33. https://doi.org/10.20525/ijfbs.v11i2.1477
- Muguto, H. (2015). Investor sentiment as an explanation of value and size anomalies on the South African Stock Market. Masters Dissertation. University of KwaZulu-Natal, 1–150.
- Muguto, L., & Muzindutsi, P. F. (2022). A comparative analysis of the nature of stock return volatility in BRICS and G7 markets. Journal of Risk and Financial Management, 15(2), 1–27. https://doi.org/10.3390/jrfm15020085
- Muguto, H. T., Rupande, L., & Muzindutsi, P. F. (2019). Investor sentiment and foreign financial flows: Evidence from South Africa. Zbornik Radova Ekonomski Fakultet u Rijeka, 37(2), 473–498. https://doi.org/10.18045/zbefri.2019.2.473
- Muzindutsi, P. F., Obalade, A. A., & Gaston, R. T. (2020). Financial crisis and stock return volatility of the JSE general mining index: GARCH modelling approach. Journal of Accounting and Management, 10(3), 114–123.
- Naeem, M. A., Mbarki, I., & Shahzad, S. J. H. (2021). Predictive role of online investor sentiment for cryptocurrency market: Evidence from happiness and fears. International Review of Economics & Finance, 73(1), 496–514. https://doi.org/10.1016/j.iref.2021.01.008
- Naik, P. K., & Padhi, P. (2016). Investor sentiment, stock market returns and volatility: Evidence from National Stock Exchange of India. International Journal of Management Practice, 9(3), 213–237. https://doi.org/10.1504/IJMP.2016.077816
- Nelson, D. B. (1991). Conditional heteroskedasticity in asset returns: A new approach. Econometrica, 59(2), 347–370. https://doi.org/10.2307/2938260
- Obaid, K., & Pukthuanthong, K. (2022). A picture is worth a thousand words: Measuring investor sentiment by combining machine learning and photos from news. Journal of Financial Economics, 144(1), 273–297. https://doi.org/10.1016/j.jfineco.2021.06.002
- Obalade, A. A., & Muzindutsi, P. F. (2018). Are there cycles of efficiency and inefficiency? Adaptive market hypothesis in three African stock markets. Frontiers in Finance and Economics, 15(1), 185–202.
- Olayeni, O. R., Tiwari, A. K., & Wohar, M. E. (2020). Global economic activity, crude oil price and production, stock market behaviour and the Nigeria-US exchange rate. Energy Economics, 92. https://doi.org/10.1016/j.eneco.2020.104938
- Padungsaksawasdi, C. (2020). On the dynamic relationship between gold investor sentiment index and stock market: A sectoral analysis. International Journal of Managerial Finance, 16(3), 372–392. https://doi.org/10.1108/IJMF-11-2018-0334
- Pandey, P., & Sehgal, S. (2019). Investor sentiment and its role in asset pricing: An empirical study for India. IIMB Management Review, 31(2), 127–144. https://doi.org/10.1016/j.iimb.2019.03.009
- Phuong, L. (2020). Investor sentiment by psychological line index and stock return. Accounting, 6(7), 1259–1264. https://doi.org/10.5267/j.ac.2020.8.026
- Piñeiro-Chousa, J., López, M., Caby, J., & Šević, A. (2021). The influence of investor sentiment on the green bond market. Technological Forecasting and Social Change, 162(1), 120351. https://doi.org/10.1016/j.techfore.2020.120351
- Qadan, M. (2019). Risk appetite, idiosyncratic volatility and expected returns. International Review of Financial Analysis, 65(1), 101372. https://doi.org/10.1016/j.irfa.2019.101372
- Qadan, M., & Aharon, D. Y. (2019). Can investor sentiment predict the size premium? International Review of Financial Analysis, 63(1), 10–26. https://doi.org/10.1016/j.irfa.2019.02.005
- Qadan, M., & Jacob, M. (2022). The value premium and investors’ appetite for risk. International Review of Economics & Finance, 82(1), 194–219. https://doi.org/10.1016/j.iref.2022.06.014
- Qadan, M., & Nama, H. (2018). Investor sentiment and the price of oil. Energy Economics, 69(1), 42–58. https://doi.org/10.1016/j.eneco.2017.10.035
- Rajput, Q., Haider, S., & Ghani, S. (2016). Lexicon-based sentiment analysis of teachers’ evaluation. Applied Computational Intelligence and Soft Computing. https://doi.org/10.1155/2016/2385429
- Rathilal, S. (2021). Cryptocurrency volatility, volatility spillovers and the effect of global investor sentiment. Masters’ dissertation. University of KwaZulu-Natal.
- Rehman, M. U., Sensoy, A., Eraslan, V., Shahzad, S. J. H., & Vo, X. V. (2021). Sensitivity of US equity returns to economic policy uncertainty and investor sentiments. North American Journal of Economics and Finance, 57(1), 101392. https://doi.org/10.1016/j.najef.2021.101392
- Reis, P., & Pinho, C. (2020a). A new European investor sentiment index (EURsent) and its return and volatility predictability. Journal of Behavioral and Experimental Finance, 27(1), 100373. https://doi.org/10.1016/j.jbef.2020.100373
- Ross, S. (1976). The Arbitrage Theory of Capital Asset Pricing. Journal of Economic Theory, 13, 341–360.
- Rupande, L., Muguto, H. T., Muzindutsi, P. F., & Yang, Z. (2019). Investor sentiment and stock return volatility: Evidence from the Johannesburg Stock Exchange. Cogent Economics and Finance, 7(1), 1600233. https://doi.org/10.1080/23322039.2019.1600233
- Ryu, D., Kim, H., & Yang, H. (2017). Investor sentiment, trading behaviour and stock returns. Applied Economics Letters, 24(12), 826–830. https://doi.org/10.1080/13504851.2016.1231890
- Sayim, M., & Rahman, H. (2015). An examination of US institutional and individual investor sentiment effect on the Turkish stock market. Global Finance Journal, 26(c), 1–17. https://doi.org/10.1016/j.gfj.2015.01.001
- Sayim, M., & Rahman, H. (2015). The relationship between individual investor sentiment, stock return and volatility: Evidence from the Turkish market. International Journal of Emerging Markets, 10(3), 504–520. https://doi.org/10.1108/IJoEM-07-2012-0060
- Shamiri, A., & Hassan, A. (2007). Modelling and forecasting volatility of the Malaysian and the Singaporean stock indices using asymmetric GARCH models and non-normal densities. Journal of Malaysian Mathematical Sciences, 46(1), 83–102.
- Shen, J., Yu, J., & Zhao, S. (2017). Investor sentiment and economic forces. Journal of Monetary Economics, 86(1), 1–21. https://doi.org/10.1016/j.jmoneco.2017.01.001
- Shi, J., Ausloos, M., & Zhu, T. (2022). If global or local investor sentiments are prone to developing an impact on stock returns, is there an industry effect? International Journal of Finance & Economics, 27(1), 1309–1320. https://doi.org/10.1002/ijfe.2216
- Shu, H. C., & Chang, J. H. (2015). Investor sentiment and financial market volatility. Journal of Behavioral Finance, 16(3), 206–219. https://doi.org/10.1080/15427560.2015.1064930
- Smales, L. A. (2017). The importance of fear: Investor sentiment and stock market returns. Applied Economics, 49(34), 3395–3421. https://doi.org/10.1080/00036846.2016.1259754
- Smith, G., Jefferis, K., & Ryoo, H. J. (2002). African stock markets: Multiple variance ratio tests of random walks. Applied Financial Economics, 12(7), 475–484. https://doi.org/10.1080/09603100010009957
- So, S. M., & Lei, V. U. (2015). On the relationship between investor sentiment, VIX and trading volume. RISK GOVERNANCE & CONTROL: Financial Markets and Institutions, 5(4), 114–122.
- Sprenger, T. O., Tumasjan, A., Sandner, P. G., & Welpe, I. M. (2014). Tweets and trades: The information content of stock microblogs. European Financial Management, 20(5), 926–957. https://doi.org/10.1111/j.1468-036X.2013.12007.x
- Stambaugh, R. F., Yu, J., & Yuan, Y. (2012). The short of it: Investor sentiment and anomalies. Journal of Financial Economics, 104(2), 288–302. https://doi.org/10.1016/j.jfineco.2011.12.001
- Su, C. W., Cai, X. Y., & Tao, R. (2020). Can stock investor sentiment be contagious in China? Sustainability, 12(4), 1571. https://doi.org/10.3390/su12041571
- Uygur, U., & Taş, O. (2014a). The impacts of investor sentiment on different economic sectors: Evidence from Istanbul Stock Exchange. Borsa Istanbul Review, 14(4), 236–241. https://doi.org/10.1016/j.bir.2014.08.001
- Uygur, U., & Taş, O. (2014b). The impacts of investor sentiment on returns and conditional volatility of international stock markets. Quality and Quantity, 48(3), 1165–1179. https://doi.org/10.1007/s11135-013-9827-3
- Vengesai, E., Obalade, A. A., & Muzindutsi, P. F. (2022). Country risk dynamics and stock market volatility: Evidence from the JSE cross-sector analysis. Journal of Economics and Financial Analysis, 5(2), 63–84. https://doi.org/10.1991/jefa.v5i2.a46
- Wang, W., Su, C., & Duxbury, D. (2022). The conditional impact of investor sentiment in global stock markets: A two-channel examination. Journal of Banking & Finance, 138(1), 106458. https://doi.org/10.1016/j.jbankfin.2022.106458
- Wang, G. J., Xiong, L., Zhu, Y., Xie, C., & Foglia, M. (2022). Multilayer network analysis of sentiment and stock returns. Research in International Business and Finance, 62(1), 101707. https://doi.org/10.1016/j.ribaf.2022.101707
- Xavier, G. C., & Machado, M. A. V. (2017). Anomalies and investor sentiment: Empirical evidence in the Brazilian market. Brazilian Administration Review, 14(3), 1–29. https://doi.org/10.1590/1807-7692bar2017170028
- Yang, X. A. (2019). Theorizing the BRICS: Does the BRICS challenge the current global order? In The International Political Economy of the BRICS. Routledge.
- Yang, H., Ryu, D., & Ryu, D. (2017). Investor sentiment, asset returns and firm characteristics: Evidence from the Korean stock market. Investment Analysts Journal, 46(2), 132–147. https://doi.org/10.1080/10293523.2016.1277850
- Zahera, S. A., & Bansal, R. (2018). Do investors exhibit behavioral biases in investment decision making? A systematic review. Qualitative Research in Financial Markets, 10(2), 210–251. https://doi.org/10.1108/QRFM-04-2017-0028
- Zhang, Z., Chen, R., & Luo, Q. (2021). Firm-specific investor sentiment, stock price synchronicity, and crash risk. Applied Economics Letters, 1(1), 1–6. https://doi.org/10.1080/13504851.2021.1991562
- Zouaoui, M., Nouyrigat, G., & Beer, F. (2011). How does investor sentiment affect stock market crises? Evidence from panel data. Financial Review, 46(4), 723–747. https://doi.org/10.1111/j.1540-6288.2011.00318.x