
 ?Mathematical formulae have been encoded as MathML and are displayed in this HTML version using MathJax in order to improve their display. Uncheck the box to turn MathJax off. This feature requires Javascript. Click on a formula to zoom.
Abstract
In a context where many African populations are excluded from the traditional banking system, financial inclusion appears to be a determining factor in enabling agents in need of financing, notably producers and consumers, to have easy access to financial services in order to contribute to the multiple efforts of economic and social progress of nations. However, to date, the literature remains silent on the optimal level of financial inclusion that can boost growth. Consequently, this paper aims to verify whether there is a non-linear relationship between economic growth and financial inclusion in the WAEMU zone. Econometric applications based on the PCSE (panel-corrected standard error) model on a panel of eight countries for the period 2014–2018 reveal a U-shaped relationship between the extended banking rate and economic growth. Economic growth shows two different behaviours depending on whether one is on the side of one or the other of the regimes inherent to the inflection point. In view of these results, we suggest that the public authorities: i) intensify campaigns to open accounts in local languages, ii) promote the development of online sales applications for goods and services, iii) pursue the dematerialisation of financial operations within public administrations. Finally, this paper paves the way for future research on the microeconomic component and a similar treatment of the subject, but taking into account the occurrence of the Covid pandemic19.
1. Introduction
Over the last two decades, economic growth has been a topic of constant reflection by actors around the world. At the level of the developed countries, there has been a wealth of research to date, of which Abate and Abate (Citation2022) and Spyromitros and Panagiotidis (2022) are among the most recent. Similarly, from the development of the neo-classical growth model by Solow (Citation1956) and Swan (Citation1956) to the advent of endogenous growth models (Romer, Citation1986; Lucas, Citation1988; Barro, Citation1990), this phenomenon has been applied in most sub-Saharan African countries in general (Abessolo, Citation1998; Basu et al., Citation2005; Ndambiri et al., Citation2012) and in the UEMOA countries in particular (Combey, Citation2017; Dedewanou, Citation2016). As a reminder, UEMOA is a West African organisation comprising eight (08) countries (Benin, Burkina Faso, Guinea-Bissau, Mali, Niger, Senegal and Togo and Côte d’Ivoire) and was created in January 1994.
Overall, all the above studies reveal that, apart from capital (K) and labour (L), many other factors (education, infrastructure, trade openness and quality of institutions) also play a role in explaining economic growth. But at a time when New Information and Communication Technologies (NICTs) are growing rapidly and continuously, one of them namely financial inclusion is a major concern for policy makers in several countries (Dinabandhu & Et Debashis, Citation2018). This is because universal access to financial services by households can boost growth by giving rise to a multiplier effect from credit (Ghosh, Citation2011) or by reducing poverty and vulnerability (Koomson et al., Citation2020). Moreover, as we enter the last decade of the 2030 Agenda, financial inclusion is an integral part of eight of the 17 Sustainable Development Goals (SDGs).
In the literature, the relationship from financial inclusion to economic growth is of both theoretical and empirical interest. Theoretically, this relationship can be understood through several theories that can be divided into two groups depending on whether they inform about the existence of a positive or negative effect of financial inclusion on growth. On the positive side, there are two theories, namely the theory of financial growth (Bagehot, Citation1873) and the theory of financial intermediation (Diamond, Citation1984). On the negative side, there is only one theory, namely the theory of information asymmetry (Akerlof, Citation1970). Empirically, there is ample evidence of a positive effect of financial inclusion on growth from authors such as (Kpodar & Et Andrianaivo, Citation2011; Wong, Citation2015; Kim et al., Citation2017; Sethi & Acharya, Citation2018). On the other hand, although rare, those of a negative effect can be traced to the work of (Moore & Craigwell, Citation2003; Naceur & Et Samir, Citation2007; Pearce, Citation2011).
These empirical verifications, coupled with the theories, show that the role of financial inclusion in explaining growth is a hot and controversial topic. Therefore, looking at this relationship in the context of the WAEMU zone can lead to either of these results. Except that financial inclusion and economic growth in this area show similar behaviour. For example, with the exception of 2011 when its growth rate was only 0.8%, the WAEMU has posted real GDP rates of over 4% since the end of the international crisis in 2008 and 2009. Specifically, the union’s growth rate rose from 5.9% to 6.6% between 2013 and 2014 before rising to 6.5% in 2015 (WAEMU Commission, 2015). These rates, which are higher than those posted by the CEMAC during the same period, reflect the good performance of economic activity in the zone. Similarly, the progress made between 2017 and 2018 such as: i) the increase from 40 service points per 10000 adults to 56 service points per 10000 adults, for the overall demographic penetration rate, and from 76 service points per 1,000 km2 to 111 service points per 1,000 km2 for the overall geographical penetration rate, ii) the 0.13% drop in the nominal interest rate applied by banks on deposits and the increase in the rate applied to loans granted in the same proportion, and iii) the average level of financial inclusion in the union (BCEAO, Citation2019); all show the positive evolution of financial inclusion in the zone.
However, despite its good performance in terms of financial inclusion, the WAEMU still fails to achieve the 7% growth rates that Clarke (Citation2013) argues would be useful for Africa to significantly reduce its poverty. Moreover, since over-financing can lead to a decline in the growth rate (Bhattarai, Citation2015), it is not clear that financial inclusion and growth can continue to increase in the same direction indefinitely. Therefore, the added value of our work is to check whether it is possible to reconcile the positive and negative effects, mentioned above. In the same vein, we make a methodological departure in this study, by using a Standard Error Correction Panel (SECP) model to make our estimates, unlike previous work where the authors use more classical panel models. The choice of this model is justified by, among other things, its ability to correct the problems of heteroscedasticity and contemporary autocorrelation posed by the predominance of individuals in the panel of eight WAEMU countries.
Beyond the above, the motivation for this study lies at two levels. First, we want to place this article in the logic of the literature on threshold effects. In other words, we want to know if there is a non-linear relationship between financial inclusion and economic growth; as has been shown for the relationship between financial development and economic growth (Berthélemy & Et Aristomène, Citation1996; Rioja & Et Valev, Citation2004). Secondly, we intend to see if the behaviour of economic growth suggests that WAEMU economies are sensitive to the development of financial inclusion in view of the package of actions implemented over the period under review, namely: (i) the development of financial inclusion strategies at the national level, (ii) the implementation of multiple financial inclusion mechanisms at the regional level as well as their monitoring mechanisms, and (iii) the implementation of policies and programmes dedicated to strengthening financial inclusion.
Finally, the question that arises is: what is the nature of the relationship between financial inclusion and economic growth in the UEOMA zone? To answer this question, this paper proposes to determine the nature of the relationship between financial inclusion and economic growth in the WAEMU. The hypothesis is that there is a U-shaped relationship between financial inclusion and economic growth in the WAEMU. Apart from the abstract and bibliography, the structure of this paper is as follows: 1) Introduction, 2) Literature review, 3) Methodology and data, 4) Discussion and empirical results and 5) Conclusion and implications.
2. Literature review
2.1. Financial inclusion and growth: some theoretical aspects
In economics, the role of finance in the analysis of growth has not yet been recognised, notably because of the Modigliani-Miller theorem and the efficient market hypothesis, which stipulate that the capital market is perfect. However, these various postulates are not entirely true since in reality, buying and selling of securities is subject to transaction costs. As a result of these arguments, several theoretical perspectives have emerged, which can be divided into three approaches. These are: Schumpeter’s earlier approach, the financial intermediation and the financial instability approach. The first approach, developed in 1911 by Schumpeter, states that variations in economic growth at a given moment can come from the financial sector. But that this effect is indirect; in the sense that it comes through innovation and accessibility to capital formation on the one hand and through investments that can be induced by commercial competition between banks on the other. From this perspective, it can be said that financial inclusion is an important axis for planning economic growth.
In support of the previous approach, the second approach, which is supported by authors such as Arestis and Et Demetriades (Citation1997), Levine (Citation1997), and Demetriades and Et Law (Citation2004), advocates that financial development is indispensable for socio-economic development because it fosters an enabling environment for growth. In this sense, a developed financial system offers a wide possibility for economic agents to access funds other than their own in order to consume, invest in human capital or create income-generating activities. This is undoubtedly likely to stimulate growth through internal demand, innovation and employment. Similarly, this sequencing can also be the case for financial inclusion, since when the banking sector is developed, households can be provided with credit at low rates and in a timely manner (Chhikara & Et Kodan, Citation2011).
In contrast to the first two approaches, the third approach, which for clarification is advocated by authors such as Minsky (Citation1964), McKinnon (Citation1973), Shaw (Citation1973), and King and Et Levine (Citation1993a) and King & Et Levine (Citation1993b); assumes that financial instability creates an unfavourable climate for growth. This is because in an environment where the number of banks is increasing and competition between them is increasing, this can lead to riskier credit offers. Moreover, by advocating intervention scenarios by monetary policy makers in case of losses, banks may fall victim to a moral hazard problem and start granting loans at explosive rates. This can lead to a slowdown in economic activity due to the misallocation of resources induced by the instability of the investment rate and the real exchange rate.
From this brief theoretical review, it appears that the first two approaches support the hypothesis that financial inclusion can boost economic growth while the third approach opposes it.
2.2. Financial inclusion and growth: some empirical work
The relationship from financial inclusion to economic growth has been the subject of several empirical tests. In this section, we review some of them. Note that these can be divided into two groups: the group of works that provide evidence of a positive relationship between these two phenomena and the group of works that provide evidence of a negative relationship. With regard to the first group, Kpodar and Et Andrianaivo (Citation2011) analyse the impact of information and communication technologies (ICT) on economic growth in a sample of African countries for the period 1988–2007. In the same vein, they investigate whether financial inclusion is one of the channels through which mobile phone development influences growth. To this end, they use a wide range of ICT indicators, including mobile and fixed-line penetration rates and local call costs, and variables measuring access to financial services, such as the number of deposits or loans per capita. The estimation of a dynamic panel system model shows that ICT, including mobile phone development, contributes significantly to economic growth in African countries and that part of the positive effect of mobile phone penetration on growth comes from increased financial inclusion.
For his part, Yorulmaz (Citation2016) constructs a financial inclusion index for EU member and candidate countries to measure the extent of financial inclusion across countries over time. In addition, he tests the association between the financial inclusion index and selected macroeconomic variables (i.e. GDP per capita, adult literacy rates, rural populations, unemployment rates, Gini coefficients and the human development index) under the demand hypothesis. The results show a positive and significant correlation between the financial inclusion index and income, and between financial inclusion and human development.
For their part, Sethi and Acharya (Citation2018) assess the dynamic impact of financial inclusion on economic growth for a large number of developed and developing countries. To achieve their objective, they use panel data models such as country fixed effect, random effect and time fixed effect regressions. But to avoid spurious regression, they use cointegration to test the long-run association between financial inclusion and economic growth. The data on financial inclusion is taken from Sarma (Citation2012) for the period 2004–2010.As results, they find that there is a positive and long-run relationship between financial inclusion and economic growth in 31 countries around the world.
More recently, Nguling’wa (Citation2019) examines the impact of financial inclusion on economic growth using a panel of 25 Sub-Saharan African countries, each observed over six years from 2009 to 2014. It tests whether an increase in the level of financial inclusion affects growth. Results based on two-way fixed and random effects model estimation reveal the impact of financial inclusion on economic growth. Regarding the second group, Moore and Craigwell (Citation2003) agree with the traditional financial theory that the size of a loan increases the interest rate on that loan to account for the accumulated risk associated with the loan. However, using firm-level data from the Barbadian banking sector, they observe that the smaller the loan size, the higher the interest rate charged, and vice versa. Using a fixed-effect panel model, they also show that the differences in interest rates between loan sizes can be mainly explained by borrower characteristics for local banks, while for foreign banks its operational characteristics were the most important factor. This may work against economic activity and thus economic growth in case of information inequality.
Similarly, Naceur and Et Samir (Citation2007) also address the broad theoretical debate on the fundamental relationship between financial development and economic growth. To do so, they conduct an empirical study using a panel of unbalanced data from 11 MENA countries. The econometric problems focus on the estimation of a dynamic panel model. Their empirical results reinforce the idea that there is no significant relationship between banking and stock market development and growth. Moreover, the association between banking development and economic growth is even negative after controlling for stock market development. In conclusion, these authors suggest that this lack of relationship should be related to underdeveloped financial systems.
Finally, Pearce (Citation2011) identifies constraints, opportunities and priorities for significantly improving access to finance, which can drive growth. First, governments could agree on a financial inclusion strategy that is based on improved data, engages both the public and private sectors, and expands financial access on a large scale. Second, regulators should provide a legal and supervisory framework for expanding access to finance primarily through banks, but with regulatory space for the use of agents, mobile phone technology and a finance company model for microcredit and leasing.
Interest rate caps on microcredit should be removed and, instead, consumer protection and supervisory capacity for microfinance should be strengthened, while encouraging prudent competition among financial service providers. Third, financial infrastructure must remain a priority area, in particular credit information and secure transactions.
In light of the above, there is a lack of work on the non-linearity between financial inclusion and growth; in contrast to the financial development-growth relationship (Eggoh, Citation2009; Eggot & Et Villieu, Citation2013; Kuipou et al., Citation2015; Le et al., Citation2016; Avoutou, Citation2019; Eggot & Et Villieu, Citation2013). Therefore, this work can be considered as a first attempt for a group of developing countries, especially as it requires sophisticated econometric tools. This is the case of the PCSE model, which no contemporary author has used to date to test our working hypothesis and which has the advantage of being robust in the presence of a homogeneous group.
3. Data and methodology
With reference to the theoretical model of economic growth of the neoclassical type that we will adapt and specify in the following, we use two types of variables to model the phenomenon of economic growth in the WAEMU zone. However, following the example of Kuipou et al. (Citation2015) and Avoutou (Citation2019), we retain the growth rate of real GDP per capita (RGDP) as a proxy for economic growth for our various estimates. As for the other candidate variables (variable of interest and control) for the different econometric applications, they are as follows:
3.1. Variable of interest
In the framework of this work, financial inclusion (Z) is measured by three dimensions (access, use and affordability) out of four as defined by the Central Bank of West African States (BCEAO). The lack of use of the “well-being” dimension is essentially justified by the lack of data. In the WAEMU:
Two indicators integrate the “Access” dimension, namely: (i) the overall demographic penetration rate of financial services (TGPSFd) measuring the proximity of financial services to the population and (ii) the overall geographical penetration rate of financial services (TGPSFg) which assesses the number of service points available on an area of 1,000 km2.
Two main indicators make up the “Use” dimension: (i) the strict bancarisation rate (TBS) which determines the percentage of the adult population holding an account in banks, postal services, national savings banks and the Treasury, (ii) the extended bancarisation rate (TBE) which complements the strict bancarisation rate by the percentage of the adult population holding an account in micro-finance institutions.
Finally, two indicators make up the “Accessibility-price” dimension: (i) the nominal interest rate on deposits (TINd), which measures the remuneration of savings at the level of banks and decentralised financial systems, and (ii) the nominal interest rate on loans (TINc), which provides information on the costs borne by clients to access loans granted by banks and decentralised financial systems.
3.2. Control variables
Apart from the traditional growth variables of capital (K) and labour (L), which are respectively measured by the investment rate (Inv; as in Pagano, Citation1993) and the population growth rate noted Tcpop (as retained by Eggoh, Citation2009; Eggot & Et Villieu, Citation2013), other variables are included in this category. These include: trade openness (Ouv), human capital (Kh) measured by the gross primary school enrolment rate, foreign direct investment (Ride; Avoutou, Citation2019; Kuipou et al., Citation2015) and the overall governance index (IndSym), which is based on the average of six governance indicators (citizen participation and accountability—the ability of citizens to choose their leaders, enjoy political and civil rights, and have an independent press; political stability; and freedom from violence—the likelihood that a state will not be overthrown by unconstitutional or violent means, effectiveness of government—quality of public service delivery and competence and political independence of the civil service, regulatory burden—relative absence of state regulation of product markets, banking and foreign trade, rule of law—protection of people and property from violence and theft, independence and effectiveness of the judiciary and respect for contracts, and absence of corruption—no abuse of power for private interests) as in Kaufmann et al. (Citation1999) and Edison (Citation2003).
In sum, the below summarises the key information on all the variables we have just described. In other words, it reiterates the nature of each variable, the symbol we have assigned to it and the potential sign of the coefficient that will be associated with it after estimation.
Table 1. Expected signs of explanatory variables
3.3. Data source
The data used in this study concern the eight member countries of the WAEMU zone (Benin, Burkina Faso, Guinea-Bissau, Mali, Niger, Senegal, Togo and Côte d’Ivoire). They cover the period from 2014 to 2018, resulting in an average sample size of 32 observations. According to the law of large numbers, we can say that our data follow the normal distribution and therefore lend themselves well to the use of econometric techniques required by microeconomic panel models such as the PCSE model. A confirmation of this hypothesis was given to us, at the statistical level, by the Jarque-Bera normality test, the results of which are reported in Appendix 1 and confirm the idea that our data are normally distributed. Furthermore, our data are credible since they come from certified national and international sources, available and accessible to researchers wishing to exploit them for the advancement of science and to help public authorities make decisions, for example. Specifically, these are statistical yearbooks and BCEAO databases, with the exception of the institutional quality variables and the gross enrolment ratio at primary level, which we have extracted from the World Bank database. Furthermore, the choice of this study period is justified by, among other things, the unavailability of data, in this case for the components of the composite governance indicator, and the concomitant shocks. In addition, this period takes into account the start of the SDGs and the slowdown of economies around the world due to the fall in the price of Brent crude oil. It also allows other researchers to make comparisons between the pre- and post-Coronavirus pandemic era.
3.4. Models and techniques for estimating PCSE
3.4.1. Economic model
In the context of this work, the model on which the econometric applications will be based is the neoclassical Solow-Swan model (designed in the 1950s), but augmented. Its choice is justified by the fact that it represents the basis of growth theory and allows us to add the financial inclusion variable in an attempt to explain the origin of the productivity residual within the WAEMU zone. Following the linear and homogeneous Cobb-Douglas production function, it is presented as follows:
where Y(t), K(t), L(t) and A(t) are respectively the volume of production, the capital factor, the labour factor and the technological progress during the analysis time t. Unlike the other components of equation (1), technological progress grows at an exogenous and constant rate g i.e.:
In this equation, g and w represent respectively the exogenous growth rate of technological progress and the financial variable that can affect the level of technology.
3.4.2. Econometric model
Assuming that financial inclusion is symbolised by INCLUF and that we take into account that it can induce growth as shown by (McKinnon, Citation1973; Shaw, Citation1973; Goldsmith, Citation1969; King & Et Levine, Citation1993a), we can have the following equations
But to be able to test the existence or not of a non-linear relationship, we insert a quadratic term in Equationequation (5)(5)
(5) in the image of the empirical studies testing the hypothesis of the Kuznets environmental curve (Dinda, Citation2004). Thus we have:
Two forms of this relationship can be obtained, among others, depending on the values taken by the coefficients g and p.
if
: the shape of the relationship between financial inclusion and growth is an inverted « U ;

if

From the above, the empirical models that can be estimated have the following implicit forms, with ε the set of disturbances:
Tcpibr = (TGPSFd, (TGPSFd)2, IndSym, Ouv, Tcpop, Tbsp, Ride, ε): Model 1
Tcpibr = (TGPSFg, (TGPSFg)2, IndSym, Ouv,Tcpop, Tbsp, Ride, ε): Model 2
Tcpibr = (TBE, (TBE)2, IndSym, Ouv, Tcpop, Tbsp, Ride, ε): Model 3
Tcpibr = (TBS, (TBS)2,IndSym, Ouv, Tcpop, Tbsp, Ride, ε): Model 4
Tcpibr = (TINd, (TINd)2, IndSym, Ouv, Tcpop, Tbsp, Ride, ε): Model 5
Tcpibr = (TINc, (TINc)2, IndSym, Ouv, Tcpop, Tbsp, Ride, ε): Model 6
3.4.3. Technical estimation
Proposed by Beck and Katz (Citation1995), among others, the PCSE is an estimator that pools information across clusters to estimate error variances. It is the vector with T elements, which can be grouped as a T × N matrix where the are columns, i.e. E =
. In addition, the corrected variance/covariance matrix of the
is as follows: PCSEV Ar
=
Note that it is a “sandwich estimator” of the order of the robust Huber-White estimator, with the only difference being the use of the “Kronecker product for the calculation of
. Assume that the estimated variance of the error term for cluster 1 is:
. For each individual unit, the variance of its error term is estimated as the MSE of its residuals. In the case of the CPCHE, this estimate is assumed to apply to all time points in cluster 1. That is, the CPSE leads to estimates for cluster 1 that look like this:
The estimates in the CPSE diagonal are accurate because they average several observations of error terms to estimate the variance of the error. Indeed, they combine the residuals across all time points, since a central assumption of the model is that the “contemporaneous correlation between units” follows a fixed pattern. This approach assumes that the inter correlation between units is the same for all time points.
4. Empirical results
4.1. Trends in financial inclusion and growth
In this section, we provide an overview of the behaviour of economic growth in relation to each dimension of financial inclusion through the graphs and the correlation coefficient matrix, as follows:
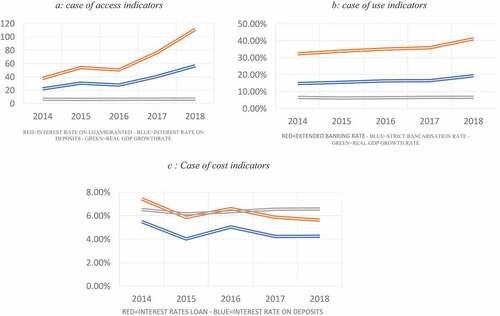
Graph 1a shows that in 2015, the geographical and demographic penetration rates declined from 2014 to 2015 and alternated between 2016 and 2018. The improvement in the two access rates to financial services over the study period is evidence of a favourable evolution in the supply of financial products and services. The changes in access indicators are mainly due to the multiplication of distribution networks for electronic money services. These networks are based on local shops that do not necessarily require a large investment. This gives e-money services a comparative advantage in terms of proximity to the population. Figure shows a consecutive increase over the entire period under review in the three financial inclusion indicators measuring the use component. In fact, the difference between the strict and the broad bancarisation rate shows a consecutive increase over the entire analysis period in the proportion of account holders in microfinance institutions. The Union’s strict bancarisation rate and extended bancarisation rate recorded their highest values in 2018, i.e. 19.34% and 41.05% respectively, over the study period. With regard to the financial landscape of the zone, the increase observed in the evolution of these rates over the period under review can be explained by the increase in the rate of use of electronic money services within the zone. Indeed, this rate increased by more than 30% between 2010 and 2018. Since its values increased from 0.18% to 34.0% during this period. Consideration of graph 1c shows that the interest rate on deposits at the level of banks has positive values throughout the period when in 2014 the zone posted its record rate of almost 6%. Since then, the deposit interest rate has shown a relatively small variation. As regards interest rates on loans granted, it is clear that their values are higher than the values of interest rates on deposits over the same working period. However, on the whole, the interest rate curves for deposits and loans have a common appearance in that the turning points they have are almost identical. This is indicative of prudent management by the second tier banks in the Union.
Figure 1. Percentage change per year in financial inclusion and economic growth indicators.
4.2. Correlational analysis
In addition to presuming possible links in the statistical sense between each variable of interest and the variable being explained, the study of correlation is useful for checking whether our variables of interest are correlated with each other. In other words, it is a framework that allows us to determine whether the association of our variables of interest can give rise to the multicollinearity problem.The results of the correlation test are reported in .
Table 2. Correlation coefficient matrix
The reading of this table shows us that two variables out of seventeen are statistically correlated with the growth rate. These are TINc and TINc2, which leads us not to retain them for the rest of our econometric approach, i.e. the regression analysis. This discrimination is justified in part by the fact that regression involves assessing the sensitivity of non-significant candidate variables to economic activity. On another note, most of our variables of interest are related to each other. To illustrate, we have (i) TBE is correlated with TINd, TGPSFd, TGPSFg, TBS and Indsym, (ii) TINd is correlated with TGPDFd, TGPSFg and TBS. Faced with these situations and if the various pre-estimation tests prove conclusive, we will be called upon to estimate as many models as we have variables of interest.
4.3. Preliminary tests
To ensure that the model we have stated since the introduction is compatible with the nature of our data, we present and run the following tests:
5. Cointegration test
In this study, the cointegration test used to carry out the analysis is the Kao (Citation1999) test, which is a generalisation of the Dickey and Fuller (DF) and Augmented Dickey and Fuller (ADF) tests in the context of panel data. Accepting the null hypothesis means that there is no cointegrating relationship between the variables. Note that this test assumes the homogeneity of the cointegrating vector between individuals. In other words, it does not take into account the heterogeneity of the coefficients under the alternative hypothesis. In order to test the null hypothesis of non-cointegration, i.e. ρ = 1 against the alternative hypothesis ρ < 1, the residual ADF test proposed by Kao (Citation1999) is based on the following regression:
Under the null hypothesis, the Kao ADF statistic converges to a central reduced normal distribution.
6. Hausman test
This test is used to discriminate between a fixed effects model and a random effects model. To do this, two hypotheses are proposed, namely H0: The appropriate model is the random effects model. There is no correlation between the error term and the independent variables in the panel data model; , H1: The appropriate model is the fixed effects model. The correlation between the error term and the independent variables in the panel data model is statistically significant;
. Furthermore, the idea of this test is that under the null hypothesis of independence between the errors and the explanatory variables, the two estimators are unbiased, so the estimated coefficients should differ.
7. Heteroskedasticity test
Under the null hypothesis of homoscedasticity, this test developed by Green (Citation2003) verifies whether the variance of the error of each WAEMU country is identical in order to use the ordinary least squares (OLS) covariance matrix for statistical inference. Similarly, it requires a fixed model whose residuals are amenable to a modified Wald test to test for the presence of group heteroscedasticity.
8. Contemporary autocorrelation test
Closely related to the Dynamic Least Squares (DOLS) logic of Stock and Et Watson (Citation1993), this test proposed by Pesaran (Citation2003) shows that in the absence of error autocorrelation, the introduction of the mean y and its lagged value into the model is sufficient to asymptotically filter out the effects of the unobservable common component as soon as N tends to infinity. Thus, it corresponds to a DF model augmented in the inter-individual dimension or CADF model. Indeed, we have H0: the residuals are not linked by a reproduction process and H1: the residuals are linked by a reproduction process. The application of all these procedures gave rise to the results reported in in the respectively for the stationarity test and the four other tests (cointegration, Hausman, heteroscedasticity and contemporary autocorrelation tests).
Table 3. PCSE model pre-estimation test results
This table shows us that out of four models, only two of them, namely models 3 and 4, can be estimated from a PCSE. This is because they are jointly affected by the problems of heteroscedasticity and contemporaneous autocorrelation; allusion made to the significance of the statistics associated with each of these tests at the 5% threshold. Therefore, our estimates will only focus on models 3 and 4; where the Residual_ADF test attests that the stationary variables selected in these two models are cointegrated.
8.1. Interpretations and discussions of the estimates
The econometric procedure followed in this work resulted in estimates that are reported in the :
Table 4. PCSE model estimation results
These results are of good quality in two respects. Firstly, because their coefficients of determination (R-squared) are 64% for model 3 and 54% for model 4. In other words, the explanatory variables of these models explain more than 50% of the economic activity of the WAEMU. Secondly, the coefficient associated with the Wald statistic is significant in both models; proof that there is at least one significant variable in these models. More specifically, the significant variables in these models are TBE, TBE2, Indsym, Ouv, Tcpop, Tsp, TBS and TBS2. Furthermore, it should be noted that two of our significant variables of interest have the expected signs, namely TBE = −0.244˂0 and TBE2 = 0.0019 > 0. This being the case, we can conclude that there is a U-shaped relationship between financial inclusion and economic growth in the WAEMU zone. In other words, the relationship between bancarisation and growth is first decreasing and then increasing. This relationship is robust, especially since the estimation by the generalized least squares method (FGLS) with Bootstrap led to similar results, which confirm the theory of information asymmetry (Akerlof, Citation1970) and go in the same direction as those obtained by Moore and Craigwell (Citation2003), Naceur and Et Samir (Citation2007) and Pearce (Citation2011) respectively for Barbados and MENA. Indeed, these authors provide evidence that financial inclusion is a brake on economic growth.
With respect to the UEMOA zone, these results assume that the increase in the number of banked people induced by the policy of setting up banking institutions in the zone has not only caused competition between them but also appealed to economic agents (households and firms) with risky financing needs. This, by giving rise to the problem of information asymmetry (for Zogning (Citation2017) in sub-Saharan Africa, there are few or no alternative sources of information to corroborate the information provided by companies applying for credit), has played a role that is not favourable for growth. As a reminder, between 2014 and 2016, banks in the WAEMU showed high risks of loan default. The increase in arrears reflects the high risk of moral hazard and adverse selection faced by banks in the Union and reflects a low probability of repayment during the period. This low probability of loan repayment, especially compared to that of banks in the EU area during the same periods, partly accounts for the existence of moral hazard and adverse selection phenomena that can bias banks’ decisions on credit supply. Aware of this bias, the WAEMU Council of Ministers adopted the uniform law regulating the activity of credit information bureaus at its session of 28 June 2013 for inclusion in the internal legal order of member states.
The objective of this law was the creation and operation of a credit information sharing system between the countries of the Union in order to reduce information asymmetry, but it was in 2017 that this system became effective in the zone. On the other hand, they imply that bancarisation is called upon to play a driving role in explaining growth in the WAEMU zone through job creation, credit supply and poverty reduction. With regard to employment, it is expected that the expansion of the banking landscape in the zone will offer young people, particularly those leaving training schools, the possibility of exercising highly qualified functions within the system, and therefore of being able to consume. With regard to credit, it should be noted that many producers rely on bank financing to boost their activities, whether in agriculture in the broad sense, industry or services. In addition, credit facilitates the acquisition of equipment and the adoption of technologies that can make their production units more efficient and, for large enterprises, strengthen their participation in global value chains. With regard to poverty, banks, as part of their social responsibility, are obliged to build roads that promote multi-faceted exchanges between several agents. Also, they transfer money or goods in kind to the target populations in the framework of programmes aimed at improving the living conditions of the populations. These points of reflection at the factual level are based, among others, on the fact that: (i) uses increased by CFAF 3,956.70 billion or 16.8% to CFAF 27,535.8 billion at the end of December 2016 against CFAF 23,579.1 billion at the end of December 2015, due to the increase in credits and other uses, especially investment securities; (ii) as a proportion of GDP, the Union’s private credit increased from 28.5% in 2015 to 28.7% in 2016. As for credit to the government, it remains low (11.0% of GDP against 8.3% of GDP in 2015); (iii) in the WAEMU zone, the Decentralised Financial Systems (DFS) are organised into three categories, namely mutual savings and credit institutions (MSCIs), associations and companies. However, in recent years, they are also increasingly moving into mobile banking, e-money, quick money transfer and microinsurance operations. The microfinance sector has evolved significantly over the last decade. Indeed, even if the number of institutions carrying out the activity has decreased due to the restructuring and reorganisation of the sector, from 1,052 in 2005 to 702 at the end of 2016, the level of activities has not stopped growing.
9. Conclusion and policy implications
Since the crises of 1929 and 2008, successive governments in almost every country in the world have made the pursuit of economic growth a priority. In this scheme, knowledge of the explanatory factors is necessary. Thus, apart from capital and labour, several factors are currently determining growth. Among these is financial inclusion, whose relationship with growth is not necessarily linear. In order to ascertain whether the relationship between financial inclusion and growth is linear or not, we have placed this work in the wake of threshold effects. To test our research hypothesis we used data from various sources (but concerning the same base) and a PCSE model. In terms of theoretical literature, two views were put into perspective: the one that advocates the existence of a positive relationship between financial inclusion and growth and the one that refers to the existence of a negative relationship. As for the empirical literature, it shows controversial works. In the sense that some lead to thresholds while others refute their presence. After estimating two models, it emerges that there is a non-linear relationship between the “use” dimension of financial inclusion and growth. Thus, the rate of bank penetration has a non-linear U-shaped relationship with economic growth in the Union.
In view of this result, we suggest that public authorities should: (i) intensify the campaigns to open accounts in local languages. This recommendation is based on the fact that in rural areas, for example, many people are not familiar with the concept of accounts. In this respect, it would be appropriate to organise mass awareness campaigns in their languages in order to help them better understand the advantages of having an account, whether it is a bank account or not; (ii) promote the development of online sales applications for goods and services. The idea here is to enable small producers in particular to have access to a specific group of consumers throughout the sub-region. In practical terms, the IT offices should help these producers to be alerted by SMS each time a request is made and to respond as quickly as possible via a delivery system created for this purpose and (iii) pursue the dematerialisation of financial operations within public administrations. In this respect, it would be interesting, for example, to use Orange Money to transfer money to vulnerable people as a form of public solidarity.
Finally, this paper paves the way for future research on: (i) a microeconomic component; in the sense that the use of micro data can provide more information on the impact of access to non-conventional financial services on household production, whether agricultural or not; (ii) a similar treatment of the subject, but taking into account the occurrence of the Covid pandemic19; (ii) a similar treatment of the subject, but taking into account the occurrence of the Covid pandemic;19 since taking this shock into account can help stabilise the econometric model and, above all, to simulate and anticipate the behaviour of these two economic variables, in the event that a similar event occurs in the future. This would mean that a comparison should be made between the period before and after Covid19 to assess the gap caused by containment, for example.
Disclosure statement
No potential conflict of interest was reported by the author(s).
Additional information
Funding
References
- Abate, C. A., & Abate. (2022). The relationship between aid and economic growth of developing countries: Does institutional quality and economic freedom matter?. Cogent Economics & Finance, 10(1). https://doi.org/10.1080/23322039.2022.2062092
- Abessolo, Y. (1998). Les Déterminants de la Croissance Economique en Afrique subsaharienne: Une Analyse Empirique. Working paper 29, (in CED, Université Montesquieu-Bordeaux4).
- Akerlof, G. (1970). The market for lemons: Quality uncertainty and the market mechanism. Quarterly Journal of Economics, 84(3), 488–18. https://doi.org/10.2307/1879431
- Arestis, P., & Et Demetriades, O. (1997). Financial development and economic growth: Assessing the evidence. The Economic Journal, 107(442), 783–799. https://doi.org/10.1111/j.1468-0297.1997.tb00043.x
- Avoutou, M. (2019). Lien entre Développement Financier et Croissance Economique: La Fragmentation Ethnique, un Handicap ? Revue “Repères et Perspectives Economiques. [En ligne], 3(2). https://doi.org/10.34874/IMIST.PRSM/RPE/16828
- Bagehot, W. (1873). Lombard Street (1962) ed.). Richard D. Irwin.
- Barro, R. (1990). Government spending in a simple model of economic growth. Journal of Political Economy, 98(5, Part 2), 103–125. https://doi.org/10.1086/261726
- Basu, A., Calamitsis, E., & Et Ghura, D. (2005). Adjustment and growth in sub-saharan Africa. Working Paper 99/51(Economic Issue is based on IMF).
- BCEAO., (2019). Rapport Annuel de la Banque Centrale des Etats de l’Afrique de l’Ouest. URL: https://www.bceao.int/fr/publications/rapport-annuel-de-la-bceao-2019
- Beck N, Katz JN (1995). “What To Do (and Not To Do) with Times-Series–Cross-Section Data in Comparative Politics.” American Political Science Review, 89(3), 634–647.
- Berthélemy, J.-C., & Et Aristomène, V. (1996). Economic growth, convergence clubs, and the role of financial development. Oxford Economic Papers, 48(2), 300–328. https://doi.org/10.1093/oxfordjournals.oep.a028570
- Bhattarai, K. (2015). Financial Deepening and Economic Growth in Advanced and Emerging Economies. Review of Development Economics, 19(1), 178–195. https://doi.org/10.1111/rode.12133
- Chhikara, K., & Et Kodan, A. (2011). Financial inclusion, development and its determinants: An evidence of Indian state. Asian Economic Review, 38, 1–2.
- Clarke, D. (2013). Africa 2050: economic revolution. global: The international briefing. Document Non Publié. Consulté à l’adresse http://www.global-briefing.org/Global_Issue_14/index.html#/20/
- Combey, A. (2017). Economic growth and political institutions in the WAEMU: What Do We know ? European Journal of Business and Management, 9(2), 31–35. https://ssrn.com/abstract=2910849
- Dedewanou, F. A. (2016). Analyse Comparative des Déterminants de la Croissance des Pays de l’UEMOA et des Pays à Forte Croissance. OCP Policy Center RP-16/02. https://www.policycenter.ma/sites/default/files/2021-01/OCPPC-RP1602v2.pdf
- Demetriades, P., & Et Law, S. (2004). Finance, Institutions and Economic Growth. Working Paper 04/5 University of Leicester).
- Diamond, D. (1984). Financial intermediation and delegated monitoring. Review of Economic Studies, 51(3), 393–414. https://doi.org/10.2307/2297430
- Dinabandhu, S., & Et Debashis, A. (2018). Financial inclusion and economic growth linkage: Some cross country evidence. Journal of Financial Economic Policy, 10(3), 369–385. https://doi.org/10.1108/JFEP-11-2016-0073
- Dinda S. (2004). Environmental Kuznets Curve Hypothesis: A Survey. Ecological Economics, 49(4), 431–455. https://doi.org/10.1016/j.ecolecon.2004.02.011
- Edison, H. (2003). Qualité des Institutions et Résultats économiques: Un Lien Vraiment Etroit ? Finance et Développement. Consulté à l’adresse https://www.imf.org/external/pubs/ft/fandd/fre/2003/06/pdf/edison.pdf
- Eggoh, J. (2009). Développement Financier et Croissance Economique: Eléments d’Analyse Théorique et Empirique. Université d’Orléans.
- Eggot, J., & Et Villieu, P. (2013). Un Réexamen de la Non-Linéarité entre le Développement Financier et la Croissance Economique. Revue d’économie politique, 02(123), 211–236. ftp://ftp.univ-orleans.fr/theses/comlanvijude.eggoh_1753.pdf
- Félix Zogning , N. (2017). Investissements d’Accord, mais Financement d’Abord. Revue Interventions Economiques. http://journals.openedition.org/interventionseconomiques/5881
- Ghosh, S. (2011). Does financial outreach engender economic growth? Evidence from Indian states. Journal of Indian Business Research, 3(2), 74–99. https://doi.org/10.1108/17554191111132206
- Goldsmith, R. (1969). Financial structure and development. The Economic Journal, 80(318), 365–367.
- Green, W. H. (2003). Economic Analysis (5th edn) ed.). Pearson Education International.
- Kao, C. (1999). Spurious regression and residual-based tests for cointegration in panel data. Journal of Econometrics, 90(1), 1–44. https://doi.org/10.1016/S0304-4076(98)00023-2
- Kaufmann, D., Kraay, A., & Et Zoido-Lobaton, P. (1999). Aggregating governance indicators. Consulté à l’adresse http://www.worldbank.org/wbi/governance
- Kim, D. W., Yu, J. S., & Hassan, M. K. (2017). Financial inclusion and economic growth in OIC countries. Research in International Business and Finance N°, (43). https://doi.org/10.1016/j.ribaf.2017.07.178
- King, R. G., & Et Levine, R. (1993a). Finance and growth: Schumpeter might be right. The Quarterly Journal of Economics, 108(3), 717–738. https://doi.org/10.2307/2118406
- King, R. G., & Et Levine, R. (1993b). Finance, Entrepreneurship and Growth. Journal of Monetary Economics, 32(3), 1–30. https://doi.org/10.1016/0304-3932(93)90028-E
- Koomson, I., Villano, R., & Et Hadley, D. (2020). Effect of financial inclusion on poverty and vulnerability to poverty: evidence using a multidimensional measure of financial inclusion. Social Indicators Research, 149(2), 613–639. https://doi.org/10.1007/s11205-019-02263-0
- Kpodar, K., & Et Andrianaivo, M. (2011). ICT, financial inclusion, and growth evidence from African Countries. IMF Working Paper 11/73.
- Kuipou, C., Nembot, N., & Et Tofah, E. (2015). Développement Financier et Croissance Economique dans les Pays Africains de la Zone Franc: Le Rôle de la Gouvernance. European Scientific Journal, 11(4). https://eujournal.org/index.php/esj/article/view/5146
- Le, T. H., Kim, J., & Et Lee, M. (2016). Institutional quality, trade openness, and financial sector development in Asia: An empirical investigation. Emerging Markets Finance and Trade, 52(5), 1047–1059. https://doi.org/10.1080/1540496X.2015.1103138
- Levine, R. (1997). Financial development and economic growth. Views and Agenda.Journal of Economic Literature, 35, 688–726. https://www.jstor.org/stable/2729790
- Levin& Et Lin. (1992). Unit root test in panel data: Asymptotic and finite sample properties. University of California at San Diego, Discussion Paper 92-93.
- Levin& Et Lin. (1993). Unit root test in panel data: New results. University of California at San Diego Discussion Paper 93-56.
- Lucas, R. (1988). On the mechanics of economic development. Journal of Monetary Economics, 22(1), 3–42. https://doi.org/10.1016/0304-3932(88)90168-7
- McKinnon, R. (1973). Money and capital in economic development. DC: Brookings Institution.
- Minsky, H. (1964). In Commission on money and credit: Private capital market, prentice-hall. https://digitalcommons.bard.edu/hm_archive/232
- Moore, W., & Craigwell, R. (2003). The relationship between commercial banks’ interest rates and loan sizes: Evidence from a small open economy. Applied Financial Economics, 13(4), 257–266. https://doi.org/10.1080/09603100110116434
- Naceur, S., & Et Samir, G. (2007). Stock markets, banks, and economic growth:Empirical evidence from the MENA region. Research in International Business and Finance, 21(2), 297–315. https://doi.org/10.1016/j.ribaf.2006.05.002
- Ndambiri, H., Ritho, C., Ng’ang’a, S., Kubowon, P., Mairura, F., Nyangweso, P., Muiruri, E., & Et Cherotwo, F. (2012). Determinants of economic growth in sub-saharan Africa: A panel data approach. International Journal of Economics and Management Sciences, 2(2), 18–24. https://karuspace.karu.ac.ke/handle/20.500.12092/1861
- Nguling’wa, P. (2019). The impact of financial inclusion on economic growth in sub-Saharan Africa. Journal of Applied Economics and Busines. En ligne), consulté à l’adresse. http://www.aebjournal.org/articles/0704/070404.pdf.
- Pagano, M. (1993). Financial markets and growth: An overview. European Economic Review, 37(2–3), 613–622. https://doi.org/10.1016/0014-2921(93)90051-B
- Pearce, D. (2011). Financial inclusion in the middle east & north Africa: Analysis and roadmap recommendations. Working paper 5610. (in World Bank Policy Res). https://doi.org/10.1596/1813-9450-5610
- Pesaran, H. M. (2003). A simple panel unit root test in the presence of cross section dependence. University of Southern California. Mimeo.
- Rioja, F., & Et Valev, N. (2004). Does one size fit all ? A reexamination of the finance and growth relationship. Journal of Development Economics, 74(2), 429–447. https://doi.org/10.1016/j.jdeveco.2003.06.006
- Romer, P. (1986). Increasing returns and long run growth. Journal of Political Economy, 94(5), 1002–1037. https://doi.org/10.1086/261420
- Sarma, M. (2012). In Money, Finance, Trade and Development. https://finance-and-trade.htw-berlin.de/fileadmin/HTW/Forschung/Money_Finance_Trade_Development/working_paper_series/wp_07_2012_Sarma_Index-of-Financial-Inclusion.pdf
- Sethi, D., & Acharya, D. (2018). Financial inclusion and economic growth linkage: Some cross-country evidence. Journal of Financial Economic Policy, 10(2), 369–385. https://doi.org/10.1108/JFEP-11-2016-0073
- Shaw, E. S.(1973). Financial deepening in economic development. American Journal of Agricultural Economics, 56(3), 670. https://doi.org/10.2307/1238641
- Solow, R. (1956). A contribution to the theory of economic growth. Quarterly Journal of Economics, 70(1), 65–94. https://doi.org/10.2307/1884513
- Stock, J. H., & Et Watson, M. W. (1993). A simple estimator of cointegrating vectors in higher order integrated system. Econometrica, 61(4), 783–820. https://doi.org/10.2307/2951763
- Swan, W. (1956). Economic growth and capital accumulation. Economic Record, 32(2), 330–361. https://doi.org/10.1111/j.1475-4932.1956.tb00434.x
- Wong, Y.H.(2015). IMF-MIT Study Shows How Financial Inclusion Drives Economic Growth: Quantifying Macroeconomic Impacts of Financial Inclusion. MasterCard Center. https://mastercardcenter.org/insights/imf-mit-study-shows-financial-inclusion-drives-economic-growth/
- Yorulmaz, R. (2016). Construction of A financial inclusion index for the member and candidate countries of the European Union.Sayıştay. Dergisi.
- Zivot, E., & Et Andrews, D. W. (1992). Further evidence on the great crash, the oil-price shock, and the unit-root hypothesis. Journal of Business and Economic Statistics, 10, 251–270. https://doi.org/10.2307/1391541