
 ?Mathematical formulae have been encoded as MathML and are displayed in this HTML version using MathJax in order to improve their display. Uncheck the box to turn MathJax off. This feature requires Javascript. Click on a formula to zoom.
Abstract
This paper examines the relationship between trading activity and returns volatility in white maize futures listed on the South African Futures Exchange (SAFEX) and investigates the impact of speculative activity on volatility. Returns volatility is estimated using a GARCH (1,1) model. Trading activity changes are observed by computing two negatively correlated ratios from daily trading volume and open interest. The dynamic relationship between volatility and trading activity is explored over the period April 2000 to May 2022 using a vector autoregressive framework. The paper examines not only the Granger-causality between speculative and hedging ratios and volatility but also assesses their interactions through variance decomposition and impulse response functions. The first ratio, of volume to open interest, is used to capture speculative market activity; and the second, a ratio of the change in open interest to volume, is used to reflect the activity of hedgers. The results shed light on the effectiveness of targeting speculators for regulation in grain futures markets, while also contributing to the veracity of price limits in effectively moderating volatility.
1. Introduction
Maize is among the most significant agricultural commodities grown. Two varieties of maize are produced, with yellow maize predominantly used for livestock feed and biofuels like ethanol; and white maize reserved for human consumption, especially in Africa and Central America (Ranum et al., Citation2014).
In South Africa, maize is not only the largest locally produced field crop but is also the staple food for the majority of the population with white maize consumption exceeding 4 million tons on average annually (Auret & Sayed, Citation2020). South Africa is also the main emerging market for price discovery of maize in Africa, with white maize being the largest and most traded futures contract listed on the South African Futures Exchange (SAEFX). SAFEX is also the only exchange globally where white maize future contracts are traded, as all other maize future contracts relate to the yellow maize variety instead.
The volume of white maize future contracts traded on SAFEX over the last 20 years has surpassed 16 million (Sayed & Auret, Citation2019). According to a report by the United States Department of Agriculture on World Agricultural Supply and Demand Estimates (USDA), South Africa (together, with the US, Argentina, Brazil, Russia, and Ukraine) is one of the leading exporters of maize globally, with exports of 3.8 million metric tons (mmt; USDA WASDE, Citation2022).
Futures markets provide a platform for price discovery and risk management and cater for two opposing types of market participants: hedgers and speculators. Hedgers are identified as the commercial participants in a futures contract and are often the farmers, food producers and end-users, with a sincere interest in trading the underlying asset. Speculators, in contrast, are defined as non-commercial traders who, although provide critical market liquidity, are seen merely as day traders, participating predominantly to make a profit. Given the link between spot and futures markets and the implications that agricultural derivatives have on food security, it is broadly accepted that futures markets should primarily serve and act in the best interests of the commercial end-users, i.e. the hedgers.
The role and impact of speculators has long been contested. One school of thought maintains that speculators are necessary as they provide the liquidity needed to hedge the risks of commercial traders (Berg, Citation2011). The other doctrine paints them as villains, responsible for the unprecedented levels of rising food prices and associating them with market manipulation and futures markets squeezes. The financialization hypothesis accused speculators of artificially driving up commodity prices beyond levels supported by market fundamentals, subsequently increasing price volatility (Haase et al., Citation2016). This financialization and the rapid growth of commodity index fund investments observed between 2004 and 2008 resulted in a significant surge in open interest (Domanski & Heath, Citation2007). These open interest positions were predominantly held by speculators with no commercial interest to produce or consume commodities. Several non-governmental organizations (NGOs) therefore accused speculators of contributing to the 2007–2011 global food crises by gambling on food prices via commodity derivative instruments (Chadwick, Citation2018).
What followed was the implementation of several regulatory tools on futures exchanges, tasked with curbing the influence of speculators in commodity markets and on prices. In the U.S., the Dodd-Frank Wall Street Reform and Consumer Protection Act of 2010 directed the Commodity Futures Trading Commission (CFTC) to impose position limits that would prevent individual traders from holding more than a specified number of futures contracts at a time (Berdell & Choi, Citation2018). This, in turn, would prevent excessive speculation and market manipulation. Furthermore, price limits that would constrain the range of price volatility allowed in a specific futures contract over a single trading day, were also imposed. The CFTC argued that limits on the size of speculative positions in futures markets were necessary because they protect futures markets from excessive speculation that can cause unreasonable or unwarranted price fluctuations (NAMC, Citation2009).
While the impact of the financialization of commodities was not as intricately examined in South Africa as it was in the U.S., South Africa, and its maize market in particular, also observed unprecedented price spikes that raised concerns. Many academics and practitioners argued that concentrated market participants were irresponsibly taking out large speculative positions in order to corner the market and drive futures prices away from fundamentals. In response, South Africa also imposed position and price limits on SAFEX. However, this was initially only done for white maize futures given its importance as a regional supplier of maize and its price discovery mechanism. On the 1st of July 2003, the Johannesburg Stock Exchange (JSE) instituted position limits for speculative positions on SAFEX-traded white maize futures contracts in order to prevent individual market participants from cornering the market (NAMC, Citation2009). And on the 30th of November 2007, the JSE implemented price limitsFootnote1 for white maize futures in order to constrain market manipulation and curb excess-volatility linked to speculation (Sayed & Auret, Citation2018).
Sayed and Auret (Citation2018) investigated the efficacy of price limits in white maize futures contracts by testing four distinct hypotheses over the period March 2010 to December 2017. Testing the volatility spillover hypothesis, the authors found evidence that price limits resulted in heightened volatility on the trading days following limits. For the delayed price discovery hypothesis, the results showed that price limits prevented rational and informed trading which kept futures prices from efficiently reaching their equilibrium. The authors also found support for the liquidity interference hypothesis, as a sharp reduction in trading volume was observed when limits were in effect, followed by an intense reversal once they were lifted. Finally, support for the gravitation or magnetic effect was found. This showed that the anticipation of an impending price limit caused prices to accelerate towards their limit prematurely, proving price limits to be self-fulfilling and disruptive to trading activity. Overall, price limits were found to be ineffective for white maize futures in curbing excess-volatility, and instead amplified volatility and impaired liquidity. In their conclusion, the authors recommended that the South African futures market adopt the weekly Commitment of Traders (COT) reports available in the U.S., as this split in open interest data would allow the necessity of price limits to be empirically investigated, an important pre-requisite to testing its effectiveness.
Much of the uncertainty surrounding the role of speculation and whether it destabilizes futures markets can therefore be resolved by defining excess-speculation. Working (Citation1953) was the first to note that speculation and hedging in commodity markets are intricately intertwined. He argued that speculation is limited to the overall hedging volume. Working (Citation1953, Citation1960) proposed a speculative index to measure excess-speculation. His “T” index is based on the notion that a certain number of speculative positions is needed to balance the hedging positions of commercial traders as their long and short positions might not exactly offset each other.Footnote2 The index has a minimum value of 1.00 when the level of speculation equals hedging need and a value above 1.00 when speculative positions exceed those of commercial traders (hedgers)—an indication of excess-speculation. According to Working (Citation1953) therefore, speculators correct imbalances in futures markets by providing critical market liquidity to complete the contracts of commercial traders. Speculative activity only becomes destructive when there is a surplus of net long positions being held by non-commercial traders. This surplus creates artificial demand in the market and in so doing wrongly pushes up the price of the futures contract, simultaneously increasing the price of the underlying commodity. This was reiterated by Robles et al. (Citation2009), who argued that excess-speculation in commodity futures markets not only increases futures prices, but through arbitrage opportunities, also increases spot prices above levels justified by supply and demand fundamentals.
The necessary data source required to compute Working’s T-Index, and thus excess-speculation, are the COT reports obtainable from the CFTC. These reports are available on a weekly basis and split open interest data into long and short commercial (hedging) positions as well as long short non-commercial (speculative) positions.
To date, the split of open interest data on SAFEX into commercial and non-commercial participants remains unavailable. Given the absence of these data, alternative methods to measure excess-speculation is required. Speculative and hedging ratios that make use of trading activity variables, such as trading volume and open interest, have been put forward to address this gap. According to Bohl et al. (Citation2018) the rationale behind these ratios lie in the assumption that hedgers hold their positions for longer periods, whereas speculators mainly try to avoid holding their positions overnight.
The objective of this paper is to measure speculative and hedging ratios for the South African white maize futures market, given the absence of COT reports, while also analysing its impact on returns volatility. The paper makes use of daily volume, open interest and closing price data for South African white maize futures contracts over the period April 2000 to May 2022. In addition to measuring speculative and hedging activity, this paper also investigates the relationship between speculative ratios and returns volatility using a vector autoregressive (VAR) framework, which explores not only Granger-causality between the variables but also assesses their interactions through variance decomposition and impulse response functions.
While most studies often employ volume and open interest data to proxy for liquidity and market depth respectively, this paper uses volume and open interest to estimate speculative and hedging trading activity. The daily trading volume used in this paper accounts for the portion of trading activity that has taken place in a specific contract over a specific trading day, while the daily open interest determines the number of outstanding contracts at the end of a specific trading day. Drawing from the argument of Working (Citation1960) that only excess-speculation is detrimental to futures price volatility, the speculative ratio in this paper highlights the dominance of speculative activity beyond that required to fully offset hedging demand (i.e. relative to open interest).
The paper’s contribution highlights the need for commitment of trader reports in emerging futures exchanges. Access to this data is vital to empirically assess the efficiency of futures markets in the presence of new policies and regulations.
A significant relationship between speculative activity and returns volatility in the South African white maize futures market would justify the imposition of circuit breakers in agricultural futures markets. However, if excess-speculation is found to have an immaterial role in the influence of returns volatility in South African white maize futures, this questions the use of price and position limits and whether they hinder the efficient functioning of the very markets they are entrusted to serve.
The paper is organised as follows: Section 2 presents a brief literature review on the development of speculative ratios, Section 3 and 4 detail the data and methodology used, Section 5 analyses the results, Section 6 discusses the results, with Section 7 concluding.
2. Literature review
The rationale behind using trading activity variables to estimate and separate hedging and speculation stems from the ability to distinguish between traders based on their intention to trade as well as their holding period. Carret (Citation1930) suggests that motive is the best way to distinguish investment from speculation. He linked the investor to the economics of the business, and the speculator to the price, defining their motives as the purchase or sale of commodities in expectation of profit. Market participants that trade with the intention of making a profit with no commercial interest in the underlying commodity are therefore seen as the speculators; while hedgers are believed to trade with the intention of managing their risk as they have a sincere commercial interest in the underlying commodity. With regard to using contract holding periods to distinguish between trader types, hedgers are believed to hold their contract positions for more than one day while speculators are believed to be day traders. This theory is supported by Cornell (Citation1981) and Garcia et al. (Citation1986), who observed data for major agricultural commodities traded on the Chicago Board of Trade (CBOT) and found daily volume to range between 20% and 30% of open interest, while the daily change in open interest was often not more than 1 to 2% of total open interest. This observation illustrates that while contracts have a high daily turnover, the number of contracts in existence remains relatively the same. Speculators being defined as short-term or day traders are further supported by Borgards and Czudaj (Citation2022).
Investigating the dynamics between price returns volatility, volume and open interest in futures markets sheds light on the price effects of speculation and hence on market regulation. Trading volume has often been used as a proxy for speculative activity (Rutledge, Citation1979) and speculators /day-traders (Kumar & Pandey, Citation2010); while open interest is an important indicator of futures trading activity and has been used as a proxy for hedger’s opinions (Kamara, Citation1993), hedging demand (Chen et al., Citation1995), market depth (Bessembinder & Seguin, Citation1993) and hedgers (Kumar & Pandey, Citation2010).
Rutledge (Citation1979) was one of the first to proxy for speculation using trading volume. He argued that changes in daily trading volume are largely a measure of variations in speculation, as hedgers’ positions only make up a small proportion of daily trading volume. In his study on the relationship between volume and price variability, Rutledge examined 136 different futures contracts for 13 commodities during the mid-1970s using causality tests developed by Sims (Citation1972). He also argued that evidence of causality running from trading volume to price variability (volatility) would strongly support the need for tighter controls and regulation on speculative trading. Rutledge found that trading volume represented primarily a response to, rather than a cause of, movements in price variability.
Similar to Rutledge (Citation1979), Garcia et al. (Citation1986) examined the lead-lag relationships between trading volume and price variability (volatility) for selected futures contracts of corn, wheat, soybeans, soybean oil and soybean meal. Contrary to Rutledge, however, was the authors’ use of alternative measures of price variability (volatility) and volume. While Rutledge (Citation1979) measured volatility as the absolute value of the percentage change in daily closing prices, and volume as the number of trades in a day; Garcia et al. (Citation1986) proposed four different measures for volatility and two for volume. Measures of price variability included the change in daily closing prices, the percentage change in daily closing prices, the daily price change—taken as high minus low as well as an adjusted price range. For volume, the number of trades in day was used as well as a ratio examining daily volume relative to the level of open interest. According to Garcia et al. (Citation1986) the total volume of contracts traded daily relative to the size of open positions at the end of the day reflected the relative importance of speculative behaviour. Their results found neither a discernible pattern between trading volume and price variability, nor between lead-lags and price trends.
Ap Gwilym et al. (Citation2002) modified the speculative ratio of Garcia et al. (Citation1986) by examining daily volume relative to the absolute change in open interest. The authors argue that the daily change in open interest more accurately reflect the activity of hedgers than simply the level of open interest. This adjusted open interest is further supported by Lucia and Pardo (Citation2010) who outline the drawbacks of the speculative ratio of Garcia et al. (Citation1986). According to Lucia and Pardo (Citation2010), trading volume is a flow variable measured over a specific period, for instance, a trading day, whereas open interest is a stock variable measured at the end of a trading day. The ratio therefore relates a flow variable that refers to a specific trading day to a stock variable measured at the end of that same trading day, making it inadequate for following the speculative activity of traders over time. Lucia and Pardo (Citation2010) acknowledged that the ratio by Ap Gwilym et al. (Citation2002) was able to discriminate between day trades (short-term speculation) reflected in daily trading volume. However, they also criticized the ratio’s lack of ability to distinguish between those days when the newly taken positions that are held overnight outnumber the liquidation of old positions. To this end, Lucia and Pardo (Citation2010) defined an additional speculative ratio as the change in open interest to volume. A positive number here indicate that the number of opened positions is greater than the number of liquidated positions with a negative number indicating the opposite.
The two ratios predominantly employed in the literature to measure speculative and hedging activity remain the two developed by Garcia et al. (Citation1986) and Lucia and Pardo (Citation2010) respectively. For instance, Lucia et al. (Citation2015) made use of these two ratios when they examined December futures contracts from the European Climate Exchange (ECX) of the Intercontinental Exchange Group (ICE) with deliveries between 2005 and 2020. Using the two measures combining volume and open interest data, they explored the relative importance of speculative versus hedging activities in the European carbon market and found high degrees of speculative behavior. In addition, Bohl et al. (Citation2018) analysed the impact of speculative activity, proxied by these same two speculation and hedging ratios, in order to investigate whether speculative activity in Chinese futures markets for agricultural commodities destabilized futures returns over the period 2003 to 2017. Their results showed that the amount of speculative activity in relation to hedging activity contained information about changes in futures volatility. Specifically, they found short-term speculation to have a statistically significant and positive impact on returns volatility. Their results using the hedging ratio were inconclusive, however, and did not confirm in the majority of cases the findings of the speculative ratio.
While most studies to date have used these speculative and hedging ratios in the equity, energy and currency futures markets (predominantly in the United States), this paper employs these measures in an emerging agricultural futures market, specifically, for South African white maize futures.
To the best of the authors’ knowledge, no paper to date has investigated speculation in South African white maize futures, despite it being the most liquid contract traded on SAFEX, and despite SAFEX employing price and position limits in grain futures contracts to curb excess-speculation. This paper therefore contributes to the literature by estimating speculative and hedging ratios for South African white maize futures, as well as by assessing their impact on returns volatility.
3. Data
The objective of this paper is to empirically investigate the impact of speculative activity, as proxied by trading activity variables, on returns volatility in South African white maize futures contracts listed on SAFEX.
Data was obtained from Bloomberg and daily closing prices for the active contract, quoted in Rands/ton, were used to estimate returns and volatility. Daily trading volume and open interest for South African white maize futures contracts were used to estimate the speculative and hedging ratios. As outlined by Bohl et al. (Citation2018), to investigate the effects of speculative activity on volatility, empirical analyses should be conducted on data with at least a daily frequency. The sample period ran from 18 April 2000 to 18 May 2022 with a total of 5 550 observations.
3.1. Defining speculative and hedging ratios
The speculative ratio uses trading volume and open interest data as defined by Garcia et al. (Citation1986) measuring the relative dominance of speculative activity in a contract analysed in comparison to the hedging activity. This ratio, if multiplied by 100 is interpreted as a percentage per trading day and is undetermined when volume and open interest are equal to zero. This volume to open interest ratio can take any positive real number, including zero and is defined as:
The hedge ratio based on the different trading behaviour of speculators and hedgers is defined by Lucia and Pardo (Citation2010). This ratio differs from the one above as it is a hedging ratio, which gauges the relative dominance of hedging activity relative to speculative activity. This ratio is dimensionless with a positive number indicating that the number of open positions is greater than the number of liquidated positions, a negative number indicating that the number of liquidated positions are greater than the number of open positions and a number of zero indicating that the total number of open and closed positions are equal. Palao and Pardo (Citation2012) further elaborate that a hedge ratio with a value close to either one or minus one indicates low speculative activity, while a value close to zero indicates relatively high speculative activity. The ratio is calculated as the daily change in open interest to daily trading volume and is defined as:
In each of the ratios defined above, TVt represents the trading volume for day t which captures all trades for a particular day executed during a specified day; and OIt represents open interest for day t which describes all positions of that contract neither equalised by an opposite futures positions not fulfilled by the physical delivery of the commodity or by cash settlement.
3.2. Estimating volatility
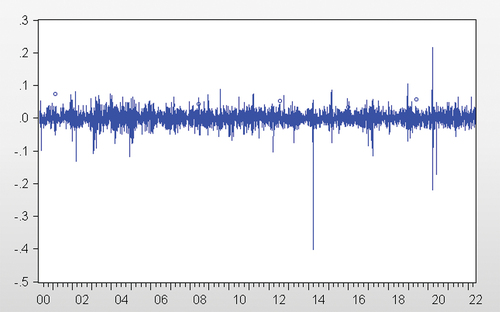
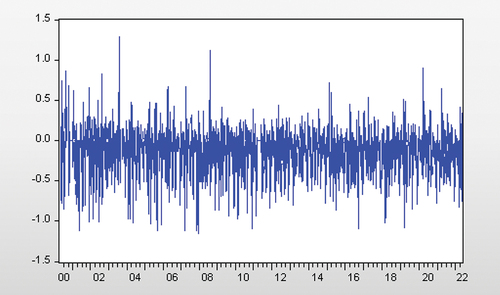
Given the volatility clustering observed in Figure , which plots the daily returns from South African white maize futures closing prices; as well as the mean and median returns of 0 observed in Table , this paper employs the GARCH model of Bollerslev (1986). Excess kurtosis is also observed in the returns as can be seen from Table , indicating that returns for South African white maize futures may be prone to extreme values on either side as its distribution is leptokurtic. To this end, a student’s t-distribution was used when estimating the model. Similar to Auret and Sayed (Citation2020), the volatility of South African white maize futures is modelled as:
Figure 1. Daily returns of South African white maize futures.
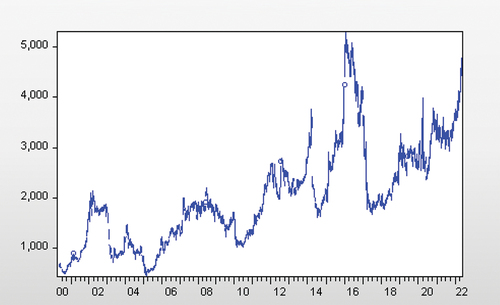
Table 1. Descriptive Statistics
where σt is the time-varying volatility and ϵt is an i.i.d. random error that is independent of σt. A GARCH (1,1) model with the following conventional parameter restrictions are fitted to model σt. where:
and volatility in South African white maize futures contracts is measured using the fitted time-series of the standard deviation from this model and is plotted in Figure .
Figure 2. Volatility in the South African white maize futures market.
3.3. Preliminary data analysis
Table displays descriptive statistics for the closing prices, returns, volatility estimated in EquationEquation 3(3)
(3) , trading volume, open interest, the speculative ratio, estimated in EquationEquation 1
(1)
(1) and, the hedging ratio, estimated in EquationEquation 2
(2)
(2) . The mean and median values for open interest are both higher than for trading volume at 8 051 and 6 153, respectively, versus 1 402 and 1 0 67. The mean closing price for South African white maize futures is shown as R2 020/ton with the maximum reaching R5 296/ton. Figure plots the daily closing prices of South African white maize futures over the full sample period and shows that the maximum high values occurred over the 2014–2016 period. According to Walt (Citation2016) the South African agricultural sector was burdened with the worst drought recorded in 104 years between 2014 and 2016. Furthermore, Sayed and Auret (Citation2018) found that this period was also characterised by a high frequency of price limit hits in South African white maize futures contracts.
Figure 3. South African white maize futures daily closing prices.
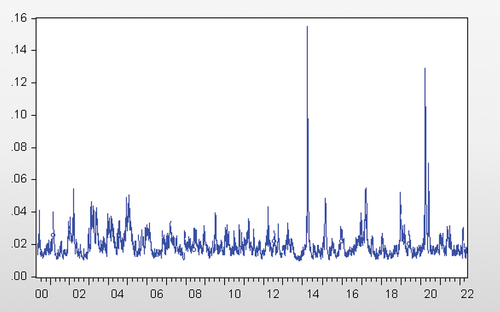
Table also shows that the mean, median, and standard deviation of returns is zero. The daily mean and median of volatility is 2%, reaching a maximum of 16% in March 2014, when the effects of the drought at the time became apparent and increased volatility.
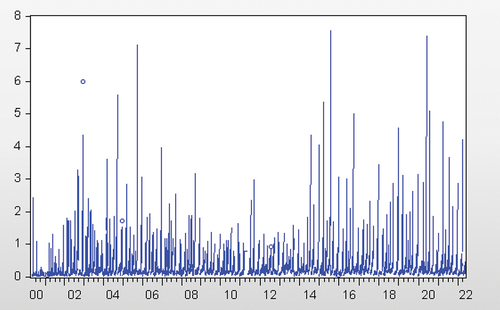
The speculative ratio is computed from EquationEquation 1(1)
(1) and measures the relative dominance of speculative activity relative to hedging activity, i.e., the excess-speculation in the South African white maize futures market. This ratio if multiplied by 100 can be interpreted as a percentage per trading day. Table shows the mean and median of this ratio as 0.322 and 0.168, respectively. This illustrates that there is a positive presence of excess-speculation in the South African white maize futures market with a daily average of 32.2% of speculative activity relative to hedging activity. This can also be seen visually in Figure , which plots the speculative ratio.
Figure 4. Speculative ratio.
The hedge ratio, although dimensionless, indicates low speculative activity for values close to either one or minus one and high speculative activity for values close to zero. Table shows the mean hedge ratio as −0.124, with a median of −.08, implying high speculative activity as well. This ratio is plotted in Figure .
Figure 5. Hedge ratio.
The preliminary analysis of the speculative and hedge ratios confirms a high speculative activity over the sample period and assert that excess-speculation is present in the South African white maize future market. Whether or not this excess-speculation can significantly explain or affect returns volatility can only be confirmed through the vector autoregressive (VAR) methodology presented next.
4. Methodology
Assessing lead-lag relationships between speculative activity and returns volatility helps clarify whether excess-speculation is driving volatility, or if instead amplified volatility is attracting and increasing speculative trading activity in the South African white maize futures market. Similar to Bohl et al. (Citation2018), the dynamic relationship between returns volatility and trading activity is investigated using the following vector autoregressive framework (VAR) framework:
where is the estimate of volatility described in EquationEquation 4
(4)
(4) above, RatiotSpec is the speculative ratio from EquationEquation 1
(1)
(1) and, RatiotHedge is the hedge ratio from EquationEquation 2
(2)
(2) . The residuals of the regression, which are assumed to be mutually independent and individually i.i.d. with zero mean and constant variance, are represented by
and
. The VAR framework is often used for forecasting systems of interrelated time-series as well as to assess the dynamic impact of random disturbances on the system of variables. Each of these variables are dependent on their own lagged values as well as on the lagged values of the corresponding variable.
This study examines lead-lag relationships through Granger (Citation1969) causality tests, and through forecast error variance decompositions. According to Sims (Citation1972, Citation1980), the statistical significance of economic variables as determined through Granger causality tests is not exhaustive, and should therefore be complemented with an impulse response analysis and forecast error variance decomposition. Sims (Citation1980) argues that this produces additional insights beyond the Granger-causality tests, such as, the direction of the causal relationship as well as the strength of the causal relationship. Impulse response functions and variance decompositions are therefore also estimated and analysed.
Pesaran and Shin (Citation1998) propose a generalized impulse response analysis and generalized forecast error variance decomposition (GFEVD) technique for unrestricted and cointegrated VAR models. Their revised technique does not require orthogonalization of shocks and is invariant to the ordering of the variables in the VAR making it superior in exploring the interrelationships between economic variables like the ones defined in EquationEquation 1(1)
(1) , (EquationEquation 2
(2)
(2) ) and (EquationEquation 4
(4)
(4) ).
Similar to Yang et al. (Citation2005), Let Zt represent a vector including several economic variables. The vector Zt can then be modelled as an infinite moving average process, such that:
The GFEVD for the vector can then be defined as:
and reveals to what degree variation in a certain variable can be explained by shocks or innovations from other variables in the same system, thereby quantifying the relative importance one variable has in influencing another variable. In this paper, the relative importance of speculative activity on returns volatility will be assessed.
4.1. VAR estimation
The first step in specifying a VAR model is to choose the appropriate lag length. This paper evaluates five different criteria in this regard, namely, Likelihood Ratio (LR), Final Prediction Error (FPE), Akaike Information Criteria (AIC), Schwarz Information Criteria (SIC) and Hannan-Quinn Information Criteria (HQ) to determine the optimum lag lengths for the VAR model. The optimum lag length was determined by minimising the Schwarz Information Criteria (SIC). As daily data is used, the maximum lag length was set at 20 to represent a maximum of four trading weeks. The results for the optimal lag lengths of the VAR models for at least 10 lags are shown in Table . For both VAR frameworks, estimated in EquationEquation 5(5)
(5) , i.e. volatility and the speculative ratio, and volatility and the hedge ratio, the optimum lag length was 3. To cater for the presence of residual serial correlation, Lagrange Multiplier (LM) tests are also conducted for a maximum of 3 lags. These results are displayed in Table . The VAR model for volatility and the speculative ratio shows no presence of serial correlation, while the VAR model for volatility and the hedge ratio shows no serial correlation at 3 lags.
Table 2. VAR estimation
Table 3. LM residual serial correlation tests
4.2. Unit root tests
Granger-causality tests require that the variables used are stationary. As a pre-requisite therefore, unit-root tests are carried out in order to determine the order of integration. The augmented Dickey and Fuller (Citation1979) tests are conducted on the levels of the data in order to test the null hypothesis that a time-series, yt has a unit root (is integrated of order 1) against the alternative hypothesis that it is I(0) or stationary. These results are displayed in Table , and confirm that each series concerned (volatility, the speculative ratio and the hedge ratio) are stationary at the 1% level of significance.
Table 4. Unit Root Tests
4.3. Granger–causality tests
Granger-causality tests are used to test the lead-lag relationships between returns volatility and the speculative and hedge ratios. Granger (Citation1969) proposed a time-series-based approach where x is a cause of y a cause of y if adding lagged valued of x improves the explanation of y. According to Gelper and Croux (Citation2007) a time-series is said to Granger-cause another series if it has incremental predictive power when forecasting it. This test will therefore determine if speculative activity (in excess of hedging demand) causes returns volatility in a forecasting sense. Granger-causality estimates a standard F-test and the null hypothesis is that the speculative ratio does not Granger-cause returns volatility, and vice versa. The hypothesis is rejected if coefficients of the lagged values are jointly significantly different from zero. The Granger-causality tests are complemented by the Block Exogeneity Wald Tests where the dependent variable is returns volatility and the two independent variables are the speculative and hedge ratios, respectively. Once again, the null hypothesis here tests that the speculative or hedge ratio does not Granger-cause returns volatility.
4.4. Variance decomposition
The variance decomposition is the next test that assists in interpreting the VAR model and is a widely used method for examining the relative effects of variables (Kim & Patel, Citation2017). Lütkepohl (Citation2010) defines variance decomposition as a classical statistical method in multivariate analysis that uncovers relationships among a large set of variables. He further asserts that forecast error variance decomposition is effective for interpreting the relationships between variables described in VAR models. Variance decomposition measures the percentage of the forecast error of one endogenous variable that is explained by other variables, and is used to assess the relative importance of the speculative ratio and hedge ratio on returns volatility.
4.5. Impulse response functions
Finally, impulse response functions are examined to test whether the causal relationships are positive or negative and to examine the interactions between the variables in the VAR system. This test simulates the impact of a shock to one variable in the system on the conditional forecast of another variable (Kumar & Pandey, Citation2010). Sims (Citation1972, Citation1980) encourages the use of variance decomposition and impulse response functions to complement the Granger-causality test, as he argues that it may be misleading to depend solely on the statistical significance of economic variables determined by Granger-causality. According to Pesaran and Shin (Citation1998), an impulse response function measures the time profile effect of shocks at a given point in time on the (expected) futures values of variables in the system. They describe an impulse response as the outcome of a conceptual experiment in which the time profile of the effect of a hypothetical shock is compared with a base-line profile. Impulse response functions are therefore used to analyse the impact of a change in one variable (returns volatility/speculative or hedge ratio) on another variable (speculative or hedge ratio/returns volatility).
5. Analysis of results
5.1. Granger–causality test results
Table presents the results of the Granger-causality tests. Significant unidirectional causality, at the 1% level, is found from the speculative ratio to returns volatility. Therefore, one can argue that the excess-speculation from trading activity does indeed affect volatility in the South African white maize futures market. Bidirectional, or feedback causality, is found between the hedge ratio and volatility, with the hedge ratio Granger-causing returns volatility only at the 10% level of significance; and returns volatility Granger-causing the hedge ratio at the 1% level of significance. One can deduct from Table therefore that speculative trading activity has more of an influence on returns volatility than hedging activity. As a complement to this test, the Block Exogeneity Wald test was also carried out with volatility as the dependent variable and the speculative and hedge ratios as the independent variables. The results, shown in Table , are significant at the 1% level, and reinforce that speculative activity leads returns volatility, while the hedge ratio is not found to lead or influence returns volatility.
Table 5. Granger-causality tests
Table 6. VAR Granger Causality/ Block Exogeneity Wald Tests
5.2. Variance decomposition results
The variance decomposition results in Table reiterate the independence of the speculative ratio relative to volatility that was observed with Granger-causality. Specifically, it shows that variations in the speculative ratio are produced almost entirely by its own lagged values, with volatility having at most a 0.07% role. Volatility on the other hand, has almost 3% of its forecast error variance explained by an exogenous shock in the speculative ratio. The variance of the hedge ratio is also almost entirely independent of volatility as can be seen in Table . At most, volatility explains 0.77% of its variance. The hedge ratio on the other hand, explains up to 0.34% of volatility’s variance, which once again reiterates the results of the Granger–causality test, that the hedge ratio does indeed impact volatility.
Table 7. Variance Decomposition
5.3. Impulse response function results
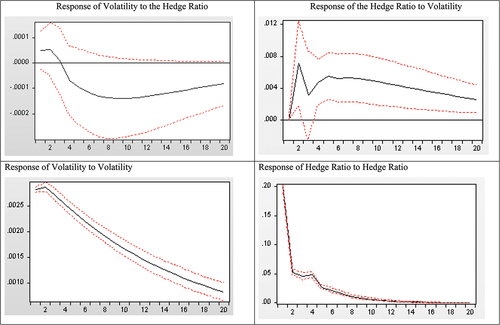
To confirm whether the causal relationships from the Granger-causality tests are positive or negative, the impulse response functions are examined next. These can be seen in Figures . Shocks are defined as one standard deviation and are regarded over a period of 20 trading days. From the top left graph of Figure , it is clear that a simulated shock in the speculative ratio has a positive and significant impact on volatility that persists for the full trading month. It should be noted, however, that this impact, although positive, is quite small. A shock in volatility, however, does not have a significant impact on the speculative ratio, once again, reinforcing the results from the Granger–causality test. The response of volatility and the speculative ratio to innovations on itself are also positive and significant and in the case of volatility, persists for the full trading month. Finally, Figure illustrates the impulse response functions of the VAR framework for the hedge ratio and volatility. The response of volatility to a shock in the hedge ratio is negligibly different from zero and not significant; while the response of the hedge ratio to an innovation in volatility is slightly positive and only significant for the first 2 days. Similarly, to the VAR framework for the speculative ratio and volatility, own innovations in volatility and the hedge ratio yield larger and more significant responses. It is clear, therefore, that most of the volatility observed in South African white maize futures is explained by its own lagged values, and that speculative activity in this market has a negligible, although positive and significant, impact.
Figure 6. Impulse Response Functions (Speculative Ratio and Volatility).
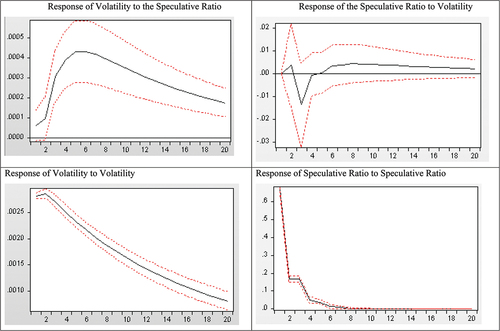
Figure 7. Impulse Response Functions (Hedge Ratio and Volatility).
6. Discussion of results
Prior to the VAR analysis employed in this paper, speculative and hedging ratios were computed to assess the overall level of speculative activity present in the South African white maize futures market. The mean of the speculative ratio reported in Table was 0.322, representing a daily average of 32.2% of excess-speculation present in the South African white maize futures market. By comparison, Bohl et al. (Citation2018) reported a mean of 0.48 on their speculative ratio for corn futures traded on the Dalian Commodity Exchange (DCE). Therefore, while still considerably high, the average daily level of excess-speculation in maize futures listed on SAFEX is smaller when compared with the level observed corn futures listed on DCE. Bohl et al. (Citation2018) assert that Chinese agriculture futures markets are among the most fast paced and rapidly developing markets in the world, with trading behaviour discerned as highly speculative. The findings from this paper therefore add to the argument that emerging agricultural futures markets exhibit high levels of speculative trading activity.
Earlier studies that proxy for speculation and hedging in futures markets, used trading volume and open interest alone, respectively (Rutledge (Citation1979), Chen et al. (Citation1995), and Kumar and Pandey (Citation2010)). The speculative ratio in this study, however, measures the residual speculation in excess of that necessary to meet hedging demand. This paper therefore does not test if all speculation is detrimental, but instead if excessive speculation influences returns volatility. This distinction is important to reiterate when comparing the results of this paper to the results of similar studies. The Granger-causality and impulse response function results confirm unidirectional causality from the speculative ratio to returns volatility in SAFEX-traded white maize futures. This result is reinforced by the Block Exogeneity Wald test. These results contribute to the arguments of Working (Citation1953) and Robles et al. (Citation2009), who assert that only speculation in excess of hedging demand contributes to heightened volatility. Speculators therefore remain an intrinsic part of futures markets necessary to maintain liquidity and efficiency.
In addition to contributing to the risk management function of futures markets, these results also contribute to their price discovery function. In reviewing the examination of futures and spot prices, Tonin et al. (Citation2020) outline the dispute that futures prices destabilize spot markets through speculation. According to the variance decomposition results in Section 5.2, volatility has less than 3% of its forecast error variance explained by a shock in the speculative ratio. This finding then contests the notion that the impact of speculation on volatility in white maize futures is considerable enough to destabilize spot maize prices and impair price discovery in this market.Footnote3 Hence, while the role of speculation has been analysed as a trigger for futures price returns volatility (Penone et al., Citation2022), significant evidence to corroborate speculation as a strong determinant of volatility has not been found.
The results from the variance decomposition show that most of the forecast error variance for volatility in maize futures stems from its own lagged values. Forthcoming research, therefore, will benefit from decomposing this volatility and analysing its determinants. One such contribution that can be extended is Sayed and Auret (Citation2019). In their examination of the South African white maize futures market, Sayed and Auret (Citation2019) employed the Dynamic Conditional Correlation (DCC) GARCH Model of Engle (Citation2002) to investigate volatility spillover effects between grain futures, currency futures and equity futures listed on SAFEX. White maize futures were found to have a persistently strong interdependence with yellow maize, wheat, sunflower seeds, and the Rand/US Dollar exchange rate.
Other factors that have been found to affect volatility in agricultural futures include weather and macroeconomic fundamentals. More recently, Mitsas et al. (Citation2022) investigated the impact of real-time global geopolitical risks, geopolitical acts, and geopolitical threats on commodity futures. They found geopolitical threats to have a weak but positive effect on the volatility of corn futures listed on the Chicago Mercantile Exchange (CME).
7. Conclusion
The objective of this paper was to estimate proxies for speculative and hedging activity in the South African white maize futures market in the absence of COT reports, using ratios estimated from daily trading activity data. The first ratio, of volume to open interest, was used to capture speculative market activity; and the second, the change in open interest to volume, was used to reflect the activity of hedgers. The relative dominance of speculative activity over hedging activity was then examined against returns volatility under a VAR framework testing Granger-causality, variance decomposition and impulse response functions. The results confirm a substantial presence of speculative activity relative to hedging activity in the South African white maize futures market for the period April 2000 to May 2022.
The results for the VAR model verify that a positive and significant relationship exists between excess-speculation and volatility. The results also reveal, however, that the short-run dynamics displayed between speculative activity and returns volatility are negligible in size. It is doubtful therefore that speculative activity substantially influences returns volatility to the extent that strict position and price limits should remain in place. These findings add to the debate surrounding the use of price and position limits on the South African white maize futures market. The implications of the results are that returns volatility is not being driven predominantly by excess-speculation, but still through changes in fundamentals, and that by imposing limits on futures exchanges, bona-fide hedging demand is being interrupted and impaired. Restrictive regulation of this nature runs the risk of affecting the liquidity and efficiency on futures exchanges that stakeholders such as farmers and food producers require in order to manage their risk.
The risk of regulatory tools impeding the efficient functioning of futures market is a debate that is common across global exchanges. On 30 January 2020, the Commodity Futures Trading Commission (CFTC) approved a “bona fide hedge” exemption to the rule on speculative position limits in futures and derivatives markets (Fatka, Citation2020). Going forward, position limits would be capped for traders with real hedging needs in futures markets for commodities such as wheat, corn, soybeans, cotton, and cattle, but not for speculators. This ruling recognises that the main beneficiaries of efficiently functioning futures markets are the hedgers and that their use of futures markets prevents the cost of risk-taking from filtering down to the price consumers pay for food.
The most apparent limitation of this paper is that speculation ratio, as defined by Garcia et al. (Citation1986), is dependent on the assumption that hedgers and speculators have different holding period lengths and can be distinguished on this basis. However, studies by Wiley and Daigler (Citation1998) and Ederington and Lee (Citation2002) have found that hedgers tend to hold their futures market positions longer than speculators. These studies, however, are based on evidence found in the financial and energy futures markets, and not in agricultural futures. This limitation further reiterates the need for futures exchanges, like SAFEX, to make accessible commitment of traders reports similar to the CFTC so that the open interest split between commercial (hedgers) and non-commercial (speculators) can be more accurately observed and examined.
The USDA WASDE (Citation2022) forecasts world corn production to decline following the reductions observed in Ukraine, the United States and China. They argue, however, that these reductions will be partially offset by increases in Brazil, Argentina, and South Africa. South Africa as a next exporter of maize, therefore, will continue to play an integral part in the global grains market, especially as price volatility is expected to increase. The informational efficiency of South African maize futures contracts therefore remains of critical importance and future studies will benefit from continuing to examine volatility, and its determinants, in this market.
Disclosure statement
No potential conflict of interest was reported by the author(s).
Additional information
Funding
Notes
1. Price limits are a regulatory tool intended to control volatility in a financial market. For a detailed discussion surrounding price limits in futures markets see, Sayed and Auret (Citation2018).
2. T =
,where HS (HL) are hedgers (commercial) short (long) positions and SS (SL) are speculators’ (non-commercial) short (long) positions.
3. For a detailed account on price discovery in the South African white maize futures market, see, Strydom and McCullough (Citation2013) and Muroyiwa and Mushunje (Citation2018).
References
- Ap Gwilym, O., Buckle, M., & Evans, P. (2002). The volume-maturity relationship for stock index, interest rate and bond futures contracts, EBMS Working Paper EBMS/2002/3. European Business Management School, University of Wales, Swansea.
- Auret, C., & Sayed, A. (2020). The effects of uncertainty on investor expectations and volatility in the South African white maize futures market. Investment Analysts Journal, 49(3), 165–21. https://doi.org/10.1080/10293523.2020.1776503
- Berdell, J., & Choi, J. W. (2018). Clashing analyses of speculation and the early regulation of US futures markets. Journal of the History of Economic Thought, 40(4), 539–560. https://doi.org/10.1017/S1053837218000573
- Berg, A. (2011). The rise of commodity speculation: From villainous to venerable. In Prakash (Ed.), Safeguarding food security in volatile global markets, food and agriculture organization of the united nations. FAO Commodity Market Review.
- Bessembinder, H., & Seguin, P. J. (1993). Price volatility, gannon, trading volume and market depth: Evidence from futures markets. Journal of Financial and Quantitative Analysis, 28(1), 21–39. https://doi.org/10.2307/2331149
- Bohl, M. T., Siklos, P. L., & Wellenreuther, C. (2018). Speculative activity and returns volatility of Chinese agricultural commodity futures. Journal of Asian Economics, 54(2018), 69–91. https://doi.org/10.1016/j.asieco.2017.12.003
- Borgards, O., & Czudaj, R. L. (2022). Long-short speculator sentiment in agricultural commodity markets. International Journal of Finance & Economics. https://doi.org/10.1002/ijfe.2605
- Carret, P. L. (1930). The art of speculation. Pickle Partners Publishing.
- Chadwick, A. E. (2018). Gambling on hunger? The right to adequate food and commodity derivatives trading. Human Rights Law Review, 2018(18), 233–265. https://doi.org/10.1093/hrlr/ngy008
- Chen, N., Cuny, C. J., & Haugen, R. A. (1995). Stock volatility and the levels of the basis and open interest in futures contracts. Journal of Finance, 50(1), 281–300. https://doi.org/10.1111/j.1540-6261.1995.tb05174.x
- Cornell, B. (1981). The relationship between volume and price variability in futures markets. The Journal of Futures Markets, 1(3), 303–316. https://doi.org/10.1002/fut.3990010303
- Dickey, D. A., & Fuller, W. A. (1979). Likelihood ratio statistics for autoregressive time series with a unit root. Econometrica, 49(4), 1057–1072. https://doi.org/10.2307/1912517
- Domanski, D., & Heath, A. (2007) Financial investors and commodity markets. Bank for International Settlements Quarterly Review. March 2007. https://ssrn.com/abstract=1600058.
- Ederington, L., & Lee, J. H. (2002). Who trades futures and how: Evidence from the heating oil futures market. The Journal of Business, 75(2), 353–373.
- Engle, R. (2002). Dynamic conditional correlation – A simple class of multivariate GARCH models. Journal of Business and Economic Statistics, 20(3), 339–350. https://doi.org/10.1198/073500102288618487
- Fatka, J. (2020). CFTC advances position limits rule. https://www.feedstuffs.com/news/cftc-advances-position-limits-rule Accessed January 30, 2020
- Garcia, P., Leuthold, R. M., & Zapata, H. (1986). Lead-lag relationships between trading volume and price variability: New evidence. The Journal of Futures Markets, 6(1), 6–10. https://doi.org/10.1002/fut.3990060102
- Gelper, S., & Croux, C. (2007). Multivariate out-of-sample tests for granger-causality. Computational Statistics & Data Analysis, 51(7), 3319–3329. https://doi.org/10.1016/j.csda.2006.09.021
- Granger, C. J. (1969). Investigating causal relationships by econometrics models and cross special methods. Econometrica, 37(3), 425–435. https://doi.org/10.2307/1912791
- Haase, M., Zimmerman, Y. S., & Zimmerman, H. (2016). The impact of speculation on commodity futures markets – A review of the findings of 100 empirical studies. Journal of Commodity Markets, 3(2016), 1–15. https://doi.org/10.1016/j.jcomm.2016.07.006
- Kamara, A. (1993). Production flexibility, stochastic separation, hedging and futures prices. Review of Financial Studies, 4(4), 935–957. https://doi.org/10.1093/rfs/6.4.935
- Kim, K. Y., & Patel, P. C. (2017). Employee ownership and firm performance: A variance decomposition analysis of European firms. Journal of Business Research, 70, 248–254. https://doi.org/10.1016/j.jbusres.2016.08.014
- Kumar, B., & Pandey, A. (2010). Price volatility, trading volume and open interest: evidence from indian commodity futures markets. http://ssrn.com/abstract=1658844
- Lucia, J., Mansanet-Bataller, M., & Pardo, A. (2015). Speculative and hedging activities in the European carbon market. Energy Policy, 82(2015), 342–351. https://doi.org/10.1016/j.enpol.2014.11.014
- Lucia, J., & Pardo, A. (2010). On measuring speculative and hedging activities in futures markets from volume and open interest data. Applied Economics, 42(12), 1549–1557. https://doi.org/10.1080/00036840701721489
- Lütkepohl, H. (2010). Variance decomposition. In Macroeconometrics and time series analysis (pp. 369–371). Palgrave Macmillan.
- Mitsas, S., Golitsis, P., & Khudoykulov, K. (2022). Investigating the impact of geopolitical risks on the commodity futures. Cogent Economics & Finance, 10(1), 2049477. https://doi.org/10.1080/23322039.2022.2049477
- Muroyiwa, B., & Mushunje, A. (2018). Price discovery in the South African white maize and wheat futures market: A VECM causality approach. International Journal of Economics, Business and Management Research, 2(2), 604–619. https://www.researchgate.net/publication/328538304_PRICE_DISCOVERY_IN_THE_SOUTH_AFRICAN_WHITE_MAIZE_AND_WHEAT_FUTURES_MARKET_A_VECM_CAUSALITY_APPROACH
- NAMC. (2009). The functioning of the agricultural futures market for grains and oilseeds in the light of concerns expressed by GRAINSA. A report prepared by the national agricultural marketing council.
- Palao, F., & Pardo, A. (2012). Assessing price clustering in European carbon markets. Applied Energy, 92, 51–56. https://doi.org/10.1016/j.apenergy.2011.10.022
- Penone, C., Giampietri, E., & Trestini, S. (2022). Futures–spot price transmission in EU corn markets. Agribusiness, 38(3), 679–709. https://doi.org/10.1002/agr.21735
- Pesaran, H. H., & Shin, Y. (1998). Generalized impulse response analysis in linear multivariate models. Economics Letters, 58(1), 17–29. https://doi.org/10.1016/S0165-1765(97)00214-0
- Ranum, P., Peña‐Rosas, J. P., & Garcia‐Casal, M. N. (2014). Global maize production, utilization, and consumption. Annals of the New York Academy of Sciences, 1312(1), 105–112. https://doi.org/10.1111/nyas.12396
- Robles, M., Torerom, M., & von Braun, J. (2009). When speculation matters. International Food Policy and Research Institute, 57, 1–8. https://ageconsearch.umn.edu/record/49999/files/ib57.pdf
- Rutledge, D. J. (1979). Trading volume and price variability: New evidence on the price effects of speculation. In Futures Markets: Their Establishment and Performance (pp. 137–156). Palo Alto, CA: Food Research Institute, Stanford University.
- Sayed, A., & Auret, C. J. (2018). The effectiveness of price limits in the South African white maize futures markets. Investment Analysts Journal, 47(3), 200–212. https://doi.org/10.1080/10293523.2018.1475591
- Sayed, A., & Auret, C. J. (2019). Volatility transmission in the South African white maize futures market. Eurasian Economic Review. Advance online publication https://doi.org/10.1007/s40822-019-00128-y
- Sims, C. (1972). Money, income and causality. American Economic Review, 62 (4), 540–552. https://links.jstor.org/sici?sici=0002-8282/28197209/2962/3A4/3C540/3AMIAC/3E2.0.CO/3B2-/23
- Sims, C. (1980). Macroeconomics and Reality. Econometrica, 48(1), 1–48. https://doi.org/10.2307/1912017
- Strydom, B., & McCullough, K. (2013). Price discovery in the South African white maize futures market. African Journal of Business Management, 7(26), 2603–2614. https://academicjournals.org/journal/AJBM/article-full-text-pdf/4A8270938082
- Tonin, J. M., Vieira, C. M., de Sousa Fragoso, R. M., & Martines Filho, J. G. (2020). Conditional correlation and volatility between spot and futures markets for soybean and corn. Agribusiness, 36(4), 707–724. https://doi.org/10.1002/agr.21664
- USDA WASDE. (2022). United states department of agriculture world agricultural supply and demand estimates Released 12th May 2022 by the National Agricultural Statistics Service (NASS), Agricultural Statistics Board, United States Department of Agriculture (USDA).
- Walt, L. V. D. (2016). The local white maize market in perspective. Economist.http://www.grainsa.co.za/upload/report_files/White-maize-market-in-perspective_ENG.pdf
- Wiley, M. K., & Daigler, R. T. (1998). Volume relationships among types of traders in the financial futures markets. Journal of Futures Markets, 18(1), 91.
- Working, H. (1953). Futures trading and hedging. American Economic Review, 43(3), 314–343. https://www.jstor.org/stable/1811346
- Working, H. (1960). Speculation on hedging markets. Food Research Institute Series, 1, 185. https://ageconsearch.umn.edu/record/136578/files/fris-1960-01-02-458.pdf
- Yang, J., Balyeat, R. B., & Leatham, D. J. (2005). Futures trading activity and commodity cash price volatility. Journal of Business Finance & Accounting, 32(1‐2), 297–323. https://doi.org/10.1111/j.0306-686X.2005.00595.x