
 ?Mathematical formulae have been encoded as MathML and are displayed in this HTML version using MathJax in order to improve their display. Uncheck the box to turn MathJax off. This feature requires Javascript. Click on a formula to zoom.
Abstract
The main aim of this study was to examine the effect of financial development on Ethiopia’s export diversification by applying annual time series data from the period 1980 to 2019. An ARDL estimation technique was employed. In the short run financial development, external debt, and real gross domestic product have a positive significant effect on export diversification. The coefficient of the error correction model is −0.7168 or 71.68% and it is statistically significant that a deviation from long-run equilibrium is not persistent rather it adjusts towards equilibrium at a speed of 71.68% per year. In the long run financial development, trade liberalization, external debt, and real gross domestic product have a positive significant effect on export performance and the bound test confirms the presence of long-run co-integration between variables. It is recommended that government and the national bank of Ethiopia can adjust both saving and lending interest rate policies, providing sufficient loan to export industries that diversify and shifts towards the export of manufactured goods would be indispensable, keeping track of international exchange rate adjustment, liberalization of external trade is crucial and the government of Ethiopia should allocate the borrowed money into high return investment and import substitute goods.
1. Introduction
Ali et al. (Citation1991) defined export diversification as the change in the composition of commodity exports. Export diversification is twofold, i.e. horizontal and vertical. The first deals with the number or volume of primary export commodities, but the latter is concerned with changes in the structure and commodities from primary to secondary and tertiary goods (Herzer & Nowak-Lehnmann, Citation2006). The exports of most developing countries in Africa are heavily dependent on very few primary commodities. The exports of primary commodities are extremely vulnerable to external shocks (Fonchamnyo & Akame, Citation2017). Sub-Saharan Africa’s export earnings largely depend on coffee, gold, oilseed, vegetables, hide, and skin, representing 80% of total export (World Bank, 2006). For more export entrepreneurs, financial development reduces liquidity constraints and encourages diversification of exports (Chaney, Citation2016; Hausmann & Rodrik, Citation2003). Prebisch’s (Citation1962) theory also argues that the export of primary products reduces the terms of trade and further increases the instability of income. Furthermore, to improve falling terms of trade, a country needs to diversify its export composition (Dogruel & Tekce, Citation2011); (Massell, Citation1964); (WILSON, Citation1984). They indicate that diversification of developing country exports should become a common economic policy objective (Brainard & Cooper, Citation1968; Dogruel & Tekce, Citation2011). Moreover, in the contemporary literature, opposite to the division of labour and specialization idea of Adam Smith, countries appear to diversify their production and exports as they grow (Hesse, Citation2009: Krugman, Citation1980).
Like other developing countries, the main objective of the Ethiopian government has been to achieve rapid and sustainable economic growth. Foreign trade is an area which has been emphasized in the various programs of the Ministry of Finance and Economic Development for the year 2002/03. External trade is the most important sector to generate foreign exchange needed to finance imports of essential goods and services for the economy and to promote the economic performance of the country (EEA, 2013). However, Ethiopian export heavily depends on very few primary products; which constitutes above 90% of the total export earnings. As stated in the World Bank Journal (2016), the prices of these primary products fluctuate from time to time and led to lower and unstable export revenues earning. Unless the countries diversify their export earnings, it is hard to achieve sustainable economic growth and reduces external debts.
One factor among different hindrances of export diversification is lower financial development. There are many measures of financial development, but the most frequently used measure is a credit to the private sector. Compared to low-income sub-Saharan African, Ethiopia’s financial sector development is low. The number of banks operating in Ethiopia remained at 18, of which 16 were private and the remaining 2 are publicly owned banks. These banks opened 4,625 branches, of which 68.2 percent were private bank branches. According to the central statistical agency estimation, the total population is 96,503,000. It indicates on average one branch serves 20,865.5 people. Among the total branches 34.4 percent resided in Addis Ababa in Addis Ababa there are only around four million residents. In Ethiopia 17 insurance companies are operating with 4.7 billion birr total capital from 17 insurance companies; 16 were privately owned, with a 74.6 percent share of total insurance capital. There are 518 branches, of which 53.90 percent were located at Addis Ababa. In addition to banks and insurance companies were 35 microfinance institutions (MFIs) with 28.4 billion birr saving deposit (NBE, 2017/2018 quarterly report). This causes a lower level of credit to the private sector.
For instance, the majority of funds by banks (two-thirds) have gone to the public sector. In 2011–2012 the share of credit going to the private sector was as high as 36 percent of total credit, but in June 2018 it declines to 32 percent. Still, the scale of such directed credit schemes to the public sector has been to such an extent that Ethiopia’s financial development now stands at just 11 percent of GDP, which is half of 20 largest African economies estimated 22 percent of GDP average. Therefore, Ethiopia’s financial sector is in need of much improvement if a more private sector–driven economy is to take hold in the coming years. Beyond the comparatively limited credit made available to the private sector, the specific forms and features of lending offered have not matched the needs and demands of most private sectors (CEPHEUS, 2019). Hence this study intends to examine the relationship between credit to the private sector, a proxy for financial development and export diversification in Ethiopia.
The remainder of the paper is presented as follows. Section 2 provides an overview of previous theoretical and empirical literature. Section 3 presents methodologies and data. The remaining sections 4 and 5 present the result and discussion and conclusion and recommendations, respectively.
2. Literature review
Export diversification is important for economic growth in that diversification of export reduces export earning instability caused by fluctuations in world commodity prices. According to WILSON (Citation1984), if a country relies on a few exportable products, one export commodity, and its foreign exchange position is highly insecure. Contrary to this, Cline (Citation1982) argued, export-led growth may break down if a large majority of developing countries seek to pursue it at the same time. Because the resulting outpouring of manufactured exports might be more than western markets could absorb. Generally, inadequate finance is a major constraint to a firm’s production, at least as perceived by the firms themselves. Theoretically, this perception is likely to be based on the liquidity constraint hypothesis, that is, the need to finance particularly physical capital but also other production inputs with significant fixed costs. Since such outlays entail lagged returns, sufficient liquidity through credit is required to keep the firm afloat until future returns are realized.
Also, as diversification often involves investment projects with long gestation periods, compared to primary production, greater liquidity would be required. Where such liquidity is lacking, firms are likely to resort to shorter-term, probably less productive, investment projects rather than to projects involving longer gestation periods, usually required by export diversification. Such liquidity constraint is similar to that relating to a debt constraint, where longer-term projects are less attractive to investors and the government in the presence of a debt constraint (Fosu & Abass, Citation2019). In addition, domestic credit is expected to reduce liquidity constraints through the increase in the number of entrepreneurs in the export sector, and in turn it facilitates export diversification (Chaney, Citation2016). Moreover, Hausmann & Rodrik (Citation2003) pointed out that overcoming the liquidity constraint is critical in terms of expanding exports, especially relatively diversified exports that are likely to require longer-term and riskier investment projects. Such circumvention would in turn require readily available sources of funding.
Recent theoretical and empirical studies emphasized the importance of export diversification instead of export specialization (Herzer & Nowak-Lehmann, Citation2006). According to Parteka and Tamberi (Citation2011) export diversification can be emanated from the change in the structure of the economy, which requires a deep transformation of a country’s economy along different development paths. In addition, Kiendrebeogo (Citation2012) pointed out that having a developed financial sector creates a comparative advantage in the industrial sector, which in turn contributes to the diversification of export. Though diversified external trade generates ample foreign exchange and in turn promotes economic growth (EEA, 2013), export of Ethiopia heavily depends on very few primary products; which constitute above 90% of the total export earnings. Moreover, the price of those primary products varies frequently from time to time, which worsens the problem and causes lower and unstable revenue, and a huge negative trade balance (World Bank Journal (WBJ, 2016)). Unless the countries diversify their export earnings, it is hard to achieve sustainable economic growth and reduces external debts (Yokoyama et al., Citation2015). Among the factors causing low export diversifications in Ethiopia, underdeveloped financial sector is the major one. Financial sector development is measured in terms of credit to the private sector by all banks. Ethiopia’s financial sector is underdeveloped and unfairly distributed (Kassie, Citation2014). According to the Ministry of Finance and Economic Development (MoFED (Ministry of Finance and Economic Development), Federal Democratic Republic of Ethiopia, Citation2006) since 2003 to achieve accelerated and sustainable growth the government of Ethiopia has emphasized external trade as a major tool. However, it is not as much as expected.
Despite this previous researchers gave low attention to the effect of credit to the private sector on export diversification. For instance, Oliveira et al. (Citation2020), Fosu and Abass (Citation2019), Dogruel and Tekce (Citation2011), Nieminen (Citation2020), Liu and Zhang (Citation2015), and Long et al. (Citation2017) conducted a study on determinants of export diversification. However, most of the studies focused on the exchange rate, economic growth, trade openness (trade liberalization), and other macro variables as determinants of export diversification. Thus most of the studies overlooked the effect of credit to the private sector on export diversification in the Ethiopian economy. Particularly in Ethiopia, hardly any evidence, there is no study conducted on the subject area. Therefore this study intended to fill these gaps and examine the effect of financial development, which is the factors policies, and institutions that lead to effective financial intermediation and markets, and deep and broad access to capital and financial services” (Financial Development Index, 2008) on export diversification of Ethiopia.
From the literature reviewed there is no adequate empirical and theoretical literature on the relationship between export diversification and credit to the private sector in Ethiopia. Some of the researchers did not consider the effect of financial development on the trade balance, particularly in Ethiopia, some other studies are out of date, and the remaining researches conducted are in developed countries. Hence we can’t conclude the same result as in developed countries because the micro- and macro-economic performance of developed and developing countries is different. Thus the reviewed literature shows there is no evidence providing the effect of financial development on export diversification in Ethiopia.
3. Data and methodology
This study employed a quantitative analytical research approach. Descriptive and inferential/empirical study designs were used. Time series data of 41 sample years from the period 1980 to 2020 drawn from secondary sources were used. The Auto Regressive Distributed Lag (ARDL) co-integration technique developed by Im et al. (Citation2003) and Pesaran et al. (Citation2001) was employed as an econometric analysis method to indicate the relationship between export diversification and financial development, and other control variables. ARDL is a dynamic unrestricted model in which the explained variable is expressed as a function of its lag and other explanatory variables. According to Charemza and Deadman (Citation1997), the methodology of the ARDL model follows a general to a specific approach, which enables the researcher to solve econometrics problems. ARDL model has many advantages over the Johansen (Citation1988) co-integration approach in that the first avoids the problem of the order of integration, suitable for both large and small samples (Pesaran et al., Citation2001), and provides unbiased estimates even when some of the explanatory variables are endogenous (Harris & Tzavalis, Citation1999).
3.1. Model specification
Based on the theoretical and empirical literature reviewed in this study, five variables are identified as factors that affect export diversification(ED). When identifying these variables we adopt Lugeiyamu (Citation2016) and modify it based on our objective. These are financial development (FD) measured by credit to private sector as a percentage of GDP (CPS%GDP), an official exchange rate (OER), external debt (EDEBT), real gross domestic product (RGDP), and trade liberalization (TL). Hence, the general model of the study is specified as follows:
3.1.1. Checking the existence of long-run relationship
This is a stage where the long-run relationship existing between variables is assessed. The existence of such a relationship is tested by computing a bound test for co-integration (bound F-statistic) to establish long-run relationship among variables. ARDL is extremely useful because it allows us to describe the existence of an equilibrium/relationship in terms of long-run and short-run dynamics without losing long-run information. The ARDL involves estimating the following equation:
The general ARDL (p, q) model is specified as:
Where are a vector and the variables
are allowed to be purely I (0) and I(1) or co-integrated; α and β are coefficients;
is constant; j = 1, 2, … .k; p and q are optimal lag orders for dependent and independent variables respectively;
is a vector of error terms i.e. unobservable zero mean white noise vector process (serially uncorrelated or independent.
βi represents long-run co-integration/relationship and αi represents short-run dynamics of the model. The existence of long-run co-integration will be tested based on the null hypothesis of βi’s = 0 against the alternative hypothesis βi’s 0. To identify the presence of co-integration in the long run bound test has been conducted. The value of F- statistics is used as identifying the existence of long-run relationship between dependent and independent variables. ARDL bound test is based on Null hypothesis (HO): no long-run relationship and alternative hypothesis (H1): there exists long-run relationship. The decision is to accept HO if F < critical value for I (0) independent variables or reject if F > critical value for I (1).
Estimation of long-run ARDL model requires the selection of optimal lag order using appropriate selection techniques. In this study, Akaike Information Criterion (AIC) selection criteria will be used. Hence, long-run ARDL will be estimated based on the following equations.
Most time series data exhibit a non-stationary trend and estimating a regression model with non-stationary data will result in spurious relationship and, in turn, causes misleading and biased parameter estimates. Though it only reveals short-run dynamics, to resolve such type of problem differencing variables is important. In this regard error correction model (ECM_1) will be included based on the existence of long-run co-integration or not.
If long-run co-integration exists between dependent and independent variables
On the other hand if there is no co-integration between dependent and independent variables the following short-run model has estimated:
3.2. Definition and summary statistics of variables
The dependent variable export diversification is measured by the normalized Herfindahl-Hirschman index or where X represents total exports of the economy at hand, xi represents the share in total exports of product i. by nature
, HHI is 1 if the trade pattern is completely concentrated, and 1/n if all products have equal shares in the export of a commodity. However, its value is substantially affected by n. to avoid this problem we used the normalized Herfindahl-Hirschman index. Therefore, as can be seen from Table and Figure , export is more diversified if HHIN is close to zero and vice versa. For the study sample, the mean value of export diversification is 0.41, with the highest diversification period in 2015 amounting to the normalized Herfindahl-Hirschman value of 0.209 and the highest concentration of Ethiopia’s export from 1980 to 2020 recorded in 1988 with a value of 0.694. Financial development is defined as all financial resources provided to the private sector by depository institutions through loans, purchases of non-equity securities, trade credits, and other accounts receivable. This measure of financial development is theoretically identified by King & Levine (Citation1993) and empirically investigated by Ahad (Citation2017). For the study sample, the mean value of financial development is 16.188 percent, with minimum and maximum of 6.11 and 34.537% respectively.
Figure 1. Trends of export diversification and financial development.
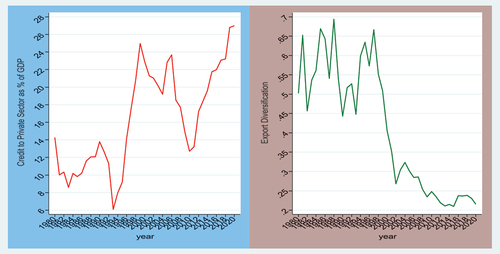
Table 1. Summary statistics of variables used in the study
In addition to financial development economic growth was used as an independent variable. The real GDP growth rate used in the empirical analysis averaged 5.9786% between 1980 and 2020 ranging from negative −11.144% to positive 13.57%with a standard deviation statistics of 6.6245. This growth variation across time in the country may be because of occurrences in domestic and external factors such as continuous deterioration in terms of trade, falling commodity prices, global economic downturn, and financial crisis in the international economies. The effect of economic growth on export diversification is ambiguous in that the expected signs under the absorption and monetary approaches are negative and positive respectively. Higher-income levels stimulate increased import demand as well as increased domestic production of tradable, leaving the ultimate impact on the trade balance somewhat indeterminate. However, it is argued that the former effect dominates the latter. In this study trade liberalization (TL) is used as a dummy variable. In 1992/93 the current government of Ethiopia implemented (major policy reforms). These policy measures include the reduction of tariff and non-tariff barriers, harmonization and simplification of tariffs, like tariff dispersion and lines, and reduction and gradual elimination of all controls including on domestic price. Before 1992 it takes the value 0 and 1 for post 1992.
External debt (Debt): External debt or borrowing refers to taking monetary aid from a foreign country or institution. It is expected that external debt has a negative relationship with export diversification. From 1980 to 2020 external debt as a percentage of GNI ranges from 10.5085 to 131.181% averaging 59.6873% with a standard deviation of 36.0638. This is an indication that countries in the region are heavily dependent on external financial source to fill their financial gaps or government budget deficit. Finally official exchange rate (OER): is an exchange rate at which the currency of one country can be exchanged for the currency of another country. During the study period, Ethiopia’s official exchange rate ranges from 2.07 to 28.323 with mean values and standard deviation of 9.293 birr/USD and 7.641 respectively. Depreciation in the domestic currency can cause the price of foreign goods to become relatively more expensive as compared to domestic goods. In effect, it may lead to the competitiveness of domestic exports and will cause a shift of resources from sectors that produce non-tradable to sectors producing tradable goods. This implies an increase in domestic export relative to imports, thereby improving export diversification.
3.3. The relationship between dependent and independent variables
In Figure graphical relationship between the dependent and independent variables is presented. For the purpose of drawing the graphical relationship, the dependent variable, export diversification, is changed in to growth value of Herfindahl-Hirschman index (GHHI) before normalization. On panel “A” one can understand that stock of external debt as a percentage of gross national income was continuously rising during the military government in Ethiopia. After the fall of the military government the stock of external debt as a percentage of RGDP started to very slowly decline, remaining at its high level until 1998 and then after it showed a radical decline to reach at its lowest level since ever in 2006. This was mainly due to debt cancellation made to the country from various creditors in 1999 and it was the reflection of the impact of HIPC relief assistance made to Ethiopia in 2006 proposed by IMF and IDA. There is a positive relationship with concentration, but it has negative relationship with export diversification.
Figure 2. The relationship between dependent and independent variables.
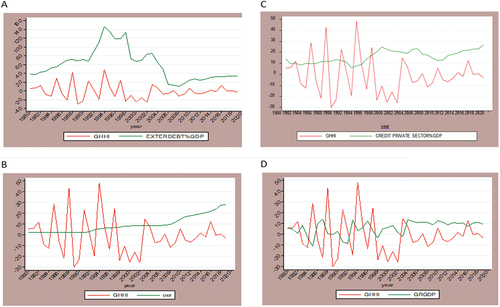
On panel “B” export diversification and official exchange rate are presented. During the study period Ethiopia’s official exchange rate ranges from 2.07 to 28.323, with mean values and standard deviation of 9.293 birr/USD and 7.641 respectively. In standard theory, depreciation will raise exports in the foreign market; this will improve investment and in the contrary depreciation will decrease import; which will discourage investment through increasing investment inputs imported from the rest of the world. In Ethiopia’s case the latter one mostly happens because Ethiopian investors import more capital goods than they export. In Ethiopia both the fixed exchange rate and the floating exchange rate regimes were implemented to manage the current account disequilibrium. The Ethiopian birr was pegged to the United States dollar (USD) from its beginning in 1945 until the early 1990s. The birr was valued at 2.48 per USD on 23 July 1945 and after two decades, that is, on 1 January 1964, the Ethiopian birr was slightly devalued to 2.50 per US dollar before the collapse of the Bretton Woods system in 1971, which forced an initial overvaluation to 2.30. Then in 1973 the birr devalued to 2.07 per USD. But since 1992 the contemporary Ethiopian government has accepted three big exchange rate devaluations proposed by the International Monetary Fund (IMF) in order to manage the current account disequilibrium. From the figure below it is clear that the trend of official exchange rate graph is a horizontal line-up to 1992 which means that a fixed official exchange rate during the Derg regime. In between 1992 and 2010 the graph shows an upward and relatively a flatter slope, and after 2010 it shows an upward and steeper slope. This figure also shows that the line of official exchange rate and the line of trade balance have no clear relationship throughout the study period.
On panel “C” the relationship between financial development measured as credit to private sector and export diversification is presented. During the study period bank credit to the private sector grew slowly because of the restriction imposed on the economic activities of the private sector. After the economic reform, however, bank claims on government grew on average by 3.2% while non-government borrowers increased by 20% per annum due to the increasing participation of the private sector. Credit disbursed to non-government borrowers accounted for 51% of the total domestic credit, up from 30% in 1991/92. Unlike the Derg period, bank credit to the private sector became a major determinant for the expansion of the monetary base. For example, the ratio of private credit as percent of GDP in 2004 was 19.1, the second highest in East Africa (Kiyotaet al., Citation2007). However, this does not necessarily mean that intermediation is stronger because Ethiopia’s GDP is relatively low. Credit to private sector has a negative relationship with concentration and has a positive relationship with export diversification.
Finally, on panel “D” the relationship between real GDP growth and export diversification is presented. As can be seen from the graph, real GDP growth shows variation due to occurrences in domestic and external factors such as continuous deterioration in terms of trade, falling commodity prices, global economic downturn, and financial crisis in the international economies. From the figure below we can understand that RGDP growth showed there are ups and downs in the years throughout the study sample which imply that there was no sustainable economic growth between such years.
4. Result and discussion
4.1. Unit root test
ARDL estimation requires that the order of integration of variables should be I (0) or I (1). To test the order of integration of the variables used in this study, the researcher used the augmented Dickey-Fuller test. This is considered to be the standard for testing unit roots. The orders of integration of all the variables used in this study are either I (0) or I (1). After confirming the variables’ order of integration, the ARDL methodology can be applied confidently since it meets the conditions for variables having either a I(0) or a I(1) order of integration. Using ADF test order of integration is reported in Table .
Table 2. Stationary test statistics and order of integration
4.2. Optimal lag selection
To identify the effect of financial development and other independent variables on trade balance using the ARDL model, the optimal lag length for each variable should be identified. Liew (Citation2004) calculated and compare and contrasts the probability of predicting the true lag length of variables for five lag selection criteria, namely the Akaike information criterion, the Schwarz information criterion, the Hannan-Quinn criterion, the final prediction error, and Bayesian information criterion. The author found that for a small sample (<60) Akaike information criterion fits best. Therefore, in this study Akaike’s information criterion (AIC) optimal lag selection model was used, which provides consistent estimates of the true lag order as compared to Schwarz’s Bayesian information criterion (SBIC). As can be seen in Table 4.3, the optimal lags was selected by using “varsoc”, which reports lag order selection statistics for a series of vector auto regressions through a requested maximum lag. Among the variables export diversification, official exchange rate and trade liberalization have an optimal lag length of 3 years. The 3-year lag for trade liberalization indicates that the current year export diversification is affected by trade liberalization policy which was designed three years ago. Similar explanations can be given for other variables. On the other hand credit to private sector, external debt, and real gross domestic product have an optimal lag length of 2 years ().
Table 3. Optimal lag selection of variables
4.3. ARDL bound test
In this study, the presence of co-integration, in the long run, is tested by a bound test. The value of F-statistics is used as identifying the existence of long-run relationship between dependent and independent variables. ARDL bound test is based on Null hypothesis (HO): no long-run relationship and alternative hypothesis (H1): there exists long-run relationship. The decision is to accept Ho if F < critical value for I (0) independent variables or reject if F > critical value for I (1). As we see from the table below the result shows that there exists long-run co-integration between variables. As reported in at 5 percent F-statistics (4.15) is greater than I (1), which is 3.79. Thus there is long-run co-integration between variables.
Table 4. Short-run error correction model
4.4. Long- and short-run estimation results
The short-run (ECM_1) and long-run regression results are presented in Tables respectively. The short-run model revealed that the coefficient of ECMt-1 (error correction term) is negative, and it is statistically significant at 1% level of precision with a value of 0.7168, which confirms that deviation from the long-run equilibrium after a short-run shock is corrected by about 71.68% at the end of each year. Therefore, we conclude that there is convergence towards long-run equilibrium. As indicated in section 2.2 exports diversification ranges from 0 to 1 and closer to 0 indicates a higher level of export diversification, but if it is closer to 1 it implies a higher degree of concentration. Because of the nature of the dependent variable negative coefficient between dependent and independent variables shows a positive effect and vice versa.
Table 5. Long-run ARDL estimation result
Table 6. Bound test of ARDL estimation
In both the long and short run credit to private sector, a proxy for financial development has a positive significant effect on export diversification. In the long run, 1% increase in financial development results in 0.245% increase in export diversification, and in the short run a 1% increase in financial development may cause 0.013% improvement in export diversification. This may be because financial development in the form of credit to private sector increases, and in turn it increases investment and domestic production. As the level of output produced increases there may be an increase in export in both value and number of exported commodities. This result is similar to the study by Ahad (Citation2017), Kumarasamy and Singh (Citation2018), and Adeola and Evans (Citation2017). The other variable which is found to be statistically significant is trade liberalization. In the long-run it has a positive significant effect, but in the short run has no significant effect on export diversification. The long-run coefficient is 2.31%, which is higher as compared to the effect of credit to private sector. This may be because domestic investors will have the incentive to produce diversified products and export to the rest of the world. This result is in line with the results found in the study of Cadot et al. (Citation2011), Xiang (Citation2007).
The third variable is the external debt which significantly affects export diversification. In both the long and short run external debt has a positive significant effect on the export diversification of Ethiopia. In the long run, a 1% increase in external debt as a percentage of GNI leads to a 0.057% increase in Ethiopia’s export diversification. While in the short run a 1% increase in external debt as a percentage of GNI results in 0.003 percent increase in export diversification. This will be true if the borrowed money is invested in productive assets and on exportable products. Our empirical findings are consistent with those of Udeh et al. (Citation2016) and Ugbaka and Oseigbemi (Citation2020). Finally, real gross domestic product has significant effects on the long and short run. In the long run, it has a positive significant effect on export diversification. A 1 percent growth in RGDP may cause a 0.105 percent increase in export diversification, while in the short run it will have a 0.0096 percent effect on export diversification. In the short run as domestic income increases domestic consumers will feel wealthier and demands high-quality products. In Ethiopian context, the perception of a consumer is that in domestic production the quality of goods and services is low so the propensity to import increases and import increase. This in turn leads to the deterioration of the trade balance in the country. However, in the long run, as income increases marginal propensity to save will outweigh the marginal propensity to consume and in turn increase investment and production. As production increases export volume and number of exported commodities will increase and import declines. This result is in line with the findings of Hesse (Citation2009), and as expected and found in some previous studies such as Lederman and Maloney (Citation2007). Besides using the Vector Error Correction Model Shadab and Tiwari (Citation2021) investigated the short-run and long–run relationship between export diversification and economic growth in the UAE and found a significant long-run relationship between export diversification and economic growth.
Finally, in the short run regression official exchange rate and trade liberalization have negative insignificant effect on export diversification at 5% level of precision. While in the long run only official exchange rate has an insignificant effect on export diversification. These may be because in the short run devaluation and trade policy change will cause inflationary impact in that as devaluation policy implements imported commodities in the domestic market will be expensive and also the cost of production will also increase, which in turn causes an increase in cost of production and will finally end lower level of production. Moreover, devaluation of domestic currency does not necessarily lead to an increase in export diversification. This result is in line with the findings of the study by Rose (Citation1990).
4.5. Stability test
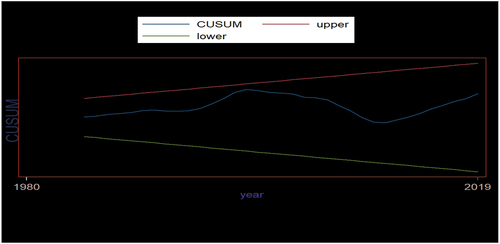
To test the structural stability both cumulative sum of squares (CUMSUMSQ) and cumulative sum (CUSUM), which are recommended by (Im et al., Citation2003; Pesaran et al., Citation2001), were used. If this cumulative sum square and cumulative sum goes outside the critical bound, one concludes that there was a structural break at the point at which the sum square and cumulative sum began its movement towards the bound. Hence, for the stability test, the graph plots both the cumulative sum square of residual with 5% critical lines. And, if the cumulative sum square and cumulative sum remains inside between the two critical lines or bounds back after it is out of the boundary lines, the null hypothesis of correct specification of the model cannot be rejected. But, if the cumulative sum square goes outside the two critical bounds, there exists a series parameter instability problem. The straight line on cumulative sum square graph represents critical bounds at a 5% level of significance. As depicted in Figure , the plot of CUMSUMSQ lies within the boundary lines. Moreover, on Figure cumulative sum plot lies with in the upper and lower bounds. This confirms the equation is correctly specified and that the model is stable. Furthermore, the result shows that there is no structural instability in the model during the sample period. Henceforth, the study can precisely conclude that long- and short-run estimates are quite stable and as well there is no structural break showing the results of the estimated model are efficient and reliable.
Figure 3. Stability, cumulative sum square plot, test of the mode.
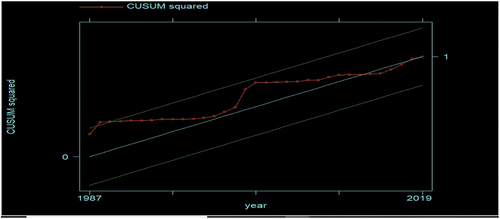
Figure 4. Stability, cumulative sum plot, test of the model.
4.6. Test of autocorrelation
The correlation between residuals is called autocorrelation which is induced by the transformation of the original data and manipulation of the data through interpretation and extrapolation. The simplest and most widely used model is one where the error term u and ut-1 have a correlation ρ. For this model one can think of testing hypothesis about ρ on the base of estimated correlation coefficient between the residuals. A commonly used statistic for this purpose is the Durbin-Watson (DW) statistic which is denoted by d. When DW statistic is zero (d = 0) the estimated correlation coefficient is 1 and d = 4 when the correlation coefficient which is estimated is −1. If d is closer to 0 or 4, then the residuals are highly correlated. The standard d statistic that serves as a rule of thumb is d = 2 which indicates that the estimated correlation coefficient is 0 and hence the residuals are not correlated. In this study, Durbin-Watson statistics is 1.95, which is approximately equal to 2, confirming that residuals are not correlated. In addition to the Durbin-Watson autocorrelation test in this study we conducted Breusch-Godfrey LM test for autocorrelation based on the null hypotheses of no serial correlation, and the test statistics presented in Table show that the Prob. > chi2 is 43.05%. Therefore we can conclude that there is no problem of autocorrelation Durabin-Watson d-statistic (20, 37) = 1.945497
H0: no serial correlation
Table 7. Breusch-Godfrey LM test for autocorrelation Breusch-Godfrey LM test for autocorrelation
5. Conclusion and recommendations
Like most developing countries, Ethiopia has been running a persistent trade deficit except in 1974/75. Many empirical studies show that least developing countries have been marginalized from the world economy and international markets, because of the structure, composition, and performance of the trade, particularly the export sector. Ethiopia is one of the most affected countries because its export highly depends on agricultural output in the form of raw materials and semi-processed commodities. As a result, it is important to diversify the export of goods. To do so identifying determinant factors has paramount importance. This study is conducted to examine the effect of financial development (credit to private sector) on export diversification using time series data from the period 1980 to 2020. An auto-regressive distributed lag estimation (ARDL) technique, which avoids the problem of the order of integration associated irrespective of I(0) or I(1), was used. Independent variables used in the model are credit to private sector as a percentage of gross domestic products as a proxy for financial development, trade liberalization, official exchange rate, external debt, and real gross domestic product.
The short-run ARDL estimation result indicates that credit to the private sector, trade liberalization, external debt, and real gross domestic product have a positive significant effect on export diversification. The short-run adjustment rate is negative 0.7168 or 71.68 percent which represents the existence of deviation from long-run equilibrium is adjusted towards equilibrium at a rate of 71.68 percent. In the long-run, however, credit to private sector has a positive significant effect on trade balance, i.e. an increase in credit to private sector enables investors to get enough resources for production and it stimulates domestic production. In addition, the trade liberalization coefficient is statistically significant, which advocates free trade international policy. Though the coefficient is positive, people’s preference is in favor of foreign goods, which will result in an increase in imports instead of export. The estimation result has also external debt positively affecting export diversification. Despite this, the level of threshhold should be determined and the government borrows based on that level. Finally, the real gross domestic product has positive significant effect on export diversification. The bound test of ARDL estimation shows the existence of long-run relationship.
To improve export diversification of Ethiopia’s credit to the private sector, as a proxy for financial development, is found to be an important variable. Thus the government and the national bank of Ethiopia can adjust both saving and lending interest rate policies. The increasing interest rates on savings will increase the deposit in the financial institution, which will make financial institutions have enough deposits to lend in the form of a loan. To equilibrate the demand and supply of loanable funds the authority concerned would reduce the lending interest rates. Moreover, providing sufficient loan to export industries that diversify and facilitates the shift towards the export of semi-finished and manufactured goods would be indispensable. A country borrowed either to finance its deficit or for the sake of large-scale investment in manufacturing goods. As a result, the government of Ethiopia will improve export diversification by allocating the borrowed money into high return investment and investing in industries that can substitute the imported goods. Finally boosting economic growth will improve the export diversification of Ethiopia making the trade will export diversity.
Disclosure statement
No potential conflict of interest was reported by the authors.
Additional information
Funding
References
- Adeola, O., & Evans, O. (2017). Financial inclusion, financial development, and economic diversification in Nigeria. The Journal of Developing Areas, 51(3), 1–16. https://doi.org/10.1353/jda.2017.0057
- Ahad, M. (2017). Financial development and money demand function: Co-integration, causality and variance decomposition analysis for Pakistan. Global Business Review, 18(4), 811–824.
- Ali, R., Alwang, J. R., & Siegel, P. B. (1991). Is export diversification the best way to achieve export growth and stability?: A look at three African countries (Vol. 729). World Bank Publications.
- Brainard, W. C., & Cooper, R. N. (1968). Uncertainty and diversification in international trade. Food Research Institute Studies, 8(1387–2016–116100), 257–285.
- Cadot, O., Carrère, C., & Strauss-Kahn, V. (2011). Export diversification: What’s behind the hump? Review of Economics and Statistics, 93(2), 590–605. https://doi.org/10.1162/REST_a_00078
- Chaney, T. (2016). Liquidity constrained exporters. Journal of Economic Dynamics and Control, 72, 141–154. https://doi.org/10.1016/j.jedc.2016.03.010
- Charemza, W. W., & Deadman, D. F. (1997). New directions in econometric practice. Books.
- Cline, W. R. (1982). Can the East Asian model of development be generalized?. World Development, 10(2), 81–90.
- Dogruel, S., & Tekce, M. (2011). Trade liberalization and export diversification in selected MENA countries. Topics in Middle Eastern and North African Economies, 13.
- Fonchamnyo, D. C., & Akame, A. R. (2017). Determinants of export diversification in Sub-Sahara African region: A fractionalized logit estimation model. Journal of Economics and Finance, 41(2), 330–342. https://doi.org/10.1007/s12197-016-9352-z
- Fosu, A. K., & Abass, A. F. (2019). Domestic credit and export diversification: Africa from a global perspective. Journal of African Business, 20(2), 160–179. https://doi.org/10.1080/15228916.2019.1582295
- Harris, R. D., & Tzavalis, E. (1999). Inference for unit roots in dynamic panels where the time dimension is fixed. Journal of Econometrics, 91(2), 201–226. https://doi.org/10.1016/S0304-4076(98)00076-1
- Hausmann, R., & Rodrik, D. (2003). Economic development as self-discovery. Journal of Development Economics, 72(2), 603–633. https://doi.org/10.1016/S0304-3878(03)00124-X
- Herzer, D., & Nowak-Lehmann, D F. (2006). Export diversification, externalities and growth: Evidence for Chile.
- Herzer, D., & Nowak-Lehnmann, D F. (2006). What does export diversification do for growth? An econometric analysis. Applied Economics, 38(15), 1825–1838. https://doi.org/10.1080/00036840500426983
- Hesse, H. (2009). Export diversification and economic growth. Breaking into new markets: Emerging lessons for export diversification. 2009, 55–80.
- Im, K. S., Pesaran, M. H., & Shin, Y. (2003). Testing for unit roots in heterogeneous panels. Journal of Econometrics, 115(1), 53–74. https://doi.org/10.1016/S0304-4076(03)00092-7
- Johansen, S. (1988). Statistical analysis of cointegration vectors. Journal of Economic Dynamics and Control, 12(2–3), 231–254. https://doi.org/10.1016/0165-1889(88)90041-3
- Kassie, A. (2014). Assessment of the performance of Ethiopian financial and economic environment. Global Journal of Management and Business Research.
- Kiendrebeogo, Y. (2012). Understanding the causal links between financial. Development and International Trade.
- King, R. G., & Levine, R. (1993). Finance and growth: Schumpeter might be right. The Quarterly Journal of Economics, 108(3), 717–737. https://doi.org/10.2307/2118406
- Kiyota, K., Pietsch, B., & Stern, R. M. (2007). The case for financial sector liberalization in Ethiopia.
- Krugman, P. (1980). Scale economies, product differentiation, and the pattern of trade. The American Economic Review, 70(5), 950–959.
- Kumarasamy, D., & Singh, P. (2018). Access to finance, financial development and firm ability to export: Experience from Asia–Pacific countries. Asian Economic Journal, 32(1), 15–38. https://doi.org/10.1111/asej.12140
- Lederman, D., & Maloney, W. (2007). Trade structure and growth in natural resources, neither curse nor destiny. In A copublication of Stanford economics and Finance, an imprint of. Stanford University Press, and the World Bank.
- Liew, V. K. S. (2004). Which lag length selection criteria should we employ? Economics Bulletin, 3(33), 1–9.
- Liu, X., & Zhang, J. (2015). Export diversification and exchange-rate regimes: Evidences from 72 developing countries.
- Long, T. H. A. I., Hong, P. M., & Anh-Dao, T. T. (2017). Real exchange rate and export diversification: How do financial crises shape the causation?
- Lugeiyamu, E. (2016). Is export diversification a key force to Africa’s economic growth?: Cross-country evidence.
- Massell, B. F. (1964). Export concentration and fluctuations in export earnings: A cross-section analysis. The American Economic Review, 54(2), 47–63.
- MoFED (Ministry of Finance and Economic Development), Federal Democratic Republic of Ethiopia. (2006). Ethiopia: Building on progress: A plan for accelerated and sustained development to end poverty.
- Nieminen, M. (2020). Multidimensional financial development, exporter behavior and export diversification. Economic Modelling, 93, 1–12. https://doi.org/10.1016/j.econmod.2020.07.021
- Oliveira, H. C. D., Jegu, E., & Santos, V. E. (2020). Dynamics and determinants of export diversification in Brazil from 2003 to 2013. Economia e Sociedade, 29(1), 29–51. https://doi.org/10.1590/1982–3533.2020v29n1art02
- Parteka, A., & Tamberi, M. (2011). Export diversification and development-empirical assessment. Universita’Politecnica delle Marche Dipartimento di Scienze Economiche e Sociali Working Paper, (359).
- Pesaran, M. H., Shin, Y., & Smith, R. J. (2001). Bounds testing approaches to the analysis of level relationships. Journal of Applied Econometrics, 16(3), 289–326. https://doi.org/10.1002/jae.616
- Prebisch, R. (1962). The economic development of Latin America and its principal problems. Economic Bulletin for Latin America.
- Rose, A. K. (1990). Exchange rates and the trade balance: Some evidence from developing countries. Economics Letters, 34(3), 271–275. https://doi.org/10.1016/0165-1765(90)90130-S
- Shadab, S., & Tiwari, A. (2021). The nexus between export diversification, imports, capital and economic growth in the United Arab Emirates: An empirical investigation. Cogent Economics & Finance, 9(1), 1914396. https://doi.org/10.1080/23322039.2021.1914396
- Udeh, S. N., Ugwu, J. I., & Onwuka, I. O. (2016). External debt and economic growth: The Nigeria experience. European Journal of Accounting Auditing and Finance Research, 4(2), 33–48.
- Ugbaka, A. M., & Oseigbemi, I. (2020). Effects of oil price shocks on manufacturing sector output in Nigeria (1986-2019). Babcock Journal of Economics, 7(2), 1–10.
- WILSON, R. J. (1984). Egypt’s export diversification: Benefits and constraints. The Developing Economies, 22(1), 86–101. https://doi.org/10.1111/j.1746-1049.1984.tb00653.x
- Xiang, C. (2007). Diversification cones, trade costs and factor market linkages. Journal of International Economics, 71(2), 448–466. https://doi.org/10.1016/j.jinteco.2006.07.008
- Yokoyama, S., Le, C. D., Fuji, H., Fujihara, Y., & Hoshikawa, K. 2015. Economic feasibility of diversified farming system in the flood-prone Mekong Delta: Simulation for Dike Area in An Giang Province, Vietnam. Asian Journal of Agriculture and Development, 15, 1362-2018-4978, 21–40.