
 ?Mathematical formulae have been encoded as MathML and are displayed in this HTML version using MathJax in order to improve their display. Uncheck the box to turn MathJax off. This feature requires Javascript. Click on a formula to zoom.
Abstract
This paper estimates and compares various efficiencies, namely, business, profit, and Z-Score efficiencies for private and publicly owned Indian banks. It uses the data envelopment analysis (DEA) following variable returns to scale, under input and output orientation, for measuring efficiency. Further, the Tobit regression model is used in the second stage to check the significant determinants from a list of bank-specific factors for various efficiencies. The study finds that the average efficiency scores of public sector banks (PSBs) are higher than private banks. The Z-score indicates that both PSBs and private banks are facing stability risks. Tobit regression model results confirm that return on assets and capital levels are significantly related to all types of efficiencies for private banks. On the other hand, the efficiency of PSBs is mainly affected by the level of non-performing assets, market share, size of the bank, return on assets, and capital level. It is inferred that the prompt corrective action (PCA) framework of RBI (2014) and the merger and consolidation of PSBs by the government (2019) favorably impacted the efficiencies of PSBs. Additionally, it identifies the stability risk of Indian banks and suggests banks should build up adequate capital for stressful situations.
1. Introduction
The total assets size of Indian banks is around $2.3 trillion at present, which is about 1.2 times the country’s GDP, signifying banks’ role in the Indian economy. The public sector banks (PSBs) control the majority share of banking business in India. However, in recent years, the private sector banks are gaining mileage over their counterparts. The incremental credit deposit ratio of private banks is about 67 percent, and the same for PSBs is as low as 32 percent (Financial Stability Report, RBI, July 2021). The PSBs in India are facing a stressful situation as evidenced by high non-performing loans (8.8 percent) and low capital adequacy ratios (14.4 percent) in comparison to their private counterparts which were 4.6 percent and 18.7 percent, respectively, as noted by the Financial Stability Report, RBI (December 2021). Further, the government of India (GOI) has been discussing for privatization of banks to improve efficiency. Presently, as published by Bank for International Settlements (BIS), India’s credit-to-GDP ratio remains in the range of 55 percent, which is one of the lowest among emerging economies. Given this, it is worth studying the efficiency of the Indian banking sector and understanding its determinants.
The issue of banking sector efficiency received substantial attention among academicians, policymakers, and researchers. There are some notable studies on the efficiency of Indian banks (Arrawatia et al., Citation2015; Babu & Kumar, Citation2018). Further, various types of banking efficiency are also examined by researchers in the Indian context. Prominent among them could be profit efficiency (Ray & Das, Citation2010; Singh et al., Citation2020); cost and revenue efficiency (Jayaraman & Srinivasan, Citation2014). However, the studies are mostly focused on measuring business or profit efficiency following the top-line approach or bottom-line approach without considering stability risk. This provides an impetus for the present study to analyze Z-score efficiency along with business and profit efficiency, to understand the overall efficiency and stability of the banking sector. The Data Envelopment Analysis (DEA) as a measure of efficiency has been substantially applied in Indian banking literature primarily due to its simplicity and capability to handle multiple inputs and outputs (Debnath & Shankar, Citation2008; Jayaraman & Srinivasan, Citation2019; Saha & Ravishanker, Citation2000). In banks, multiple inputs like employees, bank branches, and operating expenses produce various outputs such as total loans, investments, and profit. The present study applies a two-stage approach to measure efficiency and find its bank-specific determinants. The first stage consists of measuring the business, profit, and Z-Score efficiency of Indian banks applying the DEA technique for both PSBs and private sector banks individually. In the second stage, the Tobit model was applied to determine bank-specific factors that affect these efficiencies. The Tobit model is primarily useful for handling the characteristics of efficiency scores and acts as an appropriate model (Sufian, Citation2009). In the Tobit model, the dependent variable is efficiency scores, and the values are limited within a range between zero and one (0 ). The Tobit model, popularly known as the censored model, is widely applied in the case of banking efficiency analysis (Ariff & Can, Citation2008; Drake et al., Citation2006; Jia, Citation2009).
The novelty of the paper is as follows. Although several studies have been devoted to measuring various bank efficiencies and subsequently analyzed its determinants, this paper shall be unique in addressing the issue and compare them for two separate groups of banks together. Secondly, it introduces Z-score efficiency for Indian banks, as banks’ stability is being questioned at the time of financial stress. Thirdly, it uses extensive individual bank-wise database up to 2020 for measuring business, profit, and Z-Score efficiency for each bank individually and as a group of banks separately. Finally, it follows a two-stage method to analyze a wide range of bank-specific explanatory variables for determining bank group efficiency, which adds value to existing literature and provides policy suggestions.
The rest of the paper is structured as follows, including the present section. Section 2 discusses existing literature on bank efficiency measurement, the DEA technique, and its determinants. Section 3 presents the methodology; Section 4 describes data and models used; section 5 analyses estimated empirical results. Finally, section 6 concludes the analysis and suggests policy implications.
2. Literature review
The measurement and analysis issues of bank efficiency have been substantially discussed in literature theoretically and empirically across countries. Voluminous literature is available for measuring bank efficiency and the role and influence of bank-specific parameters like capital, level of non-performing loans, and bank size on bank efficiencies. In this section, we have reviewed a few recently selected noteworthy studies. The recent research of Maity et al. (Citation2020) suggested that, although Indian banks are working below their optimum capacity, they can increase their efficiency scores. Similarly, few studies on banking efficiency across countries such as Olson and Zoubi (Citation2011) for banks of MENA countries; Fu et al. (Citation2014) for banks of Asia Pacific Region; Hsiao et al. (Citation2015) for Chinese Banks; Moradi-Motlagh et al. (Citation2015) for Australian banks; Manlagnit (Citation2015) for Philippines banks may be noteworthy. Ariff and Can (Citation2008) studied Chinese banks’ profit efficiency using the DEA and Tobit model. The study found that private banks are more efficient as compared to state-owned banks.
Various studies measure the efficiency of banks through top-line and bottom-line approaches. In the top line approach, the business efficiency is looked at, whereby the banks aim to maximize their business level to have control over the market and increase their size (Azad et al., Citation2020; Debasish, Citation2016; Saha & Ravishanker, Citation2000; Y.C. Chen et al., Citation2013). Similarly, following the bottom-line approach, banks aim to maximize their bottom line and focus on profit efficiency (Akhigbe & Mcnulty, Citation2011; Ariff & Can, Citation2008; Das & Ghosh, Citation2009; Duho et al., Citation2020; Jayaraman & Srinivasan, Citation2019; A. N. Berger et al., Citation1993; Ray & Das, Citation2010; Srairi, Citation2010).
Over the years, the banking business has become more complex and riskier. The returns on investment have become more volatile. Hence, the question of stability and insolvency risk of banks cannot be avoided. The Z-Score of banks shows its stability (Beck et al., Citation2013; Lemonakis et al., Citation2015; Yeyati & Micco, Citation2007). The Z-score is defined as the ratio of return on assets (ROA + (Equity/ Assets) to the standard deviation of assets (World Bank, Citation2016). The higher Z-Score level shows low insolvency risk and low leveraged bank (A.N. Berger et al., Citation2008; Čihák & Hesse, Citation2010; Laeven & Levine, Citation2009; Yeyati & Micco, Citation2007). It is a proxy estimate of bank’s probability of failure (Čihák, Citation2007). The bank efficiency researchers have also studied the Z-score efficiency (Beck et al., Citation2013; Čihák & Hesse, Citation2010; Lemonakis et al., Citation2015).
The DEA has been used as a technique for measuring banks’ efficiency by academicians across the globe. To note some of them; Choudhry and Jayasekera (Citation2014) for European Commercial banks; Moradi-Motlagh and Saleh (Citation2014) for Australian banks; Avkiran (Citation2015) and An et al. (Citation2015) for Chinese banks; M.J. Chen et al. (Citation2015) for Taiwan banks; Isik and Hassan (Citation2003) for Turkish banks; Gulati (Citation2015), Ray (Citation2016), and Goswami et al. (Citation2019), and Singh et al. (Citation2020) for Indian banks.
Further, few studies examine the bank specific parameters as the determinants of bank efficiency. Dao and Nguyen (Citation2020) studied the banks in Vietnam and noted that the capital adequacy of banks significantly and positively influences the efficiency scores of banks. Similarly, Mohanty and Sarkar (Citation2020) studied the profit efficiency of Indian banks and found that return on assets, bank size, and non-performing assets negatively influence banks’ profitability. Once an efficiency score is obtained, the Tobit model can be applied to determine the factor affecting these efficiency scores. Staub et al. (Citation2010) studied the efficiency of Brazilian banks and noted that non-performing loans negatively affect banks’ efficiencies. Moradi-Motlagh and Jubb (Citation2020) also support the same idea that bad loans negatively impact Australian banks’ efficiency. Similarly, many studies on the determinants of banking efficiency exist across the countries. Few notable studies such as Sufian and Majid (Citation2007) for banks in Singapore; Kumar and Gulati (Citation2009) for Indian banks; Sufian (Citation2009) for Malaysian banks; Alrafadi et al. (Citation2015) for Libyan banks; Tesfay (Citation2016) for Ethiopian banks; Jackson and Fethi (Citation2000) for Turkish banks, may be worth to mention.
The literature review suggests that banks’ technical efficiency and its determinants have been substantially studied in India’s case. However, the present study is different from the rest as we have attempted to measure business, profit, and Z- score efficiency for each bank individually. We have also analyzed their determinants and efficiency separately for both public and private sector banks. The factors influencing different types of efficiency, studied by both input and output-oriented approaches, shall also be unique in this direction. It throws light on how the bank’s focus varies on targeting various efficiencies within the bank groups. Thus, the present study adds value and contributes to the existing literature.
3. Methodology
3.1. Data Envelopment Analysis (DEA)
The DEA is a non-parametric approach, commonly known as the CCR−Charnes-Cooper-Rhodes (Charnes et al., Citation1978) model used to measure the efficiency of decision-making units based on constant reruns to scale. The extended CCR model, known as BCC− Banker-Charnes-Cooper (Banker et al., Citation1984) model, includes the variable returns to scale in the production process. This is now widely used to measure the efficiency of decision-making units (DMUs) and rank them based on efficiency scores for various business units across banking, hospitals, companies, and firms of different sectors (Beasley, Citation1990). The present study uses the DEA under BCC model for its analysis. The DEA can be analyzed from two different orientation models, such as input-orientated and output-orientated (Coelli, Citation1996). The input-oriented model aims at reducing the inputs while keeping the output fixed, while the output-orientated model looks at the maximization of the outputs with the fixed level of inputs.
3.2. Second stage analysis: Tobit model
The Tobit model was initially proposed by (Tobin, Citation1958), also known as the censoring model, in which the dependent variable values remain within a limit. In the present study, the various efficiency scores, estimated through the DEA, fall in the range of zero and one (0 ) and can be considered dependent variables in the Tobit model. In this censored model, we assume the lower limit to be zero and the upper limit to be one, as in the case of a two-limit Tobit model, which works for a certain range of the dependent variable. One of the limitations is that the highest efficiency score or the upper limit may not always be one; however, due to the wide acceptability of the Tobit model, we have considered this in our study. The Tobit model is useful for the case of latent variable (Zeleke et al., Citation2021) and follows a general form
The general form of the Tobit model for the efficiency score of banks can be written as
where
The dependent variable y can be written as y = max ()
Where, is the set of parameters to be estimated,
is the set of explanatory variables and
is the error term. The
is the latent variable and
is the dependent variable which represents the efficiency score of banks. The model parameter is estimated with maximum likelihood estimation procedure. The statistical significance of the coefficient indicates the explanatory variable affects the dependent variable.
4. Data and models used
4.1. Efficiency score measurement
The year-wise data has been obtained from the Centre for Monitoring Indian Economy (CMIE) Mumbai, database, and annual reports of the individual commercial banks for the year 2004–2020. To maintain the uniformity of the individual bank data, the data beyond the year 2020 is not included in this study, as there are a series of mergers of PSBs in 2020. The data used for efficiency measurement are of two types, input and output variables. The selected input variables are the number of bank employees, bank branches, and expenses for bank employees. The output variables are total assets and total business (deposits plus advances) for measuring business efficiency, profit after tax (PAT) for measuring the profit efficiency, and calculated Z-Score of the bank for Z-Score efficiency. The Z-score indicates the banks’ buffer in terms of capital and returns to those returns standard deviation. It shows the strength of the bank when the returns are volatile. It is calculated as Z- Score = ROA+(equity/assets))/sd(ROA), where ROA- Return on Assets and sd(ROA) means standard deviation of Return on Assets.
Above mentioned selected variables are consistent with the literature on bank efficiency measurement across the countries (Gulati, Citation2015; Kamarudin et al., Citation2019; Kumar & Gulati, Citation2009; Olson & Zoubi, Citation2011; Reddy & Nirmala, Citation2013; Singh & Bansal, Citation2017).
The DEA model for efficiency is as follows
I (Employees, Bank branches, Salaries expenses) = (2)
is output for business efficiency,
for-profit and Z-Score efficiency, respectively.
4.2. Tobit regression model
After estimating the efficiency scores through the DEA technique next, we have applied the Tobit model. The model is used to find out the factors influencing such efficiencies. There are two sets of Tobit regression equations for public sector banks and the other for private banks. The regression equations models can be written as
Model for PSBs
Model for private banks
where, and
stand for the efficiency score of PSBs and private banks for business efficiency, profit efficiency, and Z-Score efficiency and for both input and output orientations separately. The detailed descriptions of the other variables used in the Tobit regression models are given in Table . as follows
Table 1. Description of variables in the Tobit estimation
The above-mentioned dependent variable is extensively used in the literature on the determinants of banking efficiency. There are some of the significant studies in this context (Adusei & McMillan, Citation2016; Dinberu & Wang, Citation2018: Singh & Bansal, Citation2017; Sufian, Citation2009). On the other hand, the explanatory variables from bank-specific parameters like bank capital, returns on assets, market share, size, ownership, loss provisions are prevalent in existing studies (Ariff & Can, Citation2008; Baral & Patnaik, Citation2022; Djalilov & Piesse, Citation2016; Jayaraman & Srinivasan, Citation2014; Jha et al., Citation2013; Le et al., Citation2019; Reddy & Nirmala, Citation2013; Wanke et al., Citation2022).
5. Empirical results and discussions
5.1. Efficiency scores
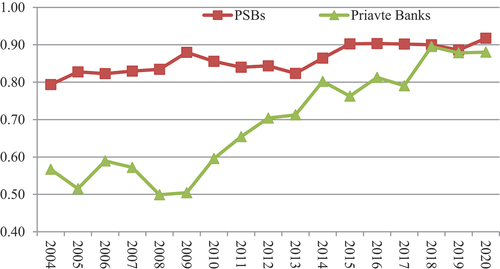
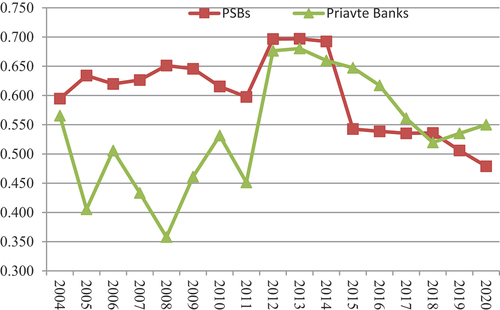
Table shows the average efficiency scores for various efficiencies across banks in India under the PSBs group and private sector bank group over 2004–2020. The average efficiency scores under various efficiencies are better for the PSBs as compared to private banks for both the input and output orientations. This result remains in line with the findings of earlier studies of Le et al. (Citation2019) for banks in Vietnam; and Azad et al. (Citation2020) for banks in Bangladesh. Among different efficiencies, the PSBs have better business efficiency scores in the range of 0.88–0.86 compared to 0.73–0.65 for profit efficiency, which is 0.61–0.72 for Z-score efficiency while considering the input and output orientation. It implies that PSBs are more aggressive in expanding their business and looking for a top-line approach than profit-making and increasing stability, as shown by Z-score efficiency. The same is also observed in private banks that have higher business efficiency than other efficiencies.
Table 2. Average efficiency scores of PSBs and private banks 2004–2020
As evident from the low Z-score of efficiency, most of the banks in India, both PSBs and private sector banks have stability risk. The lower side Z-score efficiency indicated that the risk of default of these banks is very high at the time of stress. Further, the variation in efficiency scores among banks within the group is higher for private banks than PSBs noted from the SD and CV.
Figure shows that in business efficiency, the PSBs have played a lead role compared to private banks up to 2017; however, the private banks are improving their efficiency continuously over time and able to reach on par with PSBs. In 2017, the RBI brought maximum PSBs under prompt corrective action (PCA) framework wherein the weak banks in terms of lower capital, banks reporting continuous losses are restricted for doing additional loans business. These banks are advised to concentrate on profit. It restricted more than half of the PSBs in India; 11 out of 21 banks are kept under this framework. This reduced the business growth of PSBs. To some extent, the post-demonetization of 2016 and GST implementation have some effect on these PSBs.
Figure 1. Business efficiency.
The average profit efficiency score of PSBs is higher as compared to private banks (Figure ). This finding contrasts with the existing study (Mutarindwa et al., Citation2021; Singh et al., Citation2020), where they opined that private banks are more profit efficient. It is also noted that the profit efficiency scores of the PSBs increased from 0.60 in 2016 to 0.64 in 2017 for the short time period, which may be due to the PCA framework in 2017 as these banks targeted more for the bottom-line approach for increasing profit. Otherwise, the profit efficiency scores reduced for both the bank groups from 0.63 as of 2015 to a low of 0.58 and 0.41 in 2020 for PSBs and private banks, respectively. Further, it is also observed that the Z-Score efficiency for the Indian banks, both for PSBs and private banks, has been falling in recent times (Figure ). The Z-score efficiency has fallen for the PSBs to as low as 0.48 in 2020, showing the stability risk for the PSBs.
Figure 2. Profit efficiency.
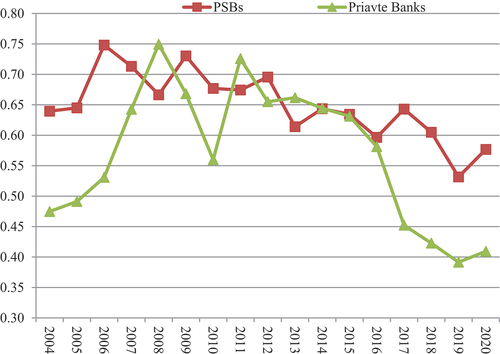
Figure 3. Z-Score efficiency.
5.2. Descriptive statistics
The descriptive statistics in Table provide a preliminary idea about explanatory variables used in the Tobit regression. It excludes dummy variables such as SIZE, HO, and AGE as they carry the values of either one or zero. As evident from the table, the PSBs in India are owned by the government, and the average ownership is 77 per cent. The share is as high as 93 percent for the united bank of India (UNBI), and the lowest is 59 percent for the state bank of India (SBI). It indicates that control power of the government on PSBs is exorbitant. The skewness and kurtosis values of 0 and 3, respectively, indicate the series normally distributed condition virtuous for the regression model. The null hypothesis of Jarque-Bera statistics is a joint hypothesis of the skewness being zero and the excess kurtosis being zero. Accepting the null hypothesis means the series is normally distributed. All the variables, except MRS, are normally distributed, as we accept the null hypothesis, indicating the estimated regression coefficient will provide efficient and robust results.
Table 3. Descriptive statistics of explanatory variables in the Tobit model
The descriptive statistics results indicate that the PSBs in India are burdened by high non-performing assets, low capital adequacy, lower ROA, and higher loan loss provisions as compared to private banks. Further, the average expenses on employees to total business are higher for private banks than PSBs. The average market share of business during 2004–2020 is captured by a few banks, both in PSBs and private banks, as evidenced by higher SD. The highest market share is owned by the state bank of India (28.84 percent) and ICICI bank (26.36 percent) among PSBs and private banks group, respectively. The other statistical parameters like SD and CV show variation and consistency within the data set. In general, the variation within the group is higher in the case of private banks in comparison to PSBs in all the parameters.
Table presents the correlation among explanatory variables used in the Tobit model is checked and confirmed that the model does not suffer severe multi-collinearity. The Variance Inflation Factor (VIF) also value does not exceed 5.
Table 4. Correlation matrix
5.3. Second stage analysis for the determinants of banking efficiency—Tobit regressions
The estimated results of the Tobit model is reported in Table . The efficiency score, being the dependent variable, regressed upon the bank-specific parameters as mentioned in the equation (Equation3(4)
(4) and 4). The Tobit regressions for the private banks use the same sets of explanatory variables as PSBs, except the government holding. Another dummy variable, AGE, is added as an explanatory variable for private banks.
Table 5. Tobit regression results for various efficiencies
The results show that the business efficiencies of PSBs have a positive and statistically significant relationship with the NPA level of banks, the market share of the individual bank, the large size of the bank, and government ownership. This result is consistent with the results of earlier studies (Delis et al., Citation2009; Fu et al., Citation2014; Isshaq & Bokpin, Citation2012). It implies that state-owned, larger-sized banks and banks with a higher market share positively influence business efficiency. It also indicates that PSBs increase their business with a rising level of risk. The level of capitalization, loan loss provisions, salary expenses percentage, and head office is at Mumbai have a negative relationship with the business efficiency of PSBs. In the case of private banks, the regression results suggest that the NPA level of banks, level of capitalization of banks, and return on assets are significant and positively related to business efficiency scores. Therefore, unlike the PSBs, private banks increase their business along with higher capital and better return on assets.
In the case of profit efficiency, variables such as NPA level of banks, return on assets, and market share directly influence the bank’s profits. The result is aligned with other studies where market share and return on assets influence efficiency positively (Ray & Das, Citation2010; Srairi, Citation2010). However, the loan loss provisions, and salaries expenses percentage are inversely related to profit efficiency scores. It implies a rise in credit risk, and the cost of the bank influences the profit efficiency inversely. In the related line, Jayaraman and Srinivasan (Citation2019) studied the Indian banks and noted that a rise in credit risk reduces the profit efficiency and cost-efficient banks are more profitable.
Similarly, the Z-score efficiency for PSBs is significantly positively related to the banks’ return on assets and negatively with loan loss provisions and the larger size of the bank. It asserts that a higher return on assets helps the banks increase their stability, whereas the bank’s risk and too large size reduce it. A similar result is also observed for the private banks; the Z-score efficiency score is positively related to the return on assets and the capital level, negatively with loan loss provisions. It entails that higher loss provisions reduce the bank’s stability, and higher return and capital level increase the banks’ stability. The overall significance of the model is observed from the probability statistics of LR. The results confirm that all the models provide robust results.
6. Conclusions and policy suggestions
Efficiency measurement of banks helps to understand the health of the banking system. A healthy banking environment is essential for economic growth. This paper estimates business, profit, and Z-score efficiencies for a wide range of banks in India over the years 2004–2020. On average, the efficiency scores of PSBs are higher in all types of efficiencies compared to private banks. However, the recent trend shows that private sector banks are capturing the businesses of the PSBs and having better business efficiency scores. It is also observed that the implementation of the PCA framework during 2017 helped the PSBs to look at the bottom line and improve their profit efficiency in 2017, although the business efficiency got negatively impacted. Further, the merger and consolidation of PSBs in 2019 by the Indian government improved its business and profit efficiency. The study suggests another round of mergers of PSBs to increase their efficiency.
For bankers and policymakers, the most concerning issue in recent years is that both PSBs and private banks are facing stability risk as observed from the lower Z-score of efficiency. The problem is more severe in PSBs, possibly because the PSBs in India are suffering from moral hazard problems. They are backed by the government for recapitalization as and when required. As a result, it changes banks’ attitudes toward proper risk management and apparently leads to banks’ moral hazard problems (Gopalakrishnan et al., Citation2018). As a policy recommendation, the government should not always provide backend support to PSBs to marinate the regulatory capital and its management. The government should take proactive measures to provide some facilities and flexibility to compete with private banks.
The study found that return on assets and capital level are two considerable factors significantly related to all types of efficiencies for private banks. However, the efficiency of PSBs is significantly associated with other factors like NPAs, market share, size of the bank, including the ROAs and capital level. The lower Z-score efficiency of Indian banks is related to lower capital and lower return on assets, which risk regulatory failure and insolvency. This study advocates for reducing government control over PSBs and incentivizes them to carry out government-sponsored populous programs. The process might help the PSBs to increase their business and profit efficiency substantially. The study highlights the stability risk of Indian banks and suggests that banks in India should focus on building an adequate level of capital for unforeseen stress situations.
Disclosure statement
No potential conflict of interest was reported by the author(s).
Additional information
Funding
References
- Adusei, M., & McMillan, D. (2016). Determinants of bank technical efficiency: Evidence from rural and community banks in Ghana. Cogent Business & Management, 3(1), 1–17. https://doi.org/10.1080/23311975.2016.1199519
- Akhigbe, A., & Mcnulty, J. E. (2011). Bank monitoring, profit efficiency and the commercial lending business model. Journal of Economics and Business, 63(6), 531–551. https://doi.org/10.1016/j.jeconbus.2011.07.001
- Alrafadi, K. M. S., Yusuf, M. M., & Kamaruddin, B. H. (2015). Measuring bank efficiency and its determinants in developing countries using data envelopment analysis: The case of Libya 2004-2010. International Journal of Business and Management, 10(9), 1–18. https://doi.org/10.5539/ijbm.v10n9p1
- Analysis. Margin—The Journal of Applied Economic Research, 13 (4), 361–380. https://doi.org/10.1177/2F0301574219868373
- An, Q., Chen, H., Wu, J., & Liang, L. (2015). Measuring slacks-based efficiency for commercial banks in China by using a two-stage DEA model with undesirable output. Annals of Operations Research, 235(1), 13–35. https://doi.org/10.1007/s10479-015-1987-1
- Ariff, M., & Can, L. (2008). Cost and profit efficiency of Chinese banks: A non-parametric analysis. China Economic Review, 19(2), 260–273. https://doi.org/10.1016/j.chieco.2007.04.001
- Arrawatia, R., Misra, A., Dawar, V., & S. K. Shanthi, Dr. Vinay Kumar Nang, D. (2015). Bank competition and efficiency: Empirical evidence from Indian market. International Journal of Law and Management, 57(3), 217–231. https://doi.org/10.1108/IJLMA-03-2014-0029
- Avkiran, N. K. (2015). An illustration of dynamic network DEA in commercial banking including robustness tests. Omega, 55, 141–150. https://doi.org/10.1016/j.omega.2014.07.002
- Azad, M. A. K., Wanke, P., Raihan, M. Z., Anwar, S. R., & Mustafa, R. (2020). Bank efficiency in Bangladesh revisited: A slack-based network DEA approach. Journal of Economic Studies, 47(5), 1001–1014. https://doi.org/10.1108/JES-01-2019-0029
- Babu, M. R., & Kumar, M. A. (2018). Evaluating the nationalization and privatization effect: A case of Indian banking industry. Banks and Bank Systems, 13(1), 11–21. http://dx.doi.org/10.21511/bbs.13(1).2018.02
- Banker, R. D., Charnes, A., & Cooper, W. W. (1984). Some models for estimating technical and scale inefficiencies in data envelopment analysis. Management Science, 30(9), 1078–1092. https://doi.org/10.1287/mnsc.30.9.1078
- Baral, R., & Patnaik, D. (2022). Bank efficiency and governance: Evidence from Indian banking. Journal of Management and Governance, 1–29. https://doi.org/10.1007/s10997-021-09610-9
- Beasley, J. E. (1990). Comparing university departments. Omega, 18(2), 171–183. https://doi.org/10.1016/0305-0483(90)90064-G
- Beck, T., De Jonghe, O., & Schepens, G. (2013). Bank competition and stability: Cross-country heterogeneity. Journal of Financial Intermediation, 22(2), 218–244. https://doi.org/10.1016/j.jfi.2012.07.001
- Berger, A. N., Hancock, D., & Humphrey, D. B. (1993). Bank efficiency derived from the profit function. Journal of Banking and Finance, 17(2–3), 317–347. https://doi.org/10.1016/0378-4266(93)90035-C
- Berger, A. N., Klapper, L. F., & Turk-Ariss, R. (2008). Bank competition and financial stability. Policy Research Working Paper, 4696, The World Bank Development Research Group, Washington, DC. https://openknowledge.worldbank.org/handle/10986/6794
- Charnes, A., Cooper, W. W., & Rhodes, E. (1978). Measuring the efficiency of decision making units. European Journal of Operational Research, 2(6), 429–444. https://doi.org/10.1016/0377-2217(78)90138-8
- Chen, Y. C., Chiu, Y. H., Huang, C. W., & Tu, C. H. (2013). The analysis of bank business performance and market risk—Applying Fuzzy DEA. Economic Modelling, 32, 225–232. http://dx.doi.org/10.1016/j.econmod.2013.02.008
- Chen, M. J., Chiu, Y. H., Jan, C., Chen, Y. C., & Liu, H. H. (2015). Efficiency and risk in commercial banks–hybrid DEA estimation. Global Economic Review, 44(3), 335–352. https://doi.org/10.1080/1226508X.2015.1067865
- Choudhry, T., & Jayasekera, R. (2014). Market efficiency during the global financial crisis: Empirical evidence from European banks. Journal of International Money and Finance, 49, 299–318. https://doi.org/10.1016/j.jimonfin.2014.03.008
- Čihák, M. (2007). Systemic Loss: A Measure of Financial Stability. Czech Journal of Economics and Finance, 57(1–2), 5–26. https://journal.fsv.cuni.cz/storage/1073_fau_1_2_07_00000000005.pdf
- Čihák, M., & Hesse, H. (2010). Islamic banks and financial stability: An empirical analysis. Journal of Financial Services Research, 38(2–3), 95–113. https://doi.org/10.1007/s10693-010-0089-0
- Coelli, T. J. (1996). A guide to DEAP version 2.1: A data envelopment analysis (Computer) program. CEPA Working Paper 96/08, University of New England, Armidale.
- Dao, B. T. T., & Nguyen, K. A. (2020). Bank capital adequacy ratio and bank performance in Vietnam: A simultaneous equations framework. The Journal of Asian Finance, Economics, and Business, 7(6), 39–46.
- Das, A., & Ghosh, S. (2009). Financial deregulation and profit efficiency: A nonparametric analysis of Indian banks. Journal of Economic and Business, 61(6), 509–528. https://doi.org/10.1016/j.jeconbus.2009.07.003
- Debasish, S. S. (2016). Efficiency performance in Indian banking – Use of data envelopment analysis. Global Business Review, 7(2), 325–333. https://doi.org/10.1177/097215090600700209
- Debnath, R., & Shankar, R. (2008). Measuring performance of Indian banks: An application data envelopment analysis. Int. J. Business Performance Management, 10(1), 57–85. https://dx.doi.org/10.1504/IJBPM.2008.015921
- Delis, M. D., Papanikolaou, N. I., & Pasiouras, F. (2009). Determinants of bank efficiency: Evidence from a semi‐parametric methodology. Managerial Finance, 35(3), 260–275. https://doi.org/10.1108/03074350910931771
- Dinberu, Y. D., & Wang, M. (2018). Drivers of technical efficiency of Ethiopian commercial banks: DEA approach & Tobit model. Research Journal of Finance and Accounting, 9(4), 30–38.
- Djalilov, K., & Piesse, J. (2016). Determinants of bank profitability in transition countries: What matters most? Research in International Business and Finance, 38, 69–82. https://doi.org/10.1016/j.ribaf.2016.03.015
- Drake, L., Hall, M. J. B., & Simper, R. (2006). The impact of macroeconomic and regulatory factors on bank efficiency: A non-parametric analysis of Hong Kong’s banking system. Journal of Banking and Finance, 30(5), 1443–1466. https://doi.org/10.1016/j.jbankfin.2005.03.022
- Duho, K. C. T., Onumah, J. M., Owodo, R. A., Asare, E. T., & Onumah, R. M. (2020). Bank risk, profit efficiency and profitability in a frontier market. Journal of Economic and Administrative Sciences, 36(4), 381–402. https://doi.org/10.1108/JEAS-01–2019-0009
- Fu, X. M., Lin, Y. R., & Molyneux, P. (2014). Bank efficiency and shareholder value in Asia Pacific. Journal of International Financial Markets, Institutions and Money, 33, 200–222. https://doi.org/10.1016/j.intfin.2014.08.004
- Gopalakrishnan, B., Jacob, J., & Pandey, A. (2018). Lender moral hazard in state-owned banks: Evidence from an emerging economy. Working Paper 2018-07-01. Indian Institute of Management, Ahmedabad, India.https://web.iima.ac.in/assets/snippets/workingpaperpdf/7760930622018-07-01.pdf
- Goswami, R., Hussain, F., & Kumar, M. (2019). Banking efficiency determinants in India: A two-stage analysis .Margin: The Journal of Applied Economic Research, 13(14),361–380. https://doi.org/10.1177/0301574219868373
- Gulati, R. (2015). Trends of cost efficiency in response to financial deregulation: The case of Indian banks. Benchmarking: An International Journal, 22(5), 808–838. https://doi.org/10.1108/BIJ-06-2013-0065
- Hsiao, C., Shen, Y., & Bian, W. (2015). Evaluating the effectiveness of China’s financial reform-The efficiency of China’s domestic banks. China Economic Review, 35, 70–82. https://doi.org/10.1016/j.chieco.2015.05.006
- Isik, I., & Hassan, M. K. (2003). Efficiency, ownership and market structure, corporate control and governance in the Turkish banking industry. Journal of Business Finance Accounting, 30(9–10), 1363–1421. https://doi.org/10.1111/j.0306-686X.2003.05533.x
- Isshaq, Z., & Bokpin, G. A. (2012). Expansion and efficiency in banking: Evidence from Ghana. Managerial and Decision Economics, 33(1), 19–28. https://doi.org/10.1002/mde.1556
- Jackson, P. M., & Fethi, M. D. (2000). In Evaluating the technical efficiency of Turkish commercial banks: An application of DEA and Tobit analysis. University of Queensland. https://leicester.figshare.com/articles/report/Evaluating_the_efficiency_of_Turkish_commercial_banks_an_application_of_DEA_and_Tobit_Analysis/10077092/1
- Jayaraman, A. R., & Srinivasan, M. R. (2014). Analyzing the profit efficiency of banks in India with undesirable output – Nerlovian profit indicator approach. IIMB Management Review, 26(4), 222–233. https://doi.org/10.1016/j.iimb.2014.09.003
- Jayaraman, A. R., & Srinivasan, M. R. (2019). Determinants of Indian banks efficiency: A two-stage approach. International Journal of Operational Research, 36(2), 270–291. https://dx.doi.org/10.1504/IJOR.2019.102414
- Jha, S., Xiaofeng, H., & Sun, B. (2013). Commercial banking efficiency in Nepal: application of DEA and Tobit model. Information Technology Journal, 12(2), 306–314. https://dx.doi.org/10.3923/itj.2013.306.314
- Jia, C. (2009). The effect of ownership on the prudential behavior of banks the case of China. Journal of Banking & Finance, 33(1), 77–87. https://doi.org/10.1016/j.jbankfin.2007.03.017
- Kamarudin, F., Sufian, F., Nassir, A. M., Anwar, N. A. M., & Hussain, H. I. (2019). Bank efficiency in Malaysia a DEA approach. Journal of Central Banking Theory and Practice, 8(1), 133–162. https://doi.org/10.2478/jcbtp-2019-0007
- Kumar, S., & Gulati, R. (2009). Technical efficiency and its determinants in the Indian domestic banking industry: An application of DEA and Tobit analysis. American Journal of Finance and Accounting, 1(3), 256–296. https://doi.org/10.1504/AJFA.2009.026484
- Laeven, L., & Levine, R. (2009). Bank governance, regulation and risk taking. Journal of Financial Economics, 93(2), 259–275. https://doi.org/10.1016/j.jfineco.2008.09.003
- Le, P. T., Harvie, C., Arjomandi, A., & Borthwick, J. (2019). Financial liberalisation, bank ownership type and performance in a transition economy: The case of Vietnam. Pacific-Basin Finance Journal, 57, 101182. https://doi.org/10.1016/j.pacfin.2019.101182
- Lemonakis, C., Voulgaris, F., Vassakis, K., & Christakis, S. (2015). Efficiency, capital and risk in banking industry: The case of Middle East and North Africa (MENA) countries. International Journal of Financial Engineering and Risk Management, 2(2), 109–123. https://doi.org/10.1504/IJFERM.2015.074042
- Maity, S., Sahu, T. N., & Biswas, D. (2020). Assessing efficiency of private sector banks in India: An empirical investigation using DEA. International Journal Financial Services Management, 10(2), 138–155. https://doi.org/10.1504/IJFSM.2020.110223
- Manlagnit, M. C. V. (2015). Basel regulations and banks’ efficiency: The case of the Philippines. Journal of Asian Economics, 39, 72–85. https://doi.org/10.1016/j.asieco.2015.06.001
- Mayers, R. H. (1990). Classical and Modern Regression with Applications, PWS10. Kent Publishing Company.
- Midi, H., Sarkar, S. K., & Rana, S. (2010). Collinearity diagnostics of binary logistic regression model. Journal of Interdisciplinary Mathematics, 13(3), 253–267. https://doi.org/10.1080/09720502.2010.10700699
- Mohanty, B., & Sarkar, S. (2020). Impact of bank-specific and external factors on profitability: An empirical study of PSU banks in India. Journal of Asia-Pacific Business, 21(3), 227–242. https://doi.org/10.1080/10599231.2020.1783983
- Moradi-Motlagh, A., & Jubb, C. (2020). Examining irresponsible lending using non-radial inefficiency measures: Evidence from Australian banks. Economic Analysis and Policy, 66, 96–108. https://doi.org/10.1016/j.eap.2020.03.003
- Moradi-Motlagh, A., & Saleh, A. S. (2014). Re-examining the technical efficiency of Australian banks: A bootstrap DEA approach. Australian Economic Papers, 53(1–2), 112–128. https://doi.org/10.1111/1467-8454.12024
- Moradi-Motlagh, A., Valadkhani, A., & Saleh, A. S. (2015). Rising efficiency and cost saving in Australian banks: A bootstrap approach. Applied Economics Letters, 22(3), 189–194. https://doi.org/10.1080/13504851.2014.932044
- Mutarindwa, S., Siraj, I., & Stephan, A. (2021). Ownership and bank efficiency in Africa: True fixed effects stochastic frontier analysis. Journal of Financial Stability, 54, 100886. https://doi.org/10.1016/j.jfs.2021.100886
- Olson, D., & Zoubi, T. A. (2011). Efficiency and bank profitability in MENA countries. Emerging Markets Review, 12(2), 94–110. https://doi.org/10.1016/j.ememar.2011.02.003
- Ray, S. (2016). Cost efficiency in an Indian bank branch network: A centralized resource allocation model. Omega, 65, 69–81. https://doi.org/10.1016/j.omega.2015.12.009
- Ray, S. C., & Das, A. (2010). Distribution of cost and profit efficiency: Evidence from Indian banking. European Journal of Operational Research, 201(1), 297–307. https://doi.org/10.1016/j.ejor.2009.02.030
- RBI, (2021a). Financial Stability Report, 23. Reserve Bank of India, Mumbai. https://rbidocs.rbi.org.in/rdocs//PublicationReport/Pdfs/FSRJULY20210595CD3BEDFA466EBE9169BCE426E32C.PDF
- RBI, (2021b). Financial stability report, 24. https://rbidocs.rbi.org.in/rdocs//PublicationReport/Pdfs/FSRDEC2021_FULL2D99E6548CD0478CA90EE717F2B85D45.PDF
- Reddy, K. S., & Nirmala, V. (2013). Profit efficiency and its determinants: Evidence from Indian commercial banks. Journal of Transnational Management, 18(2), 125–163. https://doi.org/10.1080/15475778.2013.782236
- Saha, A., & Ravishanker, T. S. (2000). Rating of Indian commercial banks: A DEA approach. European Journal of Operational Research, 124(1), 187–203. https://doi.org/10.1016/S0377-2217(99)00167-8
- Singh, O., & Bansal, S. (2017). An analysis of revenue maximising efficiency of public sector banks in the post-reforms period. Journal of Central Banking Theory and Practice, 6(1), 111–125. https://doi.org/10.1515/jcbtp-2017-0006
- Singh, P. K., Thaker, K., & Papavassiliou, V. (2020). Profit efficiency and determinants of Indian banks; A truncated bootstrap and data envelopment analysis. Cogent Economics & Finance, 8(1), 1724242. https://doi.org/10.1080/23322039.2020.1724242
- Srairi, S. A. (2010). Cost and profit efficiency of conventional and Islamic banks in GCC countries. Journal of Productivity Analysis, 34(1), 45–62. https://doi.org/10.1007/s11123-009-0161-7
- Staub, R. B., Souza, G. S., & Tabak, B. M. (2010). Evolution of bank efficiency in Brazil: A DEA approach. European Journal of Operational Research, 202(1), 204–213. https://doi.org/10.1016/j.ejor.2009.04.025
- Sufian, F. (2009). The determinants of efficiency of publicly listed Chinese banks: Evidence from two-stage banking models. Macroeconomics and Finance in Emerging Market Economies, 2(1), 93–133. https://doi.org/10.1080/17520840902726458
- Sufian, F., & Majid, M. Z. A. (2007). Deregulation, consolidation and banks efficiency in Singapore: Evidence from event study window approach and Tobit analysis. International Review of Economics, 54(2), 261–283. https://doi.org/10.1007/s12232-007-0017-2
- Tesfay, T. (2016). Determinants of commercial banks efficiency: Evidence from selected commercial banks of Ethiopia. International Journal of Scientific and Research Publications, 6(5), 551–556.
- Tobin, J. (1958). Estimation of relationships for limited dependent variables. Econometrica, 26(1), 24–26. https://doi.org/10.2307/1907382
- Wanke, P., Skully, M., Wijesiri, M., Walker, T., & Dalla Pellegrina, L. (2022). Does ownership structure affect firm performance? Evidence of Indian bank efficiency before and after the global financial crisis. International Transactions in Operational Research, 29(3), 1842–1867. https://doi.org/10.1111/itor.13072
- World Bank. (2016). Global financial development report, world bank report. https://www.worldbank.org/en/publication/gfdr/gfdr-2016/background/financial-stability
- Yeyati, E. L., & Micco, A. (2007). Concentration and foreign penetration in Latin American banking sectors: Impact on competition and risk. Journal of Banking & Finance, 31(6), 1633–1647. https://doi.org/10.1016/j.jbankfin.2006.11.003
- Zeleke, B. D., Geleto, A. K., Komicha, H. H., Asefa, S., & Zhang, X. (2021). Determinants of adopting improved bread wheat varieties in Arsi Highland, Oromia region, Ethiopia: A double-hurdle approach. Cogent Economics & Finance, 9(1), 1932040. https://doi.org/10.1080/23322039.2021.1932040
