
Abstract
The main aim of this study was to examine Mebratu-B-PLC Theory Implication on developing Country oxygen of Bank. The quantitative data covered from 2011–2021 for the sample of eleven non-public commercial banks was collected from the annual report of the National Bank of Ethiopia and World Bank data. The panel the least square regression analysis showed that, except capital adequacy all explanatory variables’ customer growth rate, branch expansion, profitability, life expectancy rate and deposit interest rate affect deposit growth of non-public commercial bank shave positive, whereas GDP growth rate has negative significant effect on deposit growth of non-public commercial banks. From the results, branch expansion rate and customer growth rate were the two most powerful variables that affected deposit growth rate. Those non-public commercial banks that were sampled should build their image to attract more customers.
1. Introduction
As financial intermediaries, banks are in the business of attracting deposits from individuals, businesses, and other organizations and then lending such funds to their customers with current credit needs. A bank’s success in finding depositors consequently plays a critical role in its ability to satisfy customer credit demands and perform other banking functions. Moreover, much of a bank’s profitability is derived from gathering deposits at one set of interest rates and then lending or investing these funds at higher rates. These key roles that deposits play in overall bank performance have thus drawn much attention to bank funding practices and the ability of individual banks to maintain or expand their deposit base (Harvey & Spong, Citation2001). Banks play an intermediary role by mobilizing funds from savers (those who have excess funds) and subsequently lending them to investors (those who are deficient in funds) (an intermediary). However, banks cannot exist without deposits (Garo, Citation2015), which are referred to as the oxygen of banks.
Banks contribute to economic growth by facilitating investment and increasing capital accumulation, and this is only possible if banks have sufficient deposits. Deposits are also the working capital of the economy, and the sustainability and profitability of banks are impossible without deposits. Therefore, deposit mobilization is the main function of banks. That is why it is called the oxygen of the banks. Banks strive to mobilize deposits, as this is the fundamental goal of all banks. Banks, however, use deposits as a source of funding for loans and investments, and they are also banks that operate with less capital compared to other institutions because they have the potential to use deposits to establish, expand, and sustain their banks. Therefore, banks can make huge profits from deposits (Gunasekara & Kumari, Citation2018).
Ethiopians depend more on informal institutions for their money-related needs. According to Mengestu (Citation2018), although 62% of Ethiopians reported saving money in the year 2017, only 26% saved formally at financial institutions, while 38% saved with a person outside a family or at an informal savings club such as Iqub or the Savings and Credit Association. That means money is kept in a traditional way, and the majority of the population is unbanked. This indicate that there is a serious problem of deposit mobilization of non-public commercial banks in Ethiopia. As per Mengestu (Citation2018), the percentage of adults with account ownership in Ethiopia rose to 35% in 2017 from 22% in 2014. Despite this increment, Ethiopia lags behind its neighboring countries. For example, in Kenya, 82% of adults have an account, while in Rwanda, account ownership stands at 50%. This shows that the deposit mobilization practice among non-public commercial banks in Ethiopia is not developed.
According to the NBE's Citation2021 annual report, despite the arrival of two new non-public banks and the opening of 61 new branches by non-public commercial banks, the share of non-public banks in deposit mobilization went down to 33.3% from the previous year year's 35.2%. And also, based on the Citation2011 NBE annual report, the share of private commercial banks in total deposit mobilization increased to 42.6%. Even if there is an increase in the share of deposit growth, non-public commercial banks are characterized by several problems in relation to deposit mobilization. From the year 2011 to 2020, the average percentage shares increment of a non-public commercial bank in deposit mobilization relative to the public commercial bank of Ethiopia was 1.64%, which is very low. This indicates that deposit mobilization in Ethiopia is largely dominated by the two public banks.
According to the research conducted by Fekadu, Citation2019; Matusalem, Citation2020; Okere & n.d. Ugbu, Citation2015; Simeon & Yidnekachew, Citation2017; Tenaye, Citation2019; Zewde et al., Citation2018), branch expansion has a positive and significant impact on the deposit growth of private commercial banks. In contrast, the research conducted by Islam et al., Citation2019) shows that branch expansion has a negative impact on the bank’s deposit growth. The investigation conducted by (Boadi et al., Citation2015; Fekadu, Citation2019; Matusalem, Citation2020; Samantaraya & Patra, Citation2014) indicates deposit interest rate has positive and significant effect on deposit growth. On the other hand, Ongeti (Citation2016) argues that the impact of the deposit interest rate was moderate. Additionally, Ketema (Citation2017) argues that the impact of the deposit interest rate on deposit growth was positive but insignificant. In contradict to the above, all literatures about deposit interest rate (Tenaye, Citation2019) argue that deposit interest rate has negative and significant effect on deposit growth. The analysis made by (Fisseha, Citation2011; Islam et al., Citation2019; Matusalem, Citation2020; Yakubu & Abokor, Citation2020) shows that inflation rate has positive and significant effect on deposit growth. Whereas the study by Nafkot (Citation2016) argues that inflation has no significant effect on deposit growth,
Finally, the studies by Matusalem (Citation2020) and Simeon and Yidnekachew (Citation2017) argue that population growth has a positive and significant effect on the growth of private commercial bank deposits. While the study conducted by Dereje (Citation2017) shows that population growth has a negative and insignificant effect on private commercial bank deposit growth, In general, the inconsistency in funding among researchers may be due to the limited sample size of some non-public commercial banks or only one commercial bank outside of Ethiopia (in the case of Ethiopia), as well as the researchers’ poor attention to the determinants of deposit mobilization in non-public commercial banks and differences in macroeconomic policies from one country to another using theoretical implications. Therefore, this study aims to investigate the impact of the Mebratu-B-PLC theory on the bank oxygen of developing countries, which has not been studied before. The rest of the study is organized as follows: Section 2 provides an overview of the literature. The materials and methods are presented in Section 3. The empirical results of the panel regression random effects model analysis are presented in Section 4, and the last part, Section 5, concludes the study.
2. Literature review
2.1. Mebratu-B-PLC theory
Theories are formulated to explain, predict, and understand phenomena and to expand existing knowledge within the limits of critical assumptions. The theoretical framework is the structure that can contain or support a theory of a research study. The theoretical framework presents and describes the theory that explains why the research problem under study exists. To explain and predict the relationship between bank deposit/oxygen/mobilization and its factorization, the following theories are tested. Under this popular theory, this paper coined the Mebratu-B-PLC theory of reserve stock theory (Carroll et al., Citation1992), the permanent income hypothesis (Friedman, Citation1957), the life cycle hypothesis of life (Modigliani, Citation1986), and the classic interest rate theory for the development of research hypotheses.
2.2. The buffer-stock theory of savings
According to Carroll et al., Citation1992), this theory postulates that individuals shield their consumption against unexpected fluctuations in income by holding more assets. It argues that consumers are impatient and prudent in the face of unpredictable income fluctuations. The buffer-stock theory assumes consumers to be impatient because they resort to borrowing against future income in order to meet current consumption if income were certain, and also prudent because they have precautionary motives. To avoid or avert the dangers associated with future fluctuations in income and also retain a smooth consumption pattern, individuals are forced to set aside some precautionary reserves by reducing their current consumption in order to save against the contingent occurrences. Hence, one would anticipate the savings rate to be pro-cyclical, with people saving more when earnings are higher in order to smooth utilization in bad times. This theory is related to the deposit interest rate.
2.3. The permanent-income theory of savings
The permanent income hypothesis argues that consumption is proportional to a consumer’s estimate of permanent income. Money is saved for a period in life where income might be below this personal permanent income level. The underlying motive to save is the desire to smooth out fluctuations in income so that they save during periods of unusually high income (Friedman, Citation1957). According to the permanent-income hypothesis, consumption at a particular point in time is dependent not only on one's current income but also on one's expected future income (permanent income). The theory postulates that a consumer will save only if he or she expects that his or her long-term average income (permanent income) will be less than his current income. This theory is related to the study as it presents the relationship between deposit (saving) and personal expected income. A decrease in expected income leads to an increase in deposits (savings).
2.4. Life-cycle hypothesis
It is an economic theory that describes people’s spending and saving habits throughout their lives. The life-cycle hypothesis posits that the main motivation for saving is to accumulate resources that can later be spent, and in particular to keep consumption at normal levels during retirement. According to the model, household savings during the active period should be positive and pensioners' should be negative, so wealth should be in the form of a hump (Modigliani, Citation1986). This hypothesis emphasized how savings could be used to transfer control gains from one life stage to another. In the first years of life, the salary is usually low compared to the last years of work. Salary typically peaks at the end of your career and then declines as you retire. Customers who want smooth usage would prefer to borrow in their early low-income years, repay those loans, build wealth in their high-income years, and then spend accumulated savings in retirement. This theory is related to the study as it depicts the relationship between deposits (savings) and personal income. According to the model, saving should be positive for active (high-income) households and negative for retiree (low-income) households, at your current or projected future income level.
2.5. The classical theory of interest
According to the classical theory of interest rate, the rate of interest rate is determined by the intersection of demand for money and supply of money. Interest is the price of investment because firms borrow money for investment. Thus, households save their money to earn interest. According to this theory, a high-interest rate leads to high savings, and a low-interest rate leads to low savings. Thus, saving is directly (or positively) related to the interest rate. Firms’ demand for investment is fulfilled by households’ savings. Thus, the interest rate in the goods market is determined at the point where both supplies of saving and demand for investment crosses each other or intersect each other. In classical theory, saving is an increasing function of the rate of interest. This theory is related to the study as it presents the relationship between deposit and interest rate. As deposit interest rate increase leads to increase in deposit. From the above theories, one can hypothesize the following research hypothesis:
2.6. Deposit interest rate
The deposit interest rate is the rate paid by financial institutions to deposit account holders, or the expected return for the depositor. The main focus of every financial system is the financial intermediary, that is, mobilizing financial resources from the surplus sector and lending to the deficit outlets to facilitate business transactions and economic development based on the monetary and fiscal policy of the nation (Tenaye, Citation2019). The reason for getting the deposit from the surplus sector is the interest payment, which must be reasonable and acceptable to the owner of the money. The classical theory of interest, otherwise called the demand and supply theory of interest, maintains that the rate of interest is determined by the demand for and supply of funds by businessmen and households, respectively. The supply of funds is governed by time preferences, and the demand for capital is determined by the expected productivity of capital.
The life-cycle theory presented that the net impact of the real interest rate on savings is vague. The net impact of the real interest rate on savings can be decomposed into two impacts. The substitution impact infers that a higher interest rate increases the current price of consumption relative to the future cost and thus affecting savings positively. The other effect, which is called the income effect, demonstrates that if the household is a net moneylender, an increase in the interest rate will increase lifetime income, and so increase consumption and diminish saving. Subsequently, it is anticipated that the interest rate will have a positive impact on the savings ratio only when the substitution effect dominates the income effect. In developing countries where financial markets are still not well developed, the substitution effect is anticipated to be much greater than the income effect, and hence the real interest rate is likely to have a net positive impact on household savings. Deposits are more interest rate-sensitive, and banks may choose to increase investments in interest rate-sensitive assets and to decrease investments in loans (Betubiza & Leatham, Citation1995). Hence, it can be hypothesized that
H1: Deposit interest rate has positive and significant impact on non- public commercial banks deposit mobilization
2.7. Branch expansion rate
The availability of banking services in a country can be measured by the total number of bank branches. The good bank site occupies in the ability of the positive impact in attracting deposits. This is due to the difficulty of movement of people from one place to another and the difficulties they face in traffic, distinct positions available and free for customer service. Branch banking is the operation of storefront locations away from the institution’s home office for the convenience of customers. Therefore, it can be hypothesized that:
H2: Branch expansion rate has positive and significant impact on non- public commercial banks deposit mobilization.
2.8. GDP growth rate
According to the Bureau of Economic Analysis (BEA), gross domestic product (GDP) is the value of goods and services produced by the country’s economy minus the value of goods and services used in production. GDP is also the sum of personal consumption expenditure, private gross domestic investment, net exports of goods and services, and government consumption (Dynan & Sheiner, Citation2018). Various economic theories and empirical evidence show that increasing people’s incomes in has a positive impact on their ability to save. According to (Abou El-Seoud, Citation2014), the real GDP growth rate has a positive and significant effect on the country’s national savings. The basic premise of the life-cycle theory of saving and consuming predicts that changes in an economy’s growth rate will affect its overall saving rate. In the simplest version of the model, where the young save for retirement and the older use up their previously accumulated wealth, an increase in economic growth leads to an increase in the overall saving rate. It increases the lifetime resources (and savings) of younger age groups compared to older age groups. Therefore, countries with a better GDP growth rate are expected to have higher savings rates than countries with lower GDP growth rates. The GDP growth rate is expected to be positively correlated with the growth of private bank deposits. As a result, it can be hypothesized that:
H3: GDP growth rate has positive and significant impact on non-public commercial banks deposit mobilization.
2.9. Customer growth rate
Customer growth rate reflects how you are doing as a company and what you are providing to your market is something that is growing in demand. According to (David & Yi, Citation2019), customer growth rate is the speed at which you gain new customers over defined periods of time. Growth rate is usually measured with a monthly period. But in this study, the customer growth rate of selected private banks of Ethiopia will measure in yearly period. Customers are the most important factors who play a crucial role in the growth of banks deposit.
According to (Vuong et al., Citation2020), customers experience is complicated shopping process when they make a decision to select a suitable service to satisfy their demand. The process of selection, usage, and evaluation of banking services usually consist of three different stages: the pre-purchase stage, the service implementation, and the post-purchase stage. The period of pre-selection to open a savings deposit account, the perception of demand: practical considerations when you are selecting a bank such as how can this idle money be the safest to earn the highest profit? Which is the most suitable category to invest in? Searching data: figure out information to invest your idle money. Which bank should you select if you decided to open a savings account? Why choose this bank to deposit and not another bank? Banking evaluation and selection: the subjective perception of the customer has a significant impact on the bank selection to open a deposit account (Vuong et al., Citation2020). Although customer growth rate affected by different factors, such as interest rate and bank promotion, their effect on deposit growth rate is very critical. Therefore, it can be hypothesized that:
H4: customer growth rate has positive and significant impact non- public commercial banks deposit mobilization.
2.10. Life expectancy rate
Life expectancy refers to the number of years a person is expected to live, based on statistical averages. In mathematical terms, life expectancy refers to the expected number of years that a person of a given age has left (Mandal, Citation2014). According to (Mandal, Citation2014), the life expectancy of a given person or population depends on several variables, such as their lifestyle, access to health care, nutrition, economic situation and relevant mortality and morbidity data. However, since life expectancy is calculated based on averages, a person can live many years more or less than expected. The expected length of retirement increases as the survival rate increases. In this way, individuals will consume less and save more during their working years to support more expected years of consumption and greater savings in retirement. The life cycle theory of saving and consumption also predicts that the use in a certain period of time and thus the decision to save depends on income expectations throughout life. According to this hypothesis, a person’s life is divided into a working period and a retirement period. People are expected to be net savers during working hours and abstain during retirement. Against this background, growth in life expectancy will increase the overall saving rate as it increases. Lifetime benefits and mutual funds of younger age groups compared to older age groups. As a result, it can be hypothesized that:
H5: Life expectancy rate has positive and significant impact non- public commercial banks deposit mobilization.
2.11. Capital adequacy
Capital performs a crucial position in improving banks’ overall performance and making sure its persisted company lifestyles considering ok capital will impel the financial institution closer to effectiveness and performance in addition to diversification of its property. It guarantees the safety of clients deposits, secures the shareholder’s fund, improves public self-assurance, and ensures the regulatory government that the monetary machine is secure. The capital adequacy ratio (CAR) is a dimension of a financial institutions where capital is expressed as a percent of a financial institution’s danger-weighted credit score exposures. The capital adequacy ratio, additionally referred to as capital-to-danger weighted property ratio (CRAR), is used to shield depositors and sell the staleness and performance of monetary structures across the world (Nkechi & Oluchi). Distinct literature use distinct dimension to the degree of capital adequacy of financial institution. For example, (Hambissa, Citation2014) and (Vodová, Citation2011), degree of capital adequacy because the ratio of general capital of the financial institution to its general asset. According to (Firdawek, Citation2019), capital adequacy is measured because of the ratio of capital of the financial institution to its mortgage and boost. So, the researcher used capital to mortgage and boost ratio to degree of capital adequacy of personal industrial financial institution. Different research concluded that capital adequacy has bad and insignificant impact on deposit boom of personal industrial financial institution. The look performed by (Dereje, Citation2017) suggests that capital adequacy has bad and statistically insignificant effect on Bank’s deposit. In the research performed by (Firdawek, Citation2019; Jembere, Citation2014) this explanatory additionally had bad and statistically insignificant impact on deposit boom of personal industrial financial institution. Based on the above literatures the researcher of this study draws the following hypothesis:
H6: Capital adequacy has negative impact on deposit mobilization of non- public commercial banks
2.12. Profitability
Profitability is a company’s ability to use its resources to generate revenue in excess of its expenses. In other words, this is a company’s ability to generate profits from its operations. Bank’s profitability can be measured in different ways, some literatures use return on capital, some literature also uses return on capital and others use interest margin to measure profitability of private commercial banking. Knowing the profitability of the bank from its own capital, the researcher used return on investments to measure the profitability of private commercial banks in Ethiopia. According to (Erna & Ekki, Citation2004), there is a long-term relationship between commercial bank deposits and bank profitability. Their co-integration test shows that the number of Islamic bank branches and the profit-sharing rate significantly affect the volume of long-term deposits. The other studies conducted by (Dereje, Citation2017; Firdawek, Citation2019) show that profitability has a positive and statistically non-significant impact on the deposit of the bank. They also explain that furthers is a positive sign of the coefficient, which indicates a direct relationship between the bank’s profitability and the deposit. On the other hand, the result of the regression of (Tenaye, Citation2019) shows that profitability has a significant and negative impact on private commercial bank deposit growth. Therefore, it can be hypothesized that:
H7: Profitability has positive effect on deposit mobilization of non- public commercial banks.
2.13. Research Methods
The main objective of this study was to examine Mebratu-B-PLC Theory Implication on developing Country’s oxygen of Bank, positivism knowledge claim, quantitative research approach and causal (explanatory) research design would be used. The study covered all non-public commercial banks which are established and operate in Ethiopia and also have a minimum of 10 years of financial data at the time of data collection on variables desired to investigate. Since out of 16 non-public commercial banks of Ethiopia, the following 10 non-public commercial banks have the age of eleven years and above. Due to this reason, the researcher used a purposive sampling technique to select those ten non-public commercial banks (see for more detail).
Table 1. List of sampled non-public commercial banks
A secondary source of data, which collected from the annual report of selected non-public commercial banks, annual report National Bank of Ethiopia, Central statistics Agency and World Development Indicators (WDI) from the year 2011 up to 2021 G. C. To achieve the objectives of the study, the researcher applied both descriptive and inferential analysis based on 10 years (2011–2021) panel data.
2.14. Variable measurement and model specification
The dependent variable in this study was the logarithmic form of deposit mobilization expressed as deposit growth rate, and the independent variables of this study were capital adequacy, life expectancy rate, deposit interest rate, customer growth rates, RGDP growth rate, branch expansion rate and profitability (see for more detail).
Table 2. Description of the variables, their expected relationship and Sign
In this study, the investigator chose to use the Ordinary Least Squares (OLS) panel technique. The OLS method is commonly used to estimate the parameter of a linear regression model. OLS estimators minimize the sum of squared errors (a difference between the observed values andthe predicted values). The choice of this technique was based on the response variable (dependent) and the intent of the researcher. The response variable is a continuous variable and the researcher’s intention is to minimize the sum of squared errors. Then, the appropriate estimation method is the OLS technique. The other reason for using this technique is its computational simplicity. Therefore, the proposed regression model is specified as follows:
logDGRit = αi +β1*BRit + β2*IRit—β3*GDPit+ β4*LERit—β5*REit+ β6*CGRit + β7*CAPit+ εit
logDGR = log of Deposit growth rate
αi = Coefficient of constant term
β1 = Coefficient of branch expansion rate
β2 = Coefficient of interest rate
β3 = Coefficient of real GDP growth rate
β4 = Coefficient of life expectancy rate
β5 = Coefficient of Return on equity
β6 = Coefficient of customer growth rate
β7 = Coefficient of capital adequacy
i = 1 … 2 … 10 (non- public commercial banks of Ethiopia)
t = 1 … 2 … 10 years (2011–2021 years)
ε = the error term
3. Results and discussions
Descriptive statistics
The dependent variable used in this study was bank deposit growth rate, and the explanatory variables were capital adequacy, profitability, life expectancy rate, deposit interest rate, customer growth rates, branch expansion rate, and GDP growth rate.
As shown in Table below, the mean value of the non-public commercial banks’ deposit growth rate was 31.28% for the period of 2011–2021. This implies that private commercial banks achieved 31.28% of average deposit growth rate during the given period of time. It was additionally noticed that the bank deposit growth was fluctuating between 5.2 and 85.9%. The standard deviation for the bank’s deposit growth was 17.3%. This confirms that there were low varieties of deposit growth among non-public commercial banks during the study period. Because the standard deviation for the bank’s deposit growth was below the mean. The average of customer rate was 28.61%, and there was medium dispersion of customer growth rate its mean value among banks that is shown by the standard deviation of 26.4%; most values of customer growth rate was 2.2 that was terribly way on top of the standard, whereas the minimum value was 0.0001%, which was additionally far below the standard. This means that there have been some business banks in Ethiopia having higher customer growth rate and there were some banks having lower deposit growth rate around 0.01%. This could result from lack of awareness, restricted accessibility of the bank to the foremost public of the county. The typical value of lifetime rate of Ethiopia was around 0.94% variance always expectancy rate was 0.36%, this suggests that there was also very little volatility of every observation of life expectancy rate from its average throughout 2011–2020. The most and minimum value of life expectancy rate for the last 10 years was 1.6% and 0.5%, respectively. The typical value of branch enlargement rate of these the sampled non-public business banks for the last 10 years was 25.59% and the commonplace deviation of 14.38%. This means that there have been variations of every observation from its average of branch enlargement rate. The most branch expansion rate was 76 p.c that was occurred in 2018 by Zemen bank whereas the minimum branch expansion rate was of 0.024 or 2.4% was occurred in 2019 by Dashen bank. The mean value of gross domestic product rate of Ethiopia was around 9.36% variance for GDP growth rate was 1.15%, this suggests that there was also very little volatility of each observation of GDP growth rate from its mean value throughout 2011–2021. The maximum and minimum worth of gross domestic product rate for the last ten years was 11.4% and 7.7%, respectively. In alternative words, this is often a company’s capability of generating profits from its operations.
Table 3. Summary of descriptive statistics of variables
During this study, bank’s profitability measured victimization come back on equity. The typical value of return on equity was recorded as 22.57%. The quality deviation was 8.2 that was off from the mean, which means that there was less volatility on return on equity among those sampled business banks. The most and also the minimum quantity of come back on equity were 42.43% and −14.14%. Each of the maximum and the minimum value of return on equity were recorded by Zemen bank in 2012 and 2011, respectively. The typical value of capital adequacy quantitative relation was 0.298 and the variance of 0.091 means that there have been variations of every observation from its average of capital adequacy ratio. The most capital adequacy ratio was 0.581 that was occurred in 2011 by Oromia international bank, whereas the minimum capital adequacy ratio was 0.149 which occurred in 2020 by flooded international bank. Finally, because on top of table portrays the average, the minimum and also the most deposit rate of interest was 5.6%, 5%, and 7%, respectively and its variance was 0.9211%. The volatility of interest rate was terribly minimal. This shows that the government manage the interest rate, therefore those nonpublic banks.
3.1. Classical linear regression model assumptions
3.1.1. Test for normality
The classical normal linear regression model assumes that each ui is distributed normally with zero mean and constant variance (Damodar N, 2004). There are several methods of assessing whether data are normally distributed or not. Among those methods, the researcher used Jarque-Bera test due to its well knowingness. According to this method, if the probability value (p value) for Jarque-Bera test is less than alpha of 0.05, the Jarque-Bera test will be statistically significant, and the null hypothesis will be rejected in favor of the alternative. Rejecting the null hypothesis implies that the residuals are not normally distributed, the inverse is also true. The following are the two hypotheses for this test (see for additional evidence).
Ho: The residuals are normally distributed
Figure 1. Normality test for residuals.
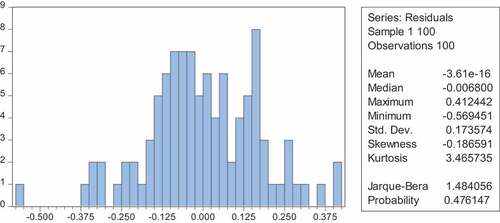
The researcher performed normality test using eview10 software as follows:
Based on the above figure, the normality test of this study shows the probability value (p value) for Jarque-Bera test greater than alpha value of 0.05, its skewness is between −1 and +1, and its kurtosis is close to 3, this shows that the residuals were normally distributed.
3.1.2. Test for heteroscedasticity
The homoscedasticity assumption of classical regression model states that the variance of the unobserved error, u, conditional on the explanatory variables, is constant. Homoscedasticity fails whenever the variance of the unobserved factors changes across different segments of the population, where the segments are determined by the different values of the explanatory variables (Wooldridge, Citation2015). Even if there are numerous methods to detect the existence of heteroscedasticity, the researcher used Breusch-Pagan-Godfrey test.
Ho: There is no heteroscedasticity in the model
As displayed in the above Table , both the F-statistic and Prob chi-square test statistics provided the same conclusion that there is no significant evidence for the existence of heteroscedasticity. The F-statistic Prob. Value of 0.093 and the Prob. Chi-Square value of 0.095 indicate that there was homoscedasticity in the model. Since the p-values in all of the cases were over 0.05, the null hypothesis of homoscedasticity is failed to reject at 5% of significant level.
Table 4. Heteroscedasticity Test
3.1.3. Test for multicollinearity
The term multicollinearity refers to the existence of a “perfect,” or exact, linear relationship among some or all explanatory variables of a regression model (Damodar, Citation2004). Classical linear regression analysis assumes that there is no perfect or exact relationship among exploratory variables. In regression analysis, when this assumption is violated, the problem of multicollinearity occurs. See for more detail.
Ho: There is no Multicollinearity in the model
Table 5. Multicollinearity test
The result of the test for the presence of multicollinearity between independent variable is displayed as follows:
According to (Daoud, Citation2017), in order to say no multicollinearity among explanatory variables, variance inflation factor should be less than 10 and tolerance value should be greater than 0.1 or 10%.Based on the above benchmark, the maximum variance inflation factor was 2.58. And the minimum tolerance value was 0.387, additionally the average variance inflation factor was 1.72, which was very minimal. This indicates that there was no multicollinearity problem among explanatory variables.
3.2. Test for model specification:—Ramsey reset test
In statistics, the Ramsey Regression Equation Specification Error Test (RESET) is a general specification test for the linear regression model. More specifically, it tests whether non-linear combinations of the fitted values help explain the response variable (see for more detail). The intuition behind the test is that if non-linear combinations of the explanatory variables have any power in explaining the response variable, the model is mis-specified in the sense that the data-generating process might be better approximated by a polynomial or another non-linear functional form (Ramsey, Citation1974).
Table 6. Ramsey Reset Test
Ramsey Reset test is also known as a test for model specification. Since, it is helpful to test whether there are or not any overlooked factors within the model.
Ho: There is no misspecification in the model
The following table shows Ramsey Reset Test for model specification.
As presented in the above table, the probability value of t-statistic, F-statistic, and Likelihood ratio were insignificant, which are 0.594, 0.594, and 0.576, respectively. This implies that accept the null hypothesis which says There is no misspecification in the model or there is omitted variable in the model. From this we conclude that, the model was correctly specified or there was no specification error in the model.
3.3. Test for serial correlation
The term autocorrelation can be defined as “correlation between members of observations ordered in time (as in time series data) or space as in cross-sectional data” (Gujarati & Porter, Citation1999). Serial correlation (also called Autocorrelation) is where error terms in a time series transfer from one period to another. In other words, the error for one-time period is correlated with the error for a subsequent time period. The researcher used Breusch–Godfrey LM test for testing the existence of serial correlation with in error terms.
The Breusch–Godfrey test is a test for autocorrelation in the errors in a regression model. It makes use of the residuals from the model being considered in a regression analysis, and a test statistic is derived from these.
Ho: There is no serial correlation with in errors term in the model
Based on the preceding table the Breusch-Godfrey Serial Correlation LM Test of F-statistic prob. Value was 0.118 and its probability of chi-square was 0.103. This indicates that the absence of serial correlation with in errors term in the model. So, fail to reject null hypotheses which says, there is no serial correlation with in errors term in the model. See for more detail.
Table 7. Breusch-Godfrey Serial Correlation LM Test
3.4. Correlation matrix
Correlation is degree in which two or more variables are related to each other. The sample size is the basic component to decide whether or not the relationship coefficient is distinctive from zero/statistically critical. The values of the relationship coefficient are always between −1 and +1. A relationship coefficient of +1 demonstrates that the two factors are perfectly related in a positive linear form; whereas a relationship coefficient of −1 shows that two factors are perfectly related in a negative direction. A relationship coefficient of 0, on the other hand demonstrates that there’s no direct relationship between two variables). The following predicts the likely relationship among variables within the study.
The correlation matrix within Table demonstrates that a positive relationship within the log form of deposit growth rate (dependent variable) and explanatory factors (branch expansion rate, customer growth rate, life expectancy rate, return on equity and interest rate) on the other hand there was a negative relationship among the log form of deposit growth rate and the explanatory variables GDP growth rate and capital adequacy.
Table 8. Correlation matrix
3.5. Testing for stationary
Unit root tests are tests for stationarity in a time arrangement. A time arrangement has stationarity if a shift in time doesn’t cause a change in the shape of the distribution; unit-roots are one cause for non-stationarity. Applications of panel unit root tests have become commonplace in empirical economics, yet there are ambiguities as how best to interpret the test results (Pesaran, Citation2012).
In this study the researcher used Levin, Lin & Chu method to test whether there was unit root or not. According to this test method, the acceptance of the null hypothesis recommended that there is a common unit root. On the other way, the acceptance of the alternative hypothesis indicates that unit root does not exist.
Ho: There is unit root in the model
The logarithmic values of the panel data of deposit growth rate and age of each sampled banks were taken before Ordinary Least Square (OLS) techniques are used for estimating a model. The logarithm is used in the model in order to transform the nonlinear data into linear form.
Table displayed the results of Levin, Lin & Chu panel unit root test. It is shown that the logarithmic form of deposit growth rate, customer growth rate, life expectancy rate, return on equity, GDP growth rate and branch expansion rate were stationary at level. Whereas, capital adequacy and interest rate were stationary at first difference and second difference respectively Here it is observed that the probability values of t statistic for all the variables are very low and accordingly the null hypothesis is rejected for all variables at 5% level of significance. Therefore, the results of the Levin, Lin & Chu test suggested that all the variables are stationary.
Table 9. Unit root test
3.6. Results of regression analysis
Table shows the results of the regression of the panel multiple linear regression model which examine the impact of firm-specific factors and macroeconomic factors on the deposit growth (as measured by banks deposit growth rate) of non- public commercial banks in Ethiopia. The analysis was based on the data collected from annual financial report of each sampled non- public commercial banks of Ethiopia, world bank data and national bank of Ethiopia annual report.
Table 10. Panel least square regression analysis
3.6.1. Operational model
Panel regression model used to estimate the statistically significant determinants of Ethiopian non- public commercial banks deposit growth was:
logDGRit = αi +β1*BR it+ β2*IRit—β3*GDPit+ β4*LERit—β5*REit+ β6*CGRit + β7*CAPit+ℇit
where as
logDGRit = the logarithm form of deposit growth rate
αi = the constant term
BR = branch expansion rate of each non- public commercial banks
IR = minimum deposit interest rate
GDP = growth domestic product growth rate of Ethiopia
LER = life expectancy rate of non- public commercial banks Ethiopia
RE = return on equity
CGR = customer growth rate of each non- public commercial banks
CAP = capital adequacy ratio
ℇit = error term
Based on the above regression result the case and effect relationship among dependent(logdgr) and explanatory variables (br, cgr, cap,gdp,ler,ir and RE) was displayed as follow.
LOGDGR = −1.276 + 0.477*BR + 0.795*CGR + 9.976*IR + 23.106*LER—4.932*GDP—0.203*CAP+0.511*RE is
3.7. Branch expansion rate on deposit growth rate
The result in Table indicates that bank branch expansion rate was statistically significant at 5% significant level and has positive impact on bank deposit growth rate. A one-unit increment in branch expansion rate cases a 0.477 -unit increment in deposit growth of non-public commercial banks other things remain constant. This result contradict the argument of (Islam et al., Citation2019),which says bank branch expansion has negative impact on deposit growth. On the other side, this finding supports the result of (Dereje, Citation2017; Fekadu, Citation2019; Firdawek, Citation2019; Okere & n.d.ugbu, Citation2015; Simeon & Yidnekachew, Citation2017; Sisay, Citation2013; Zewde et al., Citation2018) which says branch expansion has a positive and significant impact on deposit growth of non- public commercial banks. From this we can conclude that branch expansion had different impact across country, i.e., in Ethiopia branch expansion had positive and significant impact on deposit growth rate of non-public commercial banks. But, in other country like Bangladesh branch expansion had negative impact on non- public commercial banks deposit growth. Therefore, in general, null hypothesis has been accepted and concluded that bank branches expansion had a positive causal effect on the growth of non-public commercial banks deposit; meaning that branch expansion is one of the major factors that non- public commercial banks can use to achieve deposit growth with a proper management of it.
3.8. Customer growth rate on deposit growth rate
The regression result presented on Table customer growth rate was statistically significant at 5% significant level and has positive impact on bank deposit growth rate. A coefficient of customer growth rate 0.449 implies, a one-unit increase in customer growth rate leads to a 0.449-unit increase in deposit growth rate. As per the knowledge of the researcher, there is no supportive or contradictory literature for this result. Because this variable is the researcher’s newly added variable.
3.9. GDP growth rate on deposit growth rate
The regression result in table 4.9 indicates that GDP growth rate was statistically significant at 5% significant level and has negative impact on bank deposit growth rate. A one-unit increment in GDP growth rate leads to a 4.932 -unit decrement in deposit growth of non- public commercial banks other things remain constant. This finding was supported by (Islam et al., Citation2019),which concluded that GDP growth has a negative impact on non- public commercial banks of Bangladesh. In contrast, The regression result of (Dereje, Citation2017; Firdawek, Citation2019; KASSA, Citation2017; Morina & Osmani, Citation2019; Samantaraya & Patra, Citation2014; Simeon & Yidnekachew, Citation2017; Tenaye, Citation2019; Yakubu & Abokor, Citation2020),concluded that GDP growth has positive and significant effect on deposit growth of private commercial banks. This paper found out GDP growth has a negative impact on non- public commercial banks of Ethiopia. This is happening due to the increase in GDP growth rate of the county that may result in growth disposal income of individual. The functional relationship of disposal income, consumption and saving is displayed as follows:
Yd = C + S where Yd = disposal income of individual, C = consumption and S = saving from this functional relationship we drive saving as follow S= Yd—C.
From the above mathematical relationship even if the relationship between saving and disposal income is positive, if the increment rate of consumption was greater than the increment rate of disposal income leads to decrease saving by household. When we come back to our case, the negative relationship between GDP growth rate and deposit growth rate of the non-public commercial banks may be due to the above reason.
3.10. Deposit interest rate on deposit growth rate
This study found that deposit interest rate has a positive relationship with deposit growth of non- public commercial banks and the relationship is significant at 5% significant level. Based on the model in Table 4.9 above, a one-unit increase in deposit interest rate generates 9.976 unit increase in deposit growth of non- public commercial banks. As a conclusion, deposit interest rate significantly contributes to bank deposit growth.
This result is supported by the findings of (Boadi et al., Citation2015; Fekadu, Citation2019; Jibrin et al., Citation2014; Ongeti, Citation2016; Simeon & Yidnekachew, Citation2017) which concluded that, deposit interest rate has significant and positive effect on deposit growth of non-public commercial banks. On the other way, the result of this study contradict with the finding of (Tenaye, Citation2019) that demonstrated as deposit growth rate has negative and significant effect on non- public commercial banks deposit growth and also, contradict with the finding of (Ketema, Citation2017) that explain as deposit interest rate has positive and insignificant effect on deposit growth of non- public commercial banks.
In general, this study concluded that deposit interest rate has positive and significant effect on deposit growth of non- public commercial banks of Ethiopia. This implies that deposit interest rate is a major factor in explaining the non-public commercial banks deposit growth in Ethiopia meaning that, interest rate more plays an important role in deposit growth. In fact, there is competition between non-public commercial banks in terms of attraction using deposit interest rate. Due to this the study fail to rejected the null hypothesis, which says there is a positive and significant relationship between deposit interest rate and deposit growth.
3.11. Life expectancy rate on deposit growth rate
The panel least square regression result displayed in Table indicate that the explanatory variable life expectancy rate was significant at 5% level of significance. Which implies life expectancy rate has positive and significant effect on deposit growth of non- public commercial banks of Ethiopia. A coefficient of 23.106 interpreted as a one unit increase in life expectancy rate of Ethiopia produce 23.106 unit of non-public commercial banks deposit. Or as life expectancy rate increase by one-unit non- public commercial banks deposit will increase by 23.106 unit. As per the knowledge of the researcher there was no supportive or contradictive literature for this variable, the reason behind is, this variable was newly added variable by the researcher.
3.12. Return on equity on deposit growth rate
The result in Table indicates that return on equity was statistically significant at 5% significant level and has positive impact on bank deposit growth rate. A one-unit increment in return on equity leads a 0.510 -unit decrement in deposit growth of non- public commercial banks other things remain constant. This result support the argument of (Erna & Ekki, Citation2004) which says there is a longer positive relationship between profitability and deposit growth of commercial banks. The regression result of this study against the study conducted by (Dereje, Citation2017; Fekadu, Citation2019) that demonstrate as profitability has positive and statistical insignificance on deposit growth of non- public commercial banks . On the other way the study also contradict with the finding of (Tenaye, Citation2019) which say profitability has negative and statistical significant effect on deposit growth of non- public commercial banks. The researcher concludes that there is positive and statistical significant effect of profitability on deposit growth of non- public commercial banks. This result shows as profitability of banks increase the confidence of depositors to get their money back will increase. This push depositor to deposit the money in deposit financial institution rather than put in home.
3.13. Capital adequacy on deposit growth rate
The panel least square result of this study demonstrate that the explanatory variable capital adequacy ratio was statistically significant at 5% insignificant level had negative impact on deposit growth of non- public commercial banks in Ethiopia. This negative relationship between capital adequacy and deposit growth rate was supported by the study of (Firdawek, Citation2019). This indicated that financial fragility crowding out theories, which predicts that, higher capital reduces liquidity creation and lower capital tends to favor liquidity creation. Hence depositors will be charged a nominal fee for the intermediary service of loaning out their respective deposits. The other studies which support this relationship were (Dereje, Citation2017; Jembere, Citation2014).
4. Conclusion and implications
The panel least square regression analysis showed that, except capital adequacy all explanatory variables have significant effect on deposit growth of non- public commercial banks. Among those predictor variables which have significant impact on deposit growth, customer growth rate, branch expansion, profitability, life expectancy rate and deposit interest rate affect deposit growth of non- public commercial banks positively. Whereas, the impact GDP growth rate was negatively. The only predictor variable that has negative and insignificant impact on non- public commercial banks deposit growth was capital adequacy. Finally, the researcher concluded that, branch expansion rate and customer growth rate were the most powerful variables which affect deposit growth rate of commercial banks in Ethiopia.
Those sampled non- public commercial banks should build their image to attract to more customer. They should provide excellent services for their customers to mobilize more deposits. Therefore, they can promote their products and built brand loyalty. Because, customer growth rate is one of the most significant variables which affect their deposit growth. There researcher also recommended those non- public commercial banks to expand their branch aggressively through the country, because, as explained in the literature part of this study, there lot of unbanked population in rural area of Ethiopia. The government should give a little bit freedom for those non- public commercial banks increasing their deposit interest rate, since, this variable significantly affects deposit growth of non- public commercial banks. In addition, as the annual report of national bank of Ethiopia shows, there is great difference between deposit interest rate and lending interest. Customers cannot prefer deposit with minimum interest rate and borrow with maximum interest rate. Due to this they prefer to invest rather than deposit in the bank. At the end the researcher recommended that those non- public commercial banks should use appropriate marketing strategies to reach the right audience and to increase their deposit. These marketing may be, deliver customer service that is both friendly and educational, use multiple marketing channel to reach their desired audience and telling a good story of the bank.
Disclosure statement
No potential conflict of interest was reported by the author(s).
Additional information
Funding
Notes on contributors

Agumas Alamirew Mebratu
Agumas Alamirew Mebratu is an assistant professor at Bahir Dar University, College of Business and Economics, Accounting and Finance Department, Ethiopia. He has more than five publications. He is very interested in conducting research in finance for banks, tax, audit, and corporate governance. He is also a Member of the Crown Block Consultants Scientific Review Committee since 2017 and the International Scientific Review Board of Creative Business Consultancy since 2020
References
- Abou El-Seoud, M. S. (2014). The effect of interest rate, inflation rate and GDP on national saving rate. Global Journal of Commerce and Management Perspective, 1–21.
- Bartley, W., & Kresge, S. (1991). The trend of economic thinking (Vol. 3). University of Chicago Press Chicago.
- Betubiza, E. N., & Leatham, D. J. (1995). Factors affecting commercial bank lending to agriculture. Journal of Agricultural and Applied Economics, 27(1379–2016–113167), 112–126. https://doi.org/10.1017/S1074070800019660
- Boadi, E. K., Li, Y., & Lartey, V. C. (2015). Determinants of bank deposits in Ghana: does interest rate liberalization matters? Modern Economy, 6(9), 990. https://doi.org/10.4236/me.2015.69094
- Bogale, L. Y., Amsalu, B., & Melikamu, B. (2014). Household saving behavior and saving mobilization in Ethiopia. Ethiopian Inclusive Finance Training and Research Institute (EIFTRI).
- Byusa, M. (2016). Factors influencing savings mobilization by commercial banks in Rwanda. Strathmore University.
- Carroll, C. D., Hall, R. E., & Zeldes, S. P. (1992). The buffer-stock theory of saving: Some macroeconomic evidence. Brookings Papers on Economic Activity, 1992(2), 61–156. https://doi.org/10.2307/2534582
- Damodar, N. G. (2004). Basic econometrics: The Mc-Graw Hill.
- Daoud, J. I. (2017). Multicollinearity and regression analysis. Paper presented at the journal of physics: Conference series.
- David, M., & Yi, M. (2019). What is Growth Rate and When to Use It.
- Dereje, H. (2017). Determinants of deposit in ethiopian private commercial banks. MSc. Addis Ababa University.
- Dynan, K., & Sheiner, L. (2018). GDP as a measure of economic well-being. Work. Pap, 43.
- Erna, R., & Ekki, S. (2004). Factors affecting mudaraba deposits in Indonesia. In Working paper in economics and development studies. Padjadjaran University, Indonesia.
- Fekadu, Y. (2019). Factors affecting deposit mobilization: The case of dashenbank sc. In Addis abababranches. st. mary’s University.
- Firdawek, T. T. (2019). Determinants of Deposit in Ethiopian Private Commercial Banks. Addis Ababa Science and Technology University.
- Fisseha, T. (2011). Determinants of Commercial Banks Deposit in Ethiopia. The Department of Accounting and Finance, College of Business and Economics of Addis Ababa University.
- Friedman, M. (1957). The permanent income hypothesis A theory of the consumption function (pp. 20-37). Princeton University Press.
- Garo, G. (2015). Determinants of deposit mobilization and related costs of commercial banks in Ethiopia.
- Gujarati, D. N., & Porter, D. C. (1999). Essentials of econometrics (Vol. 2). Irwin/McGraw-Hill Singapore.
- Gunasekara, H. U., & Kumari, P. (2018). Factors affecting for deposit mobilization in Sri Lanka. International Review of Management and Marketing, 8(5), 30.
- Hambissa, J. (2014). determinants of deposit mobilization in private commercial banks of Ethiopia. St. Mary’s University.
- Harvey, C. (1996). Banking reform in Ethiopia.
- Harvey, J., & Spong, K. (2001). The decline in core deposits: What can banks do? Financial Industry Perspectives, 35.
- Islam, N., Ali, J., & Wafik, A. (2019). Determinants of deposit mobilization of private commercial banks: Evidence from Bangladesh. International Journal of Business and Management Invention (IJBMI), 8(10), 26–33.
- Jembere, H. (2014). Determinants of deposit mobilization in private commercial banks of Ethiopia. St. Mary University.
- Jibrin, M. S., Danjuma, I., & Blessing, S. E. (2014). Private domestic savings mobilization by commercial banks and economic growth in Nigeria. Beykent Üniversitesi Sosyal Bilimler Dergisi, 7(1). https://doi.org/10.18221/bujss.45210
- KASSA, A. (2017). Assessment of deposit mobilization practice: The case of bank of abyssinia sc. St. Mary’s University.
- Ketema, G. (2017). Determinants of commercial banks deposit mobilization in Ethiopia (doctoral dissertation, st. mary’s university). St. Mary’s University.
- Mandal, D. A. (2014). What is life expectancy. Internet. http://www.news-medical.net/health/What-is-Life-Expectancy.aspx
- Matusalem, S. (2020). Determinants of deposit growth: An empirical study on ethiopian private commercial banks.
- Mengestu, B. (2018). Financial inclusion in Ethiopia.
- Modigliani, F. (1986). Life cycle, individual thrift, and the wealth of nations. Science, 234(4777), 704–712. https://doi.org/10.1126/science.234.4777.704
- Morina, F., & Osmani, R. (2019). The impact of macroeconomic factors on the level of deposits in the banking sector, an empirical analysis in the Western Balkan countries. Journal of Accounting Finance and Auditing Studies (JAFAS), 5(3), 16–29. https://doi.org/10.32602/jafas.2019.28
- Nafkot, G. (2016). Factors affecting deposit mobilization in comercial bank of Ethiopia. st. mary’s university. St. Mary’s University.
- NBE. (2011). National bank of Ethiopia annual report
- NBE. (2021). National bank of Ethiopia annual report.
- Okere, P., & Ndugbu, M. (2015). Macroeconomic variables and savings mobilization In Nigeria. International Journal for Innovation Education and Research, 3(1), 105–116. https://doi.org/10.31686/ijier.vol3.iss1.304
- Ongeti, P. W. (2016). Economic determinants of savings mobilization by commercial banks in Kenya. KCA University.
- Pesaran, M. H. (2012). On the interpretation of panel unit root tests. Economics Letters, 116(3), 545–546. https://doi.org/10.1016/j.econlet.2012.04.049
- Ramsey, J. B. (1974). Classical model selection through specification error tests. Frontiers in Econometrics, 1, 13–47.
- Samantaraya, A., & Patra, S. K. (2014). Determinants of household savings in India: An empirical analysis using ARDL approach. Economics Research International, 2014.
- Schmidt, R. H., & Hryckiewicz, A. (2006). Financial systems-importance, differences and convergence. Retrieved from
- Simeon, A. Y. (2017). Factors affecting banks’Deposit growth –A case commercial bank of Ethiopia (CBE).
- Sisay, A. (2013). factors affecting deposit mobilization in private commercial banks: The case of awash international bank s.c. St. Mary’s University.
- Tenaye, G. (2019). Determinants of Private Commercial Banks’ Deposit Growth in Ethiopia. Addis Ababa University Addis Ababa.
- Vodová, P. (2011). Determinants of commercial banks’ liquidity in the Czech Republic. ratio, 50, 3.
- Vuong, B. N., Duy Tung, D., Giao, H. N. K., Dat, N. T., & Quan, T. N. (2020). Factors affecting savings deposit decision of individual customers: Empirical evidence from vietnamese commercial banks. Journal of Asian Finance, Economics and Business, 7(7), 293–302. https://doi.org/10.13106/jafeb.2020.vol7.no7.293
- Wooldridge, J. M. (2015). Introductory econometrics: A modern approach. Cengage learning.
- Yakubu, I. N., & Abokor, A. H. (2020). Factors determining bank deposit growth in Turkey: An empirical analysis. Rajagiri Management Journal, 14(2), 121–132. https://doi.org/10.1108/RAMJ-05-2020-0017
- Zewde, S., Lemie, K., & Tarekegn, G. (2018). Determinants of deposit mobilization in Ethiopian commercial banks.