
 ?Mathematical formulae have been encoded as MathML and are displayed in this HTML version using MathJax in order to improve their display. Uncheck the box to turn MathJax off. This feature requires Javascript. Click on a formula to zoom.
Abstract
Earlier studies have assumed the effect of tax systems on poverty and inequality to be symmetric by imposing linear specifications. In this study, we account for possible asymmetries by re-examining the effect of tax systems on poverty and inequality in Ghana. We rely on the Nonlinear Autoregressive Distributed Lag (NARDL) estimation techni que and time-series data from 1983 to 2016. The findings revealed that, while the nexus between tax systems and poverty is asymmetric, the reverse holds for the relationship between tax systems and inequality. Specifically, we establish that, while positive (negative) shocks in direct taxes raise (reduce) the level of poverty, the shocks in indirect and overall tax systems produce negative results. Moreover, the symmetric evidence is observed only for indirect taxes and inequality in the long-run, and the relationship is positive. We recommend for a poverty reduction strategy that is centered on tax reduction at all levels. Equally important is a policy that has a firm foundation in the indirect tax system to bridge the inequality in Ghana.
1. Introduction
Poverty and inequality continue to pose significant challenges to Africa’s development. Globally, poverty rates in most African countries are the highest, and the expectation is that these rates will generally decline to 23% by 2030. Hence, rendering global poverty an African phenomenon (Beegle & Christiaensen, Citation2019). Chen and Ravallion (Citation2013) indicate that Africa is the second most unequal continent in the World behind South America. Odusola et al. (Citation2017) also note that, out of the most unequal countries worldwide, 19 are in Africa, with 7 of the countries being outliers driving this inequality. It is in view of this that poverty and inequality reduction strategies have gained attention among governments and the development institutions in Africa.
The African narrative is applicable to Ghana. Ghana has experienced an impressive annual growth rate of 7% since 2005. But akin to many countries in sub-Saharan Africa, it continues to grapple with poverty in spite of many interventions. The challenge with poverty is that, although the country met the Millennium Development Goals (MDGs) target of halving poverty by 2015 from 51.7% in 1991 to 24% in 2013, it is undesirable, in whatever form, for 24% of the populace to live below the poverty line. Additionally, there are important disparities between urban and rural poverty levels. While urban poverty has reduced, rural poverty continues to spur national poverty. Thus, a substantial part of the populace is still under the shackles of poverty, which requires urgent redress. It is in recognition of this that Sustainable Development Goals (SDGs) aim at eradicating all forms of poverty.
Unlike poverty, where progress has been made, the inequality trajectory of Ghana shows worsening signs. The steady growth recorded has not been equally distributed across gender, localities, and quintiles. A look at the Gini index shows that inequality has risen from 37 in 1992 to 41 in 2013, and subsequently to 43.5 in 2016. Bastagli et al. (Citation2012), in an International Monetary Fund (IMF) study on inequalities, indicate that Ghana has one of the highest inequalities in Africa. The extent and height of the inequality is revealed when we analyze it from the perspective of quintiles. In 1992, the poorest share of the population had 6.9% of the country’s income. This dropped to 5.2% in 2006, holding almost half of the country’s income (Cooke et al., Citation2016). With respect to non-income measures, Cooke et al. (Citation2016) suggest that the gap between the rich and the poor with respect to child mortality doubled between 2006 and 2011. Thus, children in rich group were twice more likely to survive than those in poor group. Fosu (Citation2009) provides strong evidence that increasing inequality can have a range of negative impacts on a country’s growth and development. Bourguignon (Citation2004) has strong evidence to suggest that inequality can put a break on poverty. Informed by this, Lopez (Citation2004) indicates that interventions to mitigate the impact of inequality should be done earlier when inequality levels are low.
To proffer solutions, Lustig et al. (Citation2016) advocate that taxes be employed to reduce inequality and poverty. For instance, Fellman (Citation1976) and Jakobsson (Citation1976) both claim that taxing progressively reduces inequality. While Higgins and Lustig (Citation2016), and Enami et al. (Citation2019) confirm the poverty-reducing properties of taxes. The principal problem upon which this study was built is that, although domestic resource mobilization systems (taxes) could be adjusted and have been adjusted to reduce poverty and inequality, the data on Ghana show less than desired outcomes as far as the two measures of distribution are concerned. In the case of inequality, the data suggests that it is worsening by the day. In view of the above, the nature of the effect of tax and its composition on poverty and inequality is worth exploring.
Empirically, although studies such as Drucker et al. (Citation2017), Martorano (Citation2018), and Cornia et al. (Citation2011) have kick started the conversation in a linear setting, we posit that the impact of tax on poverty and inequality may have non-linear characteristics, which ought to be estimated using non-linear models. We justify this assertion on the grounds that while tax payments could negatively impact on net incomes and, hence, livelihoods, benefits in the form of transfers, public goods, and livelihood support projects have a positive impact on people. In view of the foregoing, the relationship may no longer be symmetric but asymmetric, and hence, non-linear. Moreover, Calhoun and Elliott (Citation2012) assert that “nearly all economic models of the macro economy are very nonlinear”. We, therefore, suggest that, for efficient and reliable estimates, non-linear models could provide a better fit and explanation. We also move away from the fixation on absolute measures and rely on both absolute and relative measures of poverty. In a bid to drive the optimum policy, we conduct a country-level study contrary to extant studies, which are dominated by multi-country evidence.
Given the research gaps highlighted above, we contributed to the extant literature in the following ways. First, the study unearths the asymmetric effect of tax systems on poverty and inequality. By doing this, it offers essential knowledge on the role of tax system shocks on poverty and inequality in a country-specific context. This is a major limitation in the existing literature, especially from a developing country perspective. We focused on Ghana as a developing country case because the high level of inequality in the country is undermining poverty reduction and there is also low tax revenue. Hence, there is a dire need for policy prescriptions to improve on the situation. Second, we examine the asymmetric effect relying on the novel NARDL estimation approach, while using ARDL as a baseline technique. The NARDL model is robust in modelling asymmetries and cointegration in small samples and in long-and short-run periods (Panagiotou, Citation2021). Third, unlike many studies that have used absolute measures of poverty, we go beyond this by relying on both absolute (poverty headcount ratio, poverty gap, and squared poverty gap ratio) and relative (Historical Human Development Index) proxies of poverty. Contemporary literature considers these measures to be holistic and comprehensive.
2. Overview of the Ghanaian economic and demographic landscape
Ghana is a country in West Africa with a population of about 30.8 million people (Ghana Statistical Service, Citation2021). It has been classified by the World Bank as a lower-middle-income country, with a gross domestic product (GDP) per capita of US$ 2,205.5 in 2020 (World Bank, Citation2022). The country’s economic performance has been recently slowed by the dampening impact of the COVID-19 pandemic, recording a growth rate of 0.5% in 2020. This was after the economy grew significantly from 3.4% in 2016 to 6.5% in 2019, representing an average rate growth rate of 6.1%. Importantly, the growth trajectory of Ghana has witnessed a structural change, with the economy moving from the agriculture sector serving as the major driver of economic growth to the service sector. Evidence suggests that, while the agriculture sector growth decreased from 40% to 20% between 1995 and 2018, the service and industrial sectors had their growth rates increased from 37% to 52% and 24% to 28%, respectively (African Development Bank, Citation2019).
The economic management in Ghana has been characterized by fiscal deficits, reduced government revenue, and high debt stock. Between 2015 and 2020, budget deficit worsened from 5.9% in 2016 to 11.7% of GDP in 2020. With higher budget deficit, the country’s debt stock continues to increase from 54.6% in 2015 to 76% of GDP in 2020 (Bank of Ghana, Citation2020). These fiscal performances have mostly been attributed to large unplanned expenditures in the years preceding elections (Alagidede et al., Citation2013). In 2020, the rise in the budget deficit was largely fueled by the ravaging impacts of the COVID-19 pandemic on the economy (Bank of Ghana, Citation2020). Low domestic resource mobilization (DRM) also poses a critical challenge to the management of the Ghanaian economy. Domestic revenue remains unimpressive in recent years as it decreased from 16% to 14.1% of GDP between 2015 and 2020 period. As a response to the low DRM, the government has introduced measures such as compulsory registration of Tax Identification Numbers, and the paperless system at the ports. On the other hand, fiscal spending has been tightened by the enactment of a law capping fiscal deficit at 5% of GDP and the establishment of the fiscal council (African Development Bank, Citation2019). Inflation has largely remained in double digits and continues to pose threats to the Ghana’s economy. For the 2015–2020 period, inflation became as high as 17.7% in 2015 and as low as 7.9% in 2019, averaging 12.1%. The exchange rate performance is predominantly characterized by depreciation of the Ghana Cedi against the US dollar, with a rise in exchange rate from GHS 3.79 in 2015 to GHS 5.76 in 2020.
Poverty rate has increased marginally in recent times from 25% in 2019 to 25.5% in 2020. The unemployment situation continues to be worse, especially among the youth. Inequality has also been on the rise since the 1990s, with significant regional disparities. Ghana currently recorded a human capital index of 0.45, which fairs well compared to neighboring countries such as Burkina Faso (0.38), Cote d’Ivoire (0.38), Nigeria (0.36), and Togo (0.43).
3. Review of literature
There is a growing number of studies in the literature devoted to understanding the impact of tax systems on poverty and inequality. Importantly, these studies have either focused on the relationship between tax systems and inequality or poverty, and in some cases, the two have been studied jointly. Beginning with the strand of literature on tax systems and poverty, DeFina and Thanawala (Citation2004) focused on 17 developed countries to examine the effect of taxes and transfers on poverty. Specifically, they estimated the poverty headcount ratio before and after the policy change, and the finding suggests that transfers by government and tax policies can reduce poverty. In Ghana, Bhasin and Annim (Citation2005) studied the effect of trade taxes on income distribution and poverty, relying on the computable general equilibrium (CGE) model. The study found that, when import taxes were replaced by the Value Added Tax (VAT), the incidence of poverty reduced while improving income distribution. On the other hand, when export taxes were replaced with VAT, poverty increased and inequality was adversely affected. This study only looked at trade taxes, for a thorough and comprehensive policy prescription,we examine all the tax systems . Adukonu and Ofori-Abebrese (Citation2016) investigated the effect of tax policies on poverty in Ghana using the Johansen cointegration technique, with time-series data from 1984 to 2013. The results demonstrated that indirect tax policies raise the level of poverty in Ghana. Direct tax policies and remittances were found to have mitigating effects on poverty. It is worthy of note, however, that this study treats all components of the tax system in one equation. The authors also used the per capita consumption level to measure poverty, which does not make the distributive and relativeness of poverty come out for measurement. We improve our study by incorporating a non-linear dimension and employ more robust poverty data.
With regard to tax systems–inequality nexus, Okner (Citation1975) is one of the early studies that started the comparison between government transfers and tax systems with respect to their ability in efficiently redistributing income. While the study acknowledged that progressive taxes redistribute income, it also commends the superiority of government transfers in income distribution. Engel et al. (Citation1999) also focused on Chile and employed data at the household level to estimate the distributional impact of variations in the tax structure on income distribution. Their study revealed that, indeed, taxes are poor in redistributing income. The study advocates for the use of expenditure targeting approach for different income groups. Following from this study, Chu et al. (Citation2000) analyzed the distribution of income in transitioning and developing countries. The study affirmed their findings that developing countries have not been able to use tax systems and transfer policies to solve inequality problems. Relying on panel data from 2000 to 2001, and fixed and random effects models, Obadic et al. (Citation2014) studied the impact of taxes on income inequality. The authors revealed that social contributions and labour taxes reduce inequality but consumption taxes have no influence in inequality reduction. Swistak et al. (Citation2015) found that indirect taxes such as VAT are regressive in Poland. The study further revealed that an attempt to promote progressivity through reduction in VAT rates was ineffective. The cost of such an exercise outweighs the small gains made. The authors recommended a broader base VAT and a more progressive income tax for redistribution.
The last strand focused on studies that jointly examined tax systems on both inequality and poverty. A notable example is the study by Lustig et al. (,Citation2016). The authors investigate how income distribution and poverty reduction has been achieved through social spending, subsidies, and taxes using the standard fiscal incidence analysis in five Latin American countries (Argentina, Brazil, Bolivia, Peru, and Uruguay). Comparatively, the findings revealed that direct taxes and cash transfers reduce poverty and inequality significantly in Argentina, Brazil, and Uruguay, but trivially in Bolivia, Mexico, and Peru. Also, in Kenya, Maina (Citation2017) examined the effect of low consumption taxes on income distribution (poverty and inequality) using ordinary least square (OLS) model. The study revealed that consumption taxes are regressive in Kenya. It also established a positive relationship between consumption taxes and GDP per capita.
The current study differs from the prevailing literature on many respects. First, we assume a nonlinear effect of tax systems on poverty and inequality. This is lacking in the extant literature. Second, we move beyond the normal non-linear treatment and test whether the relationships are asymmetric or not. Third, we relied on both income and non-income measures of poverty. Finally, we deepen our understanding by decomposing tax into direct and indirect, and also, consider the total tax effect. This should bring to fore deeper insight into the relationship.
4. Data and methodology
4.1. Data source and definition of variables
The study utilizes time-series data from 1983 to 2016 which were gleaned from various sources. Data on poverty incidence, poverty gap, GDP per capita, agriculture sector growth, Gini index, and inflation were collected from the World Development Indicators (WDI) of the World Bank. We also obtained data on tax system indicators (direct, indirect, and total taxes) from the International Center for Tax and Development’s (ICTD) government revenue database. Data on Historical Human Development Index (HHDI), total government expenditure, and minimum wage were sourced from Our World in Data (Global Change Data Lab), Ministry of Finance (Ghana), and Wage Indicator Network database, respectively. Cocoa and gold prices were taken from the database of the Bank of Ghana.
Given the aim of this study, we rely on poverty and inequality as dependent variables. Poverty is measured from the absolute and relative lenses. For absolute poverty, we use poverty headcount ratio, poverty gap, and squared poverty gap ratio (Foster et al., Citation1984). The international poverty line set by the World Bank is US$ 1.90 per day for extreme poverty. However, this study measured the poverty line by taking Ghana’s status as a lower-middle-income country into account. We, therefore, employ the poverty line applicable to a lower-middle-income country (US$ 3.20 per day). This provides a more accurate measure of the poverty status of Ghana. Although the headcount ratio is popular for its simplicity, it is deficient because it ignores the distribution of the poor, as no weight is assigned to the distance of those described as “poor” from the poverty line understudy. Thus, it describes all those below the US$ 3.2 per day poverty line as poor without any further classification. To counter the faults of the headcount ratio, we use the poverty gap (GAP) or the poverty depth. This measures the mean shortfall as a percentage of the poverty line. It looks at the average income needed to bring the poor to the poverty line. It is expressed as a percentage of the poverty line. It thus takes cognizance of how the poor are distributed. We move the distribution agenda forward by employing the squared poverty gap index (SGAP) which improves the poverty gap’s weakness of assigning even weight to the poor’s income shortfall from the line. This index amplifies poverty by revealing the poorest among the poor. The absolute measures of poverty indicated above are not without limitations. It masks a lot of the details on the level of poverty. A reduction in poverty revealed by any of these indices does not necessarily mean a reduction in the number of those who are poor. The number of poor people could be the same or increase. To counter this weakness, we also rely on the Historical Human Development Index (HHDI) as a fourth measure of poverty. This is a relative variable that is gauged as the average achievement in the following dimensions of human development: (i) having a decent standard of living, (ii) being knowledgeable, and (iii) a long and healthy life. Indeed, this measure is more robust than the Human Development Index as used by Kosack (Citation2003).
With regard to inequality, we use the Gini index computed as the area between the Lorenz curve and a hypothetical line of absolute equality, expressed as a percentage of the maximum area under the line. Here we document data limitation issues in connection with poverty and inequality variables. Since both poverty and inequality data for Ghana in the WDI are available from 1987, we lengthen these series by adjusting with per capita income to backwardly interpolate the time-series equivalent for 1983–1986. For instance, we employ per capita income because it shows a trend that depicts the general trend of poverty in Ghana (periods of high per capita income has seen reduction in poverty). Overall, the rationale for adjusting the data is to lengthen them to cover more years and also to produce robust regression estimates that meet the requirements of central limits theorem. Moreover, we also notice that the data are available on a four-year basis and, hence, we followed Senbeta (Citation2009) to use reference year’s poverty or inequality for the interval years (as average).
Our variable of interest as the main independent variable for this study is tax systems. We rely on indicators such as direct, indirect, and total taxes measured as tax as a percentage of GDP. The tax-to-GDP ratio has been used by Maina (Citation2017). Scaling tax revenues by GDP is reasonable as it provides a better gauge on the trend of taxes. Consistent with previous studies, where real GDP per capita, inequality, government expenditure, gold price, and the contribution of agriculture to growth are included in the poverty model as control variables, the inequality model also used GDP per capita, inflation, cocoa price, and minimum wage. A summarized description of all variables is provided in Table .
Table 1. Data description and sources
4.2. Model specifications
We specify two models to unravel the objectives of the study. While the first model focuses on poverty and tax systems, the second looks at inequality and tax systems. With respect to the first, the basic model employed follows the work of Datt and Ravallion (Citation1992), and Besley and Burgess (Citation2003) that underpins the growth-poverty relationship specified as follows:
where denotes the poverty indicators (poverty incidence, poverty gap, and squared poverty gap),
is the real GDP per capita,
is the error term, and ln represents natural logarithm. The growth elasticity of poverty to be estimated is given as
, which represents the percentage change in poverty associated with a change in income. We, therefore, augment Equationequation 1
(1)
(1) to include tax systems as our main variable of interest and other control variables (such as inequality, government expenditure, gold price, and agriculture contribution to growth), as shown in Equationequation 2
(2)
(2) :
where stands for tax system that includes indicators such indirect tax (IT), direct tax (DT), and total tax (TT);
is Gini index to control for inequality;
denotes total government expenditure;
is gold price; and
represents agriculture sector value additions. On an a priori level, we expect real GDP per capita to negatively relate with poverty, while a positive sign is expected between indirect tax and poverty. This is because indirect taxes are regressive in nature. We also expect a negative relationship between direct taxes and poverty. We envisage a negative relationship between direct taxes and poverty. This is due to the progressive nature of direct taxes in Ghana, suggesting that richer paying units will pay more. Lastly, we expect government expenditure to be poverty reducing because Ghana relies on natural resources to support its budget and spending decisions. We also expect the price of gold to be poverty reducing.
On the tax systems-inequality nexus, we set up a model that shares a significant resemblance with Martorano (Citation2018). The model is given as:
where and
denote their usual meaning and
is a vector of control variables (such as GDP per capita, cocoa price, minimum wage, and inflation). With regard to the tax system proxied by tax-GDP-ratio, we expect a negative relationship between direct tax system and inequality. This is mainly because direct taxes are progressive in nature. The seemingly regressive nature of indirect taxes inspires a priori a positive relationship between indirect taxes and inequality. Since indirect taxes account for a larger share of taxes in Ghana, we expect a negative relationship between the total tax system and inequality. For the control variables, GDP per capita accounting for economic growth is expected to have a negative relationship with inequality. This is because high inequality implies growth that benefits few people. In view of the significance of agriculture, especially cocoa farming in supplementing incomes in Ghana, we include the price of cocoa as another control variable and expect that a higher price per ton of cocoa will go a long way to bridge the income of those in the countryside who are often marginalized. The minimum wage is also included in line with the work of Martorano (Citation2018). This is especially important in adjusting wages of the poor to a level that can cater for their basic needs. We envisage that a higher minimum wage will lift those in the bottom half of the income ladder to catch up with those with higher earnings in terms of satisfying their basic needs. Finally, we control for inflation in agreement with Maestri and Roventini (Citation2012), and expect a negative relationship.
Incorporating the control variables, we set up our main model to be estimated as:
5. Estimation strategy
Given the aim of this study, we account for possible asymmetries in the effect of tax systems on poverty and inequality by employing the Non-Linear Autoregressive Distributed Lag model (NARDL) developed by Shin et al. (Citation2014). This approach was inspired by Pesaran and Shin (Citation1998) and Pesaran et al. (Citation2001) bounds–testing and is deemed appropriate for this study because of its capability in analyzing joint long- and short-run asymmetries. In particular, NARDL develops asymmetric cumulative multipliers that enable the tracing out of asymmetric adjustment patterns emanating from positive and negative shocks to the regressors. It has the additional advantage of correcting endogeneity and performing better in smaller samples.
We specify our model to estimate asymmetric long-run relationships as:
where is the dependent variable (in this case, poverty and inequality),
is the independent variable of interest (tax systems),
and
represent long-run asymmetric parameters, and
denotes an i.i.d process with zero mean and finite variance. It is important to note that
can be decomposed into positive and negative partial sums as a result of the positive and negative variations in the explanatory variable (Schorderet, Citation2001). The negative and positive partial sums are given as:
where and
are the positive and negative charges, which are further defined as follows:
Shin et al. (Citation2014) combined equation (5) with the ARDL (p, q) model specified in Pesaran et al. (Citation2001) to obtain the NARL (p, q) model as follows:
where and
denote order of lags for the dependent (
and independent variable (
,
, and
.
In estimating equation (9), there is the crucial need to ensure that none of the variables is I (2) to render the estimated F-statistics for testing cointegration null and void. To do so, we employed three different unit root tests: (i) Augmented Dickey Fuller (ADF) test by Dickey and Fuller (Citation1981); (ii) Phillips and Perron (Citation1988) test, which improves the weaknesses of the ADF test; and (iii) Dickey–Fuller test with GLS detrending (DF-GLS) test. These tests have a null hypothesis of no unit root in the variables. The next step involved estimating the NARDL model by relying on standard OLS technique. Following this, we tested for the presence of an asymmetric cointegrating relationship between the series (,
, and
) at levels. This was done by using the modified F–test of the bounds–testing technique developed by Pesaran et al. (Citation2001) with the null hypothesis of no long-run relation (
). Finally, we used the Wald tests to examine the existence of long- and short-run symmetries (see Appendix 1 for more details about the tests).
For comparison, we examine the symmetric effect of tax systems on poverty and inequality by relying on the ARDL Bounds testing approach developed by Pesaran et al. (Citation1996) and further modified by Pesaran et al. (Citation2001). This approach is selected because its applicability irrespective of whether the underlying regressors are purely I (0), purely I (1) or mutually cointegrated and also, because of its applicability to small sample size.
6. Result and discussions
6.1. Descriptive statistics
In this section, we start by showing the descriptive statistics of all variables employed in this study. This is presented in Table to help us appreciate the nature and pattern of the data used in the estimation of our models. For the tax system variables, we observe that average indirect taxes are higher relative to the direct taxes. These variables show a moderate standard deviation, although variability in total taxes is higher. The contribution of the agriculture sector to growth averaged 36%, while the Gini index, government spending, and poverty rate have averaged 40%, GHS 6808 million, and 61%, respectively. With respect to government expenditure, we interpret the high standard deviation to depict the current rising spate of government spending. This could be seen by comparing the minimum value, with the maximum, and the mean value. Expenditure is on a high in Ghana because of the massive infrastructure carried out in recent years and the response of the government to the COVID-19 pandemic. Ghana also experiences episodes of hyperinflation within the period under review. Five of the variables (Gini, poverty rate, poverty gap, squared poverty gap, and the Human Development Index) are all skewed to the left with the remaining being positively skewed. Government spending, Human Development Index, gold price, and consumer price index were not normally distributed. This can be seen in the Jarque–Bera probability values. For this reason we employed their natural log values in the models estimated. We record high standard deviation for GDP per capita, and cocoa prices. This is because Ghana has made progress in recording higher growth over the last decade compared to the 1990s, which has reflected in the country reaching a lower–middle–income country status.
Table 2. Descriptive statistics
6.2. Unit root test
As a pre-estimation technique, we examine the stationarity status of all our variables by conducting unit root tests. It is important to ascertain whether the variables are in conformity with the dictate of the symmetric and asymmetric ARDL models. Table shows the results from the three stationarity tests deployed for the study. We observed that none of the variables used in our models is I (2).
Table 3. Unit root tests
6.3. Cointegration results
Following the success of the stationarity test, the NARDL and ARDL models were estimated and cointegration assessed. Focusing on the NARDL model, we establish cointegration for all the models estimated. This is done with the help of the F-test for cointegration, as reported in Tables . This means that the variables will equilibrate at some point in the long-run. This is, however, not the case with the symmetric ARDL model. We observe that, while all absolute measures of poverty have a long-run relationship, the relative measure (Human Development Index) has no long-run equilibrium. Tables indicate the long-run relationship in the models.
Table 4. Long-run asymmetric NARDL results
Table 5. Long-run ARDL results
6.4. Results on effect of tax systems on poverty
In this section, we present and analyze the results of the effect of tax systems on the different measures of poverty.
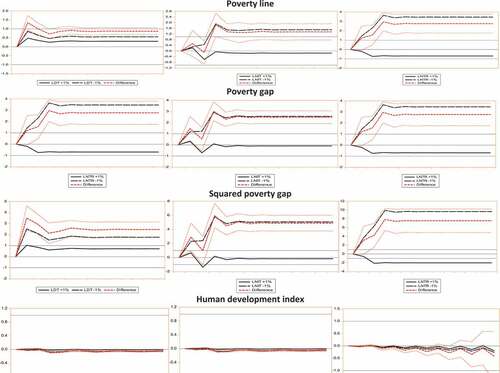
Is the relationship between tax systems and poverty symmetric or asymmetric? We resolve this question with the Wald test for asymmetry, as depicted in Appendix . The results indicate that, when the lower–middle–income poverty line is used as a measure of poverty, the model is asymmetric when the direct tax system is controlled. The model is, however, symmetric when indirect and total taxes are in perspective. This could be confirmed from the long-run NARDL results. Indirect and total taxes enter the model negatively irrespective of the mode of the shocks. Direct taxes, on the other hand, have both negative and positive shocks on poverty. Asymmetry is, however, proven in the poverty gap, and squared poverty gap models. This means that tax systems affect the very poor and the poorest of the poor differently, and hence, strategies mounted to curtail poverty should factor that in policy. Appendix displays the NARDL graphs for all the models.
6.5. Long-run results
We analyze the long-run results as presented in both the asymmetric and symmetric models in Tables , respectively. Column 1 lists the various measures of tax systems employed in our estimations. The rest of the columns details the poverty measures used in the models. The log-linear nature of the models means that the variables are interpreted as elasticities. Depending on the type of tax system we are dealing with, taxes enter the model differently. Generally, direct taxes exhibited asymmetry in all the NARDL models estimated. The positive shocks in direct taxes impacted poverty positively, and the negative shocks also impacted poverty negatively. A positive shock of 1% in direct taxes raises poverty by 0.31%, 0.36%, and 0.71% when we rely on the poverty headcount index, poverty gap, and the squared poverty gap as measures of poverty, respectively. Though positive, the effect of the positive shock on the Human Development Index is not significant. A 1% reduction in direct taxes reduces poverty by 0.55%, 0.87%, 1.75%, and 0.07% when we rely on the poverty headcount index, poverty gap, the squared poverty gap, and the Human Development Index as measures of poverty, respectively. The symmetric ARDL results do not show any significant coefficient as far as direct taxes are concerned. The results are practically reasonable, although direct taxes are progressive in nature. Positive shocks affect the earnings of all taxpayers and put lower burdens on the poor.Footnote1 It reduces the extra cedi a taxpayer may have used on consumption to meet his/her basic needs to escape poverty.
Indirect taxes generally exhibit negative effects. Thus, the positive and negative shocks produce the same outcomes. Although the signs for the negative shocks are negative, none of the models that relied on any of the measures of absolute poverty produced significant results. The human development variable demonstrates that a 1% negative shock in indirect taxes raises poverty by 0.07%. This is because indirect taxes are regressive in nature, as such increment in indirect tax systems negatively affects the poor’s income and, hence, basic need requirements more than the rich. A 1% negative shock in indirect taxes, on the other hand, reduces poverty by 1.44%, 2.53%, and 5.07% when we rely on the poverty headcount index, poverty gap, and the squared poverty gap, as measures of poverty, respectively. The coefficient of the negative shock is insignificant in the human development model, although it produced a negative coefficient. We find similar results in the symmetric ARDL model. The result generally established a negative relationship between indirect taxes and poverty in Ghana. We found that a 1% increase in indirect taxes will reduce poverty by 0.8%, 0.65%, and 1.31%. This is when we rely on poverty line, poverty gap, and squared poverty gap as respective measures of dependent variables. The negative relationship may be accounted for by the myriad of factors that are inherent in the multidimensional poverty in Ghana. Thus, the revenue generated from indirect taxes could have been used to finance public goods that improve lives and human condition in Ghana. Thus, indirect taxes may be used to finance public goods that greatly supports poverty reduction projects in Ghana. It is worth noting that, as far as the Ghanaian economy is concerned, indirect taxes manifest in the form of consumption taxes. Since consumption is required for survival, it is difficult for the poor to avoid them. In this case, it may not be cast in stone that a hike or positive shock in indirect taxes necessarily reduces poverty, but the response may be due to the individual’s inability to avoid consumption for fear of human survival. Indirect taxes in theory and practice do not inure into poverty eradication and alleviation. The probable cause for the negative relation is through the usage of indirect tax revenue, but that will be addressed by the government expenditure variable in the model.
The poverty elasticity of total tax is negative throughout all the models. Both negative and positive shocks produce negative effects on poverty in the NARDL model. The reason is that total taxes are made up of both direct and indirect taxes. It is worth noting that because revenue from indirect taxes is more than direct taxes, the effect of direct taxes on poverty is dwarfed by the strength of the indirect taxes. As indicated above, the effect of indirect taxes on poverty is mostly negative, which has been assumed by the total tax coefficients. The results indicate that a positive shock of 1% on total tax systems in Ghana will reduce poverty by 0.95%, 1%, and 1.99% when poverty headcount index, poverty gap, and the squared poverty gap are used as measures of poverty, respectively. A 1% negative shock will also reduce poverty by 3.59%, 0.71%, and 9.42% when the same indices for measuring poverty are employed. This result magnifies the weak effect of positive shocks in direct taxes on poverty in Ghana, as depicted in the NARDL model. We find similar results in the standard ARDL model. As can be seen in Table , the coefficients from the positively shocked direct models are smaller compared to the indirect tax. We, therefore, conclude that, as far as the long-run is concerned, taxes in Ghana are poverty friendly.
With respect to the other control variables, the real GDP per capita and the Gini index confirm the a priori expectation. The poverty elasticity of growth is highly elastic in both NARDL and ARDL models. From the NARDL model, a 1% rise in per capita income reduces poverty by 1.92%, 2.78%, and 4.25% when direct , indirect , and total taxes are included in the poverty line model,respectively. Similarly, a 1% increase in per capita income also reduces poverty by 2.53%, 2.41%, and 3.60% when direct, indirect, and total taxes are controlled in the poverty gap model, respectively. Growth, however, is more effective in reducing poverty in the squared poverty gap model with elasticities of 3.60%, 4.81%, and 7.20% when direct, indirect, and total taxes are controlled, respectively.
When the Human Development Index is invoked, the significance of growth in poverty reduces. It is significant in the direct tax model (0.19%) but insignificant in the indirect and total tax models. The symmetric ARDL models depict the same results generally as far as the poverty line is concerned. A 1% increase in real GDP per capita reduces poverty by 2.51%, 4.60%, and 3.49% when direct, indirect, and total taxes are included in the poverty-line model, respectively. Focusing on the poverty gap model, growth spurs poverty reduction by 4.33%, 5.97%, and 4.75% when variables on direct, indirect, and total taxes are used. The intensity of the reduction is experienced when the squared poverty gap model is employed, we realized a reduction in poverty of 8.67%, 11.93%, and 9.51% for a 1% reduction in growth. The results are generally in conformity with the work of Senbeta (Citation2009), and Ravallion and Chen (Citation1997), which implies that the growth elasticity of poverty is positive for Ghana. It is important to emphasize that economic growth is more important in lifting the poorest of the poor, as it is more efficacious in the poverty gap and squared poverty gap models looking at the magnitude of the coefficients.
The sign of the coefficient of the Gini index also resolves the old age debate about the effect of income distribution on poverty. The results generally indicate a positive relationship between inequality and poverty in Ghana. From the asymmetric models, we observe that, a 1% increase in the Gini index raises the level of poverty when direct, indirect, and total taxes are considered by 3.25%, 4.09%, and 3.43% in the poverty gap model, respectively, and by 8.19%, and 6.86% when indirect and total taxes are considered in the squared poverty gap model. In the poverty line model, the Gini index is significant when indirect taxes are considered (4.55%). We also find that when direct taxes are employed as a measure of tax systems, the sign of the inequality variable changes to negative, thereby suggesting that inequality reduces poverty. This finding may be due to the nature of direct taxes, it is progressive in nature, and hence, depresses the role of the Gini index in the model. We record a coefficient of −3.25, and −6.50 in the poverty gap and squared poverty gap models. However, the positive sign is maintained in the human development model when direct taxes are employed to measure tax system. A percentage increase in inequality raises poverty by 0.45%. However, the symmetric ARDL model records positive coefficients for the Gini index throughout the poverty models. Thus, a 1% increase in inequality raises poverty by 3.10%, 5.77%, and 4.68% when direct tax, indirect tax, and total taxes are considered. The same magnitude increase in inequality will spur growth in poverty by 6.78%, 7.13%, and 7.11% when direct tax, indirect tax, and total taxes are controlled in the poverty gap model, respectively. In the squared poverty gap model, the growth in poverty are 13.56%, 14.26%, and 14.22% when direct tax, indirect tax, and total tax are controlled, respectively. The results generally indicate that deeper inequality heightens the spate of poverty in Ghana. Thus, higher inequality only exacerbates the poverty challenge of Ghana. In this regard, a policy to tackle inequality is also a policy to tackle poverty. If the policies proffered to reduce inequality are well designed, they will contribute to growth, and hence, poverty reduction. Such policies have the potential to stimulate skills development and employment.Footnote2
On the significance of the natural resource sector to poverty reduction, we found that the sector fuels poverty in Ghana. From the NARDL model, we established that a percentage increase in the price of gold leads to 0.06%, 0.51%, and 0.81% increase in poverty levels when the poverty line variable is employed. Relying on the poverty gap variable, we observe that a percentage increase in the price of gold results in 0.54% and 0.85% increase in poverty when indirect taxes and total taxes are controlled for in the model, respectively. The same magnitude of change in gold prices triggers respective increase in poverty by 1.08%, and 1.71% when indirect taxes and total taxes are controlled in the squared poverty gap model. We also find similar signs (positive) in the standard ARDL model. Undoubtedly, Ghana is blessed with natural resources from which significant revenues in resource rent are collected for development. It is expected that such revenues will be spent on social expenditures that will reduce the spate of poverty in Ghana. However, the result points to the opposite, and a number of reasons suffice. First, it is possible that mineral revenues are not applied on pro-poor expenditures in Ghana. Unlike the petroleum sector that has a petroleum revenue management law that earmarks revenues for certain expenditures,the revenues from gold and other solid minerals are at the discretion of the social planner. It is important that revenues from gold production are applied on pro-poor expenditures to reduce poverty in Ghana. Secondly, while the Minerals and Mining Act 703 of Ghana gives a carried interest of 10% to the government on all mining blocks awarded, this is too small for windfall gains in the price of gold to make any impact on government finances. The contribution of the sector to GDP is less than 3% annually, as such, the impact on poverty is negligible. Lastly, since poverty is a multi-dimensional concept, the consequences of mining in Ghana offset the little gain it has on poverty reduction. The year 2012 witnessed increased production of gold in Ghana because of the rise of the price of gold. The windfall gains also encouraged gold production from artisanal and small-scale miners that sometimes engage in irresponsible mining with untoward effect on the environment and waterbodies that inherently have an impact on human wellbeing and hence, poverty. Cocoa farming, a venture that sustainably supports livelihoods and hence, poverty reduction has experienced some of the untoward impact of small-scale mining. According to a study by the African Center for Economic Transformation (ACET),Footnote3 cocoa farmers in Ghana are selling their farms to small-scale miners for a one-off windfall payment. This has poverty ramifications for current and future generations. Thus, the negative side effects of mining spurred by a hike in the price of gold could offset all possible positive impacts.
On the relationship between agriculture sector and poverty, we find very negligible negative effect. Our result based on the relative poverty measure (HDI) indicates that a percentage increase in the growth of the agriculture sector reduces poverty by 0%, 0.03%, and 0% when direct tax, indirect tax, and total taxes are controlled in the model, respectively. Negative effects are also recorded in the symmetric ARDL model. The results imply that any policy that targets agriculture in its current state as a tool for poverty reduction may not yield optimum policy outcomes. Government spending meets the a priori expectations, and the relationship is negative. However, the significance is felt when indirect taxes are controlled in the absolute measures of poverty. A 1% rise in government spending reduces poverty by 0.18%, 0.33%, and 0.67% when the poverty line, poverty gap, and the squared poverty gap models are employed, respectively. Although the results confirm some positive response from Ghana’s drive in social protection and poverty alleviation expenditures, they are not enough. There is the need to have a more targeted approach towards social spending items that drives down poverty.
6.6. Short-run results
The short-run dynamics of the NARDL and ARDL models are shown in Tables respectively.
Table 6. Short-run NARDL results
Table 7. Short-run ARDL results
The error correction term in the model is negative and significant at 1% level. Bannerjee et al. (Citation1998) indicated that, when the error correction term is highly significant, there is a further proof that there is a stable long-run relationship between the variables. In line with the findings of Loayza and Ranciere (Citation2006), Akmal (Citation2007), Shittu et al. (Citation2012), and Bildirici et al. (Citation2012), we find error correction terms lesser than −1 in the absolute measures of poverty. According to Narayan and Smyth (Citation2006), an error correction term that is less than −1 indicates that, instead of the model monotonically congregating directly to the long-run equilibrium path, the error correction mechanism oscillates around the long-run value in a reducing manner. Convergence to the long-run equilibrium path becomes rapid when the process ends. Thus, the high error correction terms in the absolute poverty models mean that, in the inception stages of the correction process, the model corrects itself in a fast manner, but it normalizes as the period elapses.
With respect to the variable of interest (tax systems), we find that positive shocks in direct taxes produce positive impacts in the short-run. Specifically, a 1% increase in direct taxes raises the number of people under the lower–middle-income poverty line by 0.46%. The same magnitude of change in direct taxes raises the number of people under severe poverty by 0.57%, and the poorest of the poor as indicated by the squared poverty gap by 1.14%. Focusing on the relative measure of poverty, the Human Development Index, 0.01% of the population will fall into poverty when direct taxes are increased by 1%. A negative shock in direct tax systems in the short-run produces negative effects on the level of poverty. For instance, a 1% negative shock in direct tax systems reduces the number of Ghanaians under the lower-middle-income poverty line by 0.95%, but the number of people in the gap falls by 1.25%. The poorest of the poor defined by the squared poverty gap also falls by 2.49%. Reduction in poverty is, however, marginal (0.02%) when the Human Development Index is employed. This finding is in line with both theory and practice. Increases in taxes will impoverish citizens. Thus, it reduces disposable income, which has adverse implications on meeting basic needs. Reduction in taxes, on the other hand, is good for disposable income, and basic needs satisfaction, which are important for poverty reduction.
Indirect taxes enter the asymmetric models negatively, with both negative and positive shocks resulting in poverty reduction. A 1% upward adjustment of indirect taxes reduces poverty as measured by HDI by 0.02%. The reduction in poverty has higher potency with negative shocks; 0.32% when the poverty line is in perspective, 1.15% when the poverty gap is considered, 2.30% when the squared poverty gap is used, and lastly, 0.01% when the Human Development Index is considered. The coefficients in these models also have significant implications on policy and meet the a priori expectations. A policy to reduce tax, in whatever form, should bring about some relief to taxpayers and, hence, poverty reduction. Nevertheless, this should be balanced with the need to raise revenue for government activities.
The short-run dynamics does not significantly differ from the long-run static effect. Total revenue also enters the models negatively irrespective of the shock. Positive shocks in total tax systems do not significantly reduce poverty when the absolute measures are in perspective but reduce poverty by 0.02% when the HDI is employed. A 1% negative shock in total tax, on the other hand, reduces poverty by 1.44%, 1.86%, 3.72%, and 0.01% in the poverty line, poverty gap, squared poverty gap, and human development models, respectively. The coefficients in the total tax models were reinforced and dictated by the direction of indirect tax systems. This is because revenue from indirect taxes is more than direct taxes.
Growth proxied by real GDP per capita enters the model negatively as expected. From the models, tax systems are not significant in the short-run when direct taxes are controlled using the absolute measures of poverty. However, a 1% increase in indirect and total tax systems will reduce the number of Ghanaians under the poverty line by 2.29% and 2.38%, respectively. The same magnitude reduces the number of Ghanaians, who are severely poor by 2.95% and 2.75%, and the poorest of the poor by 5.90% and 5.497%. Considering the relative measure of poverty, a unit percentage increase in direct, indirect, and total taxes reduces poverty in Ghana by 0.02%, 0.04%, and 0.05%, respectively. This empirical evidence suggests that growth in Ghana has been pro-poor in the short-run. Thus, the short-run growth of poverty is highly elastic.
Inequality coefficients were also consistent with the long-run coefficients. When direct and indirect taxes are controlled in the models, inequality is seen to be positively related with poverty. A percentage increase in the Gini index raises poverty by 17.04%, 21.05%, and 42.10% in the poverty line, poverty gap, and the squared poverty models in the short-run when total taxes are controlled. Inequality is, however, not significant in the poverty models when indirect taxes are controlled. The multidimensional poverty measured by the HDI reduces marginally when direct taxes are controlled.
The natural resources sector represented by the price gold, as in the long-run model, enters the model positively. This means that revenues from the sector to the government, artisanal miners, and mining in general do not have poverty reduction tendencies in Ghana. The sector is actually promoting poverty. This may be due to the negative impact mining (both large scale and small scale) has on mining communities. The negative impact on health, livelihoods, farming, and the environment could spur poverty in those areas. The foregoing is practically visible in many mining communities, as after many years of mining those communities have little to show in terms of progress. The gains are short lived, but the negative impacts have lifelong implications.Footnote4
We also realize that agriculture sector’s productivity in the short-run does not support poverty reduction when we account for direct taxes. Indeed, it does not support the a priori expectation. The explanation is forthright and empirical literature exist to explain the phenomenon. Christiaensen et al. (Citation2006) argue that the direct impact of agriculture on poverty in sub-Saharan Africa is negligible. The direction of the effect is through the linkages that it has with other sectors (indirect sector). It is also possible that the poor, the deeply poor, and the poorest of the poor do not have farmlands and farm assets for agriculture. Moreover, the subsistence nature of agriculture in Ghana suggests that the sector might not hugely contribute to poverty reduction. Hesselberg (Citation2017) indicate that, if farming continues to remain at the small-scale level, it will fail to eradicate poverty. We also observe that the short-run dynamics of government expenditure has no effect on poverty. It only supports poverty reduction when the HDI is in perspective.
6.7. Results on tax systems and inequality in Ghana
We then present the cointegration and long-run results on tax systems–inequality nexus based on the asymmetric and symmetric ARDL models. We complete this section by presenting short-run dynamic ARDL results for the selected models.
6.8. Long-run results
The results of the long-run NARDL and ARDL models, as well as the tests for cointegration are shown in Tables . We establish strong evidence for cointegration in both the ARDL and NARDL models except when direct tax is employed as a measure of the tax system.
Table 8. Long-run NARDL results
Table 9. Long-run ARDL results
Is the relationship between tax systems and inequality asymmetric? We resolve this question with the Wald test for asymmetry. Based on our decision on the F-statistics, as depicted in the last role of Table , we discover no asymmetry in the relationship when all the tax system variables are controlled. We, therefore, rely on the symmetric ARDL model in Table for the long-run relationship.
From Table , we find that, cocoa price, growth, direct and total taxes cannot explain the level of inequality in Ghana in the long-run. On an a priori level, we expected direct taxes to be negatively related to inequality, as depicted in the model. This is insignificant because, although it reduces inequality because of its progressive nature, it is paid by a small percentage of the population, which makes it a small fraction of the overall tax revenue. It is, therefore, not enough to significantly reduce the level of inequality in Ghana. On indirect taxes, a percentage increase in indirect taxes raises the level of inequality by 0.08%. This finding is in agreement with the a priori expectation.
We find the minimum wage to be positively related to inequality. A percentage increase in minimum wage raises the level of inequality by 0.04%, 0.02%, and 0.03% when direct tax, indirect tax, and total taxes are controlled, respectively. This finding is against the a priori expectation. The reason for this narrative is because minimum wages are so low that upward adjustments do not alter the earnings of people in Ghana. Thus, the minimum wage exists only in theory, it lacks practical relevance in Ghana. Inflation is also significant at the 1% level. A negative relationship is struck, as a 1% increase in inflation leads to negligible decrease in the level of inequality in Ghana. In theory, an increase in inflation should disadvantage low income earning individuals in society. The current revelation may be explained by the items in the inflation basket. If they are luxuries, higher inflation should not affect the poor and, hence, reduction in inequality. If, on the other hand, they are necessities, then the state of inequality will widen. However, the current findings should not lead to misguided policy debate as the coefficients, although strongly significant, are in the realms of negligible values.
6.9. Short-run results
In this section, we present the short-run ARDL results, as shown in Table . We observe that the error correction terms are all significant and negative, which indicates the presence of long-run relationship or convergence.
Table 10. Short-run dynamic ARDL results
We observe that the relationship between tax systems and inequality is a long-run phenomenon and that the short-run coefficients of all the various tax systems are insignificant. This finding also suggests that any policy that intends to rely on tax systems to address inequality should look at the long-run for results. The short-run dynamics of inflation is not different from the long-run. Inflation has a negative relationship with inequality. The coefficients are, however, negligible, and this lends credence to the fact that issues of inequality are mainly a long-run phenomenon.
6.10. Diagnostics of the models
6.10.1. Diagnostics of the poverty model
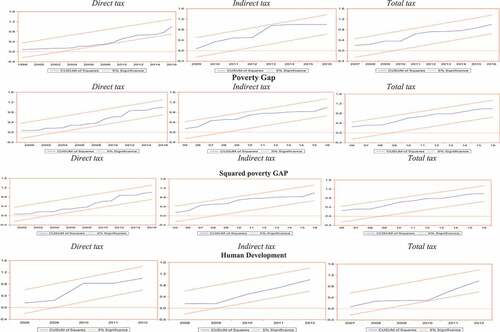
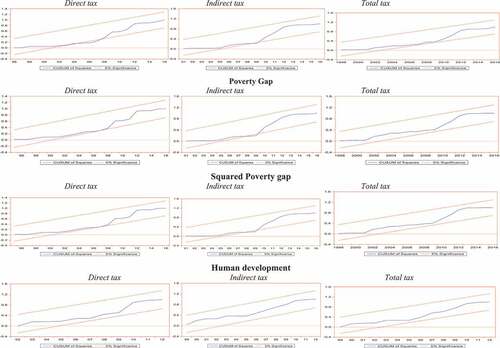
The NARDL and ARDL models’ diagnostics for the poverty model are highlighted in this section. We test for autocorrelation using the Breusch–Godfrey Serial Correlation LM Test. We also employed the Breusch–Pagan–Godfrey test for heteroscedasticity to check the condition of the variance of the error term. We confirm the normality or otherwise of the models with the Jarque–Bera normality test. Functional form of the model is tested for by the Ramsey reset test. The diagnostics confirm the absence of normality and functional form problems in the NARDL model. However, there are normality challenges in the ARDL model with respect to the relative measure of poverty (HDI). Although both the NARDL and ARDL models confirm some autocorrelation in some of the models, we avoid the challenges associated with them as we estimate all the models by the Heteroscedasticity and Autocorrelation Consistent (HAC) method. Thus, all the models are heteroscedastic and autocorrelation consistent. The standard errors estimated are thus consistent and good. The diagnostics of both the symmetric and asymmetric ARDL models are given in Table . We first present the asymmetric model diagnostics and follow them up with that of the symmetric models. We relied only on the CUSUM squared test to assess the stability or otherwise of all the models because it is more robust than the CUSUM test. The results, as depicted in Figure 1 and 2Footnote5,indicate that the NARDL models are more robust than the standard ARDL models. This is seen in the highly unstable nature of most of the ARDL models.
Table 11. Diagnostics of the NARDL and ARDL models
6.10.2. Diagnostics of the inequality model
Turning to the diagnostics of the inequality model, we estimated the models using the HAC method to arrive at standard errors that are heteroscedasticity consistent. This means that all heteroscedasticity in the original model is rendered redundant. Table provides diagnostics of the symmetric ARDL model for inequality.
Table 12. Diagnostics of the ARDL models
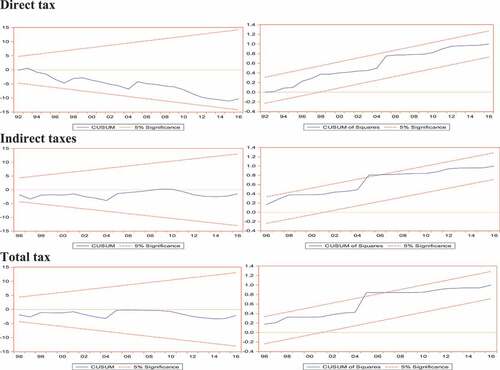
As shown in Table , the models are all normally distributed, autocorrelation free, and rightly specified in functional forms. The models, as revealed by the Ramsey’s reset and CUSUM tests,Footnote6 were all very stable.
7. Conclusion and policy recommendations
The study examined the effect of domestic resource mobilization systems (tax systems) on distribution (poverty and inequality) in Ghana. Specifically, the study investigated whether the relationship is asymmetric or symmetric. With respect to the effect of tax systems on poverty in the long-run, we found that, generally, the relationship is asymmetric when all measures of tax systems and poverty are employed. We observed that, while positive (negative) shocks in direct taxes raise (reduce) the level of poverty, the negative and positive shocks in all the other tax systems produce negative results. We also realized that negative shocks generally produce greater impacts on poverty than positive shocks. Similar findings were also discovered in the short-run dynamics. A poverty reduction strategy that looks at tax reduction at all levels should produce the desired results in the long-run. It is important to design this policy with key emphasis on broadening the tax base to reduce tax avoidance and evasion. We also realized that growth was all poverty enhancing in both the long-run and the short-run. The significance of growth to poverty, however, increases with profound poverty. Any meaningful strategy to reduce poverty must have as an anchor, a policy to promote rapid and sustained growth. It is also important that growth promoting policies are combined with policies that allow the poor to fully participate in the opportunities unleashed by the growth. We, therefore, recommend that the social planner invest in making the labour market work more efficiently, promoting gender equality, and raising the level of financial inclusion in Ghana to make growth reach the very poorest. Thus, growth must be inclusive to benefit the very poor. On the effect of inequality on poverty, we observed that inequality generally fuels poverty. The relationship is, however, reversed when direct taxes are employed as tax systems because of their distribution prowess. We, therefore, recommend that policies should be targeted at making income, and asset distribution more equitable to provide the poor with significant opportunities, and means to improve their living standards, and hence, reduce poverty.
The study revealed that the relationship between the tax systems and inequality is rather symmetric, not asymmetric. While cointegration exists for the symmetric relationship, we only found a significant positive relationship between indirect taxes and inequality in the long-run. There is no short-run relationship between tax systems and inequality. The relationship is partly due to the regressive nature of indirect taxes in Ghana. Direct taxes in Ghana are marginal enough to strike any significant impact on inequality both in the short-run and the long-run. A policy to leverage on tax systems to bridge income inequality that has a firm foundation in indirect tax systems should be pursued. The policy should thus focus on reducing the level of indirect taxes in Ghana.
The study was challenged with limited data on poverty and inequality variables. There were missing observations for the variables, which resulted in the use of interpolation to lengthen the time series. We also did not consider additional proxies for inequality due to data unavailability. Future studies can address these limitations to achieve more robust findings. More importantly, having established asymmetry in the tax systems–poverty nexus and the essential role of economic growth in poverty reduction, it is also significant that future studies concentrate on the threshold effect of economic growth in mediating the relationship between tax systems and poverty in Ghana.
Disclosure statement
No potential conflict of interest was reported by the author(s).
Additional information
Funding
Notes
1. Maboshe and Woolard (Citation2012) found progressive taxes in South Africa are borne by the top three deciles income group.
3. Refer to http://acetforafrica.org/programs/impact-of-artisanal-and-small-scale-mining-on-smallholder-agricultural/
4. Mining activities intensify with rise in the price of gold.
5. See Appendix
6. Refer to Appendix
References
- Adukonu, S. E. F. K., & Ofori-Abebrese, G. (2016). Relative impact of various taxes on poverty in Ghana. Mediterranean Journal of Social Sciences, 7(3), 150–33 doi:10.5901/mjss.2016.v7n3p150.
- African Development Bank. (2019). Republic of Ghana: Country strategy paper (2019-2023). https://www.afdb.org/sites/default/files/documents/projects-and-operations/ghana_country_strategy_2023_en.pdf#pdfjs.action=download
- Akmal, M. S. (2007). Stock returns and inflation: An ARDL econometric investigation utilizing Pakistani data. Pakistan Economic and Social Review, 45(1), 89–105 http://www.jstor.org/stable/25825305.
- Alagidede, P., Baah-Boateng, W., & Nketiah-Amponsah, E. (2013). The Ghanaian economy: An overview. Ghanaian Journal of Economics, 1(1), 4–34 https://hdl.handle.net/10.520/EJC169512.
- Bank of Ghana. (2020). Annual report and financial statements. https://www.bog.gov.gh/wp-content/uploads/2021/09/Annual-Report-2020.pdf
- Bannerjee, A., Dolado, J., & Mestre, R. (1998). Error-correction mechanism tests for co-integration in single equation framework. Journal of Time Series Analysis, 19(3), 267–283. https://doi.org/10.1111/1467-9892.00091
- Bastagli, F., Coady, D., & Gupta, S. (2012). Income inequality and fiscal policy. IMF Staff Discussion Note, 12(8), 1. SDN/12/08. https://doi.org/10.5089/9781475504828.006
- Beegle, K., & Christiaensen, L. (Eds.). (2019). Accelerating poverty reduction in Africa. World Bank Publications. https://openknowledge.worldbank.org/bitstream/handle/10986/32354/9781464814365.pdf?sequence=21
- Besley, T., & Burgess, R. (2003). Halving global poverty. Journal of Economic Perspective, 17(3), 3–22. https://doi.org/10.1257/089533003769204335
- Bhasin, V. K., & Annim, S. K. (2005). The impact of the elimination of trade taxes on poverty and income distribution in Ghana. Global Development Network. https://www.imf.org/external/np/res/seminars/2005/macro/pdf/bhasin.pdf
- Bildirici, M. E., Bakirtas, T., & Kayikci, F. (2012). Economic growth and electricity consumption: Auto regressive distributed lag analysis. Journal of Energy in Southern Africa, 23(4), 29–45. https://doi.org/10.17159/2413-3051/2012/v23i4a3176
- Bourguignon, F. (2004). The poverty-growth-inequalitytriangle (Indian Council for Research on International Economic Relations Working Paper, No. 125).https://www.econstor.eu/bitstream/10419/176147/1/icrier-wp-125.pdf
- Calhoun, G., & Elliott, G. (2012). Why do nonlinear models provide poor macroeconomic forecasts? In Seventh ECB workshop on forecasting techniques-new directions for forecasting, Frankfurt am Main, Germany (pp. 4–5).
- Chen, S., & Ravallion, M. (2013). More relatively‐poor people in a less absolutely‐poor world. Review of Income and Wealth, 59(1), 1–28. https://doi.org/10.1111/j.1475-4991.2012.00520.x
- Christiaensen, L. J., Demery, L., & Khl, J. (2006). The role of agriculture in poverty reduction: An empirical perspective (Vol. 4013). World Bank Publications.
- Chu, K., Davoodi, H., & Gupta, S. (2000). Income distribution and tax and government social spending policy in developing countries (Economics Research Working Papers 214). International Monetary Fund. https://doi.org/10.5089/9781451848281.001
- Cooke, E., Hague, S., & McKay, A. (2016). The Ghana poverty and inequality report: Using the 6th Ghana living standards survey. UNICEF.
- Cornia, G. A., Gómez-Sabaíni, J. C., & Martorano, B. (2011). A new fiscal pact, tax policy changes and income inequality (UNU-WIDER Working Paper 2011/70). https://www.wider.unu.edu/sites/default/files/wp2011-070.pdf
- Datt, G., & Ravallion, M. (1992). Growth and redistribution components of changes in poverty measures: A decomposition with applications to Brazil and India in the1980s. Journal of Development Economics, 38(2), 275–295. https://doi.org/10.1016/0304-3878(92)90001-P
- DeFina, R. H., & Thanawala, K. (2004). International evidence on the impact of transfers and taxes on alternative poverty indexes. Social Science Research, 33(2), 322–338.
- Dickey, D. A., & Fuller, W. A. (1981). Likelihood ratio statistics for autoregressive time series with a unit root. Econometrica: Journal of the Econometric Society, 49(4), 1057–1072. https://doi.org/10.2307/1912517
- Drucker, L., Krill, Z. E., & Geva, A. (2017). The impact of tax composition on income inequality and economic growth. Ministry of Finance, Isreal. https://www.mof.gov.il/en/PublicationsAndReviews/EconomicData/DocLib/Article_082017_Eng.pdf
- Enami, A., Lustig, N., & Taqdiri, A. (2019). Fiscal policy, inequality, and poverty in Iran: Assessing the impact and effectiveness of taxes and transfers. Middle East Development Journal, 11(1), 49–74. https://doi.org/10.1080/17938120.2019.1583510
- Engel, E. M., Galetovic, A., & Raddatz, C. E. (1999). Taxes and income distribution in Chile: Some unpleasant redistributive arithmetic. Journal of Development Economics, 59(1), 155–192. https://doi.org/10.1016/S0304-3878(99)00009-7
- Fellman, J. (1976). The effect of transformations on Lorenz curves. Econometrica, 44(4), 823–824. https://doi.org/10.2307/1913450
- Foster, J., Greer, J., & Thorbecke, E. (1984). A class of decomposable poverty measures. Econometrica, 52(3), 761–765. https://doi.org/10.2307/1913475
- Fosu, A. K. (2009). Inequality and the impact of growth on poverty: Comparative evidence for sub-Saharan Africa. The Journal of Development Studies, 45(5), 726–745. https://doi.org/10.1080/00220380802663633
- Ghana Statistical Service. (2021). Ghana 2021 Population and Housing Census (Volume 1). https://census2021.statsghana.gov.gh/gssmain/fileUpload/reportthemelist/PRINT_COPY_VERSION_FOUR22ND_SEPT_AT_8_30AM.pdf
- Hesselberg, J. (2017). How can poverty be reduced among small-scale farmers in the highlands of western Cameroon? Ghana Journal of Geography, 9(1), 42–66 https://www.ajol.info/index.php/gjg/article/view/154652.
- Higgins, S., & Lustig, N. (2016). Can a poverty-reducing and progressive tax and transfer system hurt the poor? Journal of Development Economics, 122(5), 63–75. https://doi.org/10.1016/j.jdeveco.2016.04.001
- Jakobsson, U. (1976). On the measurement of the degree of progression. Journal of public economics, 5(1–2), 161–168.
- Kosack, S. (2003). Effective aid: How democracy allows development aid to improve the quality of life. World Development, 31(1), 1–22. https://doi.org/10.1016/S0305-750X(02)00177-8
- Loayza, N. V., & Ranciere, R. (2006). Financial development, financial fragility, and growth. Journal of Money, Credit and Banking, 38(4), 1051–1076. https://doi.org/10.1353/mcb.2006.0060
- Lopez, J. H. (2004). Pro-poor growth: a review of what we know (and of what we don’t). World Bank. http://citeseerx.ist.psu.edu/viewdoc/download?doi=10.1.1.694.2397&rep=rep1&type=pdf
- Lustig, N. (2016). Domestic resource mobilization and the poor. World Development Report Background Paper, World Bank. https://openknowledge.worldbank.org/handle/10986/26254/112946-WP-PUBLIC-WDR17BPDomesticResourceMobilizationandPoor.pdf
- Maboshe, M., & Woolard, I. D. (2018). Revisiting the impact of direct taxes and transfers on poverty and inequality in South Africa (WIDER Working Paper. No. 2018/79). The United Nations University World Institute for Development Economics Research (UNU-WIDER)
- Maestri, V., & Roventini, A. (2012). Inequality and macroeconomic factors: A time series analysis for a set of OECD countries (Working Paper No. 34/2012). Department of Economics, University of Verona.
- Maina, A. W. (2017). The effect of consumption taxes on poverty and income inequality in Kenya. International Journal of Accounting, 5(2), 56–82 doi:10.15640/ijat.v5n2a5.
- Martorano, B. (2018). Taxation and inequality in developing countries: Lessons from the recent experience of Latin America Journal of International Development 30 2 256–273 https://doi.org/10.1002/jid.3350 .
- Narayan, P. K., & Smyth, R. (2006). What determines migration flows from low‐income to high‐income countries? An empirical investigation of Fiji–US migration 1972–2001. Contemporary Economic Policy, 24(2), 332–342. https://doi.org/10.1093/cep/byj019
- Obadić, A., Šimurina, N., & Sonora, R. (2014). The effects of tax policy and labour market institutions on income inequality. Zbornik radova Ekonomskog fakulteta u Rijeci: časopis za ekonomsku teoriju i praksu, 32(1), 121–140.
- Odusola, A. F., Cornia, G. A., Bhorat, H., & Conceição, P. (Eds.). (2017). Income inequality trends in sub-Saharan Africa: Divergence, determinants and consequences. United Nations Development Programme, Regional Bureau for Africa.
- Okner, B. A. (1975). Individual taxes and the distribution of income . In J.D. Smith(Ed), The personal distribution of income and wealth (pp. 45–74). NBER.
- Panagiotou, D. (2021). Asymmetric price responses of the US pork retail prices to farm and wholesale price shocks: A nonlinear ARDL approach. The Journal of Economic Asymmetries, 23, e00185. https://doi.org/10.1016/j.jeca.2020.e00185
- Pesaran, H. H., & Shin, Y. (1998). Generalized impulse response analysis in linear multivariate models. Economics Letters, 58(1), 17–29. https://doi.org/10.1016/S0165-1765(97)00214-0
- Pesaran, M. H., Shin, Y., & Smith, R. J. (1996). Testing for the existence of a long-run relationship ( Cambridge Working Papers No. 9622). Faculty of Economics, University of Cambridge.
- Pesaran, M. H., Shin, Y., & Smith, R. J. (2001). Bounds testing approaches to the analysis of level relationships. Journal of Applied Econometrics, 16(3), 289–326. https://doi.org/10.1002/jae.616
- Phillips, P. C., & Perron, P. (1988). Testing for a unit root in time series regression. Biometrika, 75(2), 335–346. https://doi.org/10.1093/biomet/75.2.335
- Ravallion, M., & Chen, S. (1997). What can new survey data tell us about recent changes in distribution and poverty? The World Bank Economic Review, 11(2), 357–382. https://doi.org/10.1093/wber/11.2.357
- Schorderet, Y. (2001) Revisiting Okun’s law: A hysteretic perspective (Discussion Paper No. 2001-13). University of California.
- Senbeta , A. 2009 Three Essays on Foreign Aid, Poverty and Growth. (Western Michigan University)https://scholarworks.wmich.edu/dissertations/723/
- Shin, Y., Yu, B., & Greenwood-Nimmo, M. (2014). Modelling asymmetric cointegration and dynamic multipliers in an ARDL Framework. In W. C. Horrace & R. C. Sickles (Eds.), Festschrift in honor of Peter schmidt (pp. 281–314). Springer Science and Business Media.
- Shittu, O. I., Yemitan, R. A., & Yaya, O. S. (2012). On autoregressive distributed lag, co-integration and error correction model. Australian Journal of Business and Management Research, 2(8), 56–62. https://doi.org/10.52283/NSWRCA.AJBMR.20120208A07
- Świstak, A., Wawrzak, S., & Alińska, A. (2015). In pursuit of tax equity: lessons from VAT rate structure adjustment in Poland. Financial theory and practice, 39(2), 115–137.
- World Bank. (2022). World development indicators. https://databank.worldbank.org/reports.aspx?source=world-development-indicators
Appendix 1.
Empirical Strategy (Continuation)
While the long-run symmetry test is based on the null hypothesis , the short-run also relied on either
or
. When asymmetry is established in the long-run and short-run, the cumulative dynamic multiplier effect associated with a unit percentage change of
on
and
is given as:
