
 ?Mathematical formulae have been encoded as MathML and are displayed in this HTML version using MathJax in order to improve their display. Uncheck the box to turn MathJax off. This feature requires Javascript. Click on a formula to zoom.
Abstract
This study investigates the relationship between the comprehensibility of a firm’s annual report and its stock return synchronicity in the Indian market. The study employs the readability of annual reports as a measure for the cost of information processing. The findings suggest that firms with more readable annual reports tend to display higher stock return synchronicity. This relationship implies that more legible financial disclosures are associated with more efficient and transparent capital markets. Additionally, the research discovered that the relationship between readability and stock return synchronicity is particularly pronounced for companies with high institutional investment, high analyst coverage, and lower information asymmetry. The sample size of the study encompasses NSE 500 companies for the period 2015–2016 to 2019–2020.
1. Introduction
How transparent and accurate is the information environment in the emerging markets has always been a concern for researchers; because researchers were suspicious about the corporate governance system, level of information asymmetry, and market efficiency in emerging markets (Farooq & Ahmed, Citation2014; Farooq & Hamouda, Citation2016). It has been established that the quality of the information environment influences the performance of stocks in the market. The value of a company’s stock reflects the availability of information at the industry, market, and firm-specific level. The speed at which investors incorporate this information into stock prices determines the advantages for these investors. The stock price fluctuates as a result of the incorporation of specific information about the firm into the stock prices (Piotroski & Roulstone, Citation2004). The incorporation of information into the stock prices determines the co-movement of stock return with the market return. Stock return synchronicity (hereafter Synchronicity) “measures the co-movement of a firm’s return with the market return and the extent to which industry and market returns explain the variability in individual stock return”(Durnev et al., Citation2003). Evidence indicates that information transparency and asymmetry are essential determinants of Synchronicity (Farooq & Ahmed, Citation2014). To a great extent, information transparency can be captured from the disclosure practices; because the financial disclosures are public documents, and they are the primary source of information to the investors. Hence disclosure practices play an essential role in determining the information environment.
Publicly traded firms publish financial disclosures on a continual basis. Financial disclosures like the annual reports are mandatory according to the regulation (Securities Exchange Board of India (Annual Reports) Rules, 1994), but firms sometimes voluntarily publish additional disclosures to provide more information to the stakeholders. Amongst all the mandatory disclosures, annual reports are the most comprehensive disclosure, which includes detailed information about the financial and non-financial activities of a firm during the past financial year. Generally, an annual report contains financial statements, highlights of the performance from the preceding year, current performance, a letter from the Chief Executive Officer (CEO), and outlook for future years. According to the Securities and Exchange Board of India (SEBI), an annual report should contain a full and fair picture of the activities, policies, and programmes undertaken during the past financial year. Moreover, annual reports published by companies are the main source of information to the capital market participants. About 80% of an annual report is text; hence proper comprehension is essential to ensure the usefulness of the information (Cheng et al., Citation2018). Therefore, textual properties like readability impact the effectiveness of communicating relevant information between the firm and market participants (Ertugrul et al., Citation2017). Readability enhances the usefulness and informativeness of the content. Following Klare, (Citation2000), readability in this paper is defined as the “ease of understanding due to the style of writing”.
All the publicly available information is factored into the stock prices as per the semi-strong Efficient Market Hypothesis (EMH). Semi-strong EMH does not hold when the financial disclosures are complex; because the information usage reduces due to the differences in the information processing expertise among the users. The Incomplete Revelation Hypothesis (IRH) postulates that information that incurs significant cost in terms of processing and extraction from financial disclosures tends to be less completely integrated into market prices (R. Bloomfield, Citation2008). Hence the chances of information asymmetry are higher when the financial disclosures are less readable. Even if the information is publicly available, they are not always useful for uninformed investors. Securities Exchange Commission (SEC) argues that disclosures that are easier to understand improve the content’s informativeness; it can better inform the investors about the firm performance (SEC 1998). As Annual Report Readability (hereafter ARR) decreases, the associated cost of information processing increases. This in turn leads to a decline in the quality of disclosures. This is because complex disclosures necessitate that users expend more effort and time to identify and extract relevant information for their use (R. Bloomfield, Citation2008; Li, Citation2008). Grossman and Stiglitz (Citation1980) find that when the textual contents are costlier to process and understand are not completely incorporated in the stock prices.
The Management Obfuscation Hypothesis (MOH) states that managers intentionally obfuscate poor performance or adverse information that they think may affect market performance (Li, Citation2008). Li (Citation2008) and De Souza et al. (Citation2019), find firms with lesser earnings tend to report complex financial disclosures. According to the MOH, the management is not neutral in presenting firm performance in public disclosures, which results in bias. R. J. Bloomfield (Citation2002) finds that managerial decisions are sometimes motivated by an intention to make it harder for the users to uncover information that the managers do not want to reflect in the stock prices. Such adverse information includes; poor performance, earnings management, accounting frauds, accounting manipulations, etc., (Ajina et al., Citation2016; R. Bloomfield, Citation2008; Craig et al., Citation2013; Li, Citation2008; Lo et al., Citation2017; Subramanian et al., Citation1993). Therefore, by intentionally obscuring financial disclosures, managers aim to prevent the adverse information from being reflected in the firm’s stock prices or, in some instances, to delay its incorporation into stock prices (Li, Citation2008).
In most situations, publishing readable disclosures makes all capital market participants better off; because they require more costly information in the absence of such public announcements (Diamond, Citation1985). Moreover, revealing public information reduces information asymmetry (Diamond & Verrecchia, Citation1991). According to Li (Citation2008), the availability of public disclosures is not enough to reduce information asymmetry; because the information processing ability is not the same for all users (Indjejikian, Citation1991). Given that there exist variations in expertise related to the processing of information, financial analysts and other information intermediaries are able to derive benefit from their analysis of firms by selling their recommendations and opinions to users. That means public disclosures with high readability are essential for reducing information asymmetry.
Kripke (Citation1973), however, opines that the primary users of the information from the financial disclosures should be the professionals like analysts and institutional investors and not the unsophisticated “lay” investors. The unsophisticated investors might not have the expertise to comprehend and understand the financial disclosures. Hence, the efforts to make the disclosures readable for a “lay” investor are a waste of money and time. Nevertheless, since the participation of uninformed investors is significant in the capital market, improving information transparency is essential for protecting the interests of those uninformed investors. The regulators cannot ignore their information needs. According to Jin & Myers, (Citation2006), weak investor protection rights and the opaqueness of information move together. Poor investor protection rights give a chance to the companies to obfuscate adverse information like poor performance and failures, which the management fear may adversely affect the stock prices.
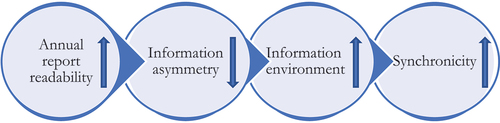
As Li (Citation2008) confirms, increased readability makes the textual content more understandable and improves the informativeness of the content. Hence more readable (less complex) disclosures result in higher reactions from the stakeholders (Rennekamp, Citation2012). Aldoseri & Melegy, (Citation2023) found that there is a positive relationship between ARR and information efficiency. That is to say, as ARR increases, information asymmetry decreases, the information environment becomes more transparent and inclusive as investors are able to read & understand with less time and better comprehension. This also reduced the information processing costs. As a result, this information symmetry gets reflected in stock prices leading to better Synchronicity of a firm’s stock price and the market movements as shown below in .
Figure 1. Relationship between ARR and Synchronicity.
This study aims to investigate the influence of ARR on Synchronicity. Synchronicity, as defined by Bai et al. (Citation2019), represents the proportion of variation in an individual stock return that can be attributed to market returns. A high Synchronicity value implies a strong correlation between the stock return and the market return.
The Indian capital market is an emerging market. This study aims to build upon the research conducted by Bai et al. (Citation2019) by exploring the relationship between ARR and Synchronicity in the Indian capital market. The study acknowledges that the findings of Bai et al. (Citation2019) may not be generalizable to all country settings due to variations in investor protection, governance, and information asymmetry levels. The study also highlights that there are no specific regulations in India governing the readability of financial disclosures, and no prior research has explored the association between financial disclosure quality and Synchronicity in the Indian context. Therefore, the study seeks to fill this research gap and investigate the relationship between ARR and Synchronicity in the Indian capital market. In addition to examining the direct relationship between ARR and Synchronicity, the study also aims to investigate the moderating effects of institutional investment, information asymmetry, and analysts following on this relationship. This approach is useful in understanding how these factors may impact the relationship between ARR and Synchronicity in the Indian context. Overall, this study has the potential to contribute to the literature on financial disclosure quality and market efficiency by providing insights into the relationship between ARR and Synchronicity in the Indian capital market and the factors that may moderate this relationship.
This paper uses Fog Index readability score to measure the ARR of NSE 500 firms. The findings of the paper indicate a positive relationship between ARR and Synchronicity, signalling that in India, as financial disclosures become more readable, Synchronicity also improves due to higher transparency and improved information content that is available to the investors. The improved market efficiency increases Synchronicity. Moreover, the positive relationship is more attenuated for firms with higher institutional investment, higher analyst following, and lower information asymmetry. An enhancement in market efficiency leads to an increase in Synchronicity.
The subsequent sections of the paper are organized as follows: Section 2 presents the existing literature evidence and hypotheses. Section 3 provides information on the data and sample used. Sections 4 and 5 present the empirical models and results, respectively. Finally, Section 6 concludes the paper.
2. Literature review and hypothesis development
This section reviews the literature on ARR and Synchronicity. Annual reports provide a comprehensive account of a company’s financial performance over the preceding financial year. The transparency of such financial disclosures is directly related to Synchronicity. The quality of the information and the cost of processing it can be determined by measuring the readability scores of annual reports (Li, Citation2008). In this study, the readability scores of the annual reports serve as proxies for the cost of information processing. However, there is limited evidence on the relationship between disclosure readability and Synchronicity, particularly in the Indian context. Bai et al. (Citation2019) find a negative relation between ARR and Synchronicity in the US context. The paper posits that when the cost of information processing is low (as reflected by high ARR), investors are able to utilize the firm-specific information found in the annual reports, which results in a decrease in synchronicity. In fact, this result cannot be generalised to all countries; because many other factors like investor protection regulation, type of investors in the market, governance system, level of information asymmetry, etc., which varies across markets, influence the Synchronicity of stock return with the market (Farooq & Ahmed, Citation2014; Jin & Myers, Citation2006). The primary causes of ineffective corporate governance systems in emerging markets include the dominance of family control, inadequate enforcement of laws protecting investors, and ineffective regulations (Claessens & Fan, Citation2002; Khwaja & Mian, Citation2005). Moreover, Leuz et al. (Citation2009) find that controlling shares and management in emerging markets obfuscate true information from other stakeholders.
According to Dasgupta et al. (Citation2010) and Farooq & Ahmed, (Citation2014), an improved governance system leads to higher Synchronicity; because a good governance system necessitates a better information environment and market efficiency which leads to increased Synchronicity. Farooq & Ahmed, (Citation2014), in theirstudy on the Indian capital market, used ownership concentration, operational complexity, and analyst following as proxies for corporate governance. The paper asserts that high ownership concentration leads to inadequate information disclosure (Leuz et al., Citation2009), firms with significant operational complexity experience more severe agency problems and greater analyst coverage promotes a favorable information environment. The research finds that firms with higher analyst coverage, lower ownership concentration, and less operational complexity exhibit greater Synchronicity in India. Dasgupta et al. (Citation2010) find, “When the information environment of a firm improves, and more firm-specific information is available, market participants are able to improve their predictions about the occurrence of future firm-specific events. As a result, the surprise components of stock returns will be lower when the events are actually disclosed, and the return Synchronicity will be higher.”
In contrast, Jin and Myers (Citation2006) find that Synchronicity will be higher for less transparent companies (opaquer), and Synchronicity is higher when financial systems are less developed. According to Morck et al., (Citation2000), compared to the developed countries, Synchronicity is higher in emerging economies, and it is mainly due to the difference in property rights. More private information will be capitalised into the stock prices when there is higher protection on public shareholders’ rights against corporate insiders. That means inefficient property rights protection (poorer investor protection) leads to high Synchronicity. Ntow-Gyamfi et al. (Citation2015) find that institutional investors can influence a company’s information disclosure practices. Since the institutional investors are large shareholders, the management will be cautious about satisfying these investors because the actions of institutional investors might strongly influence the market. Moreover, institutional investors are large firms that usually have systems to closely monitor the firm and management activities (Le et al., Citation2006). Due to the tight regulation on institutional investors, the information asymmetry reduces, which enhances the information transparency and results in lower Synchronicity in Ghana.
As can be observed from the above review, the literature provides mixed evidence on the association between information transparency and Synchronicity, but all the studies confirm the informativeness of financial disclosure as an important determinant of information transparency, which further leads to Synchronicity.
The comprehensibility of financial disclosures has been a subject of concern for regulators due to their suspicions regarding the transparency of such disclosures. As public disclosures are intended for the benefit of stakeholders, it is imperative that material information is conveyed to them. If the firms intentionally hide adverse information from the investors by making financial disclosures complex, then the investment made by common (uninformed) investors becomes meaningless. Only insiders and the most sophisticated investors like financial analysts and institutional investors can make use of such costly, complex information. Therefore, the transparency or informativeness of financial disclosures is an important element for protecting the information needs of the investors; better readability indicates a better information environment. Similarly, Rennekamp (Citation2012) finds that financial disclosures with higher readability lead to stronger reactions from small investors. Moreover, ARR impacts investors’ reactions to disclosed financial information. It also affects the investors’ decisions to depend on outside sources to obtain more information (Scott Asay et al., Citation2017). There are instances where investors are reluctant to invest in companies that lack transparency. Lawrence (Citation2013)finds that individual investors are less likely to invest in firms that have complex annual reports, as the investors lose confidence in a company when its disclosures are not transparent.
The SEC of the US has made continuous efforts to make the financial disclosures of publicly traded companies readable. According to the plain English disclosure regulation, the companies adopt vague formats and language in financial disclosures to hide adverse information from the stakeholders. Moreover, the average investor may not clearly understand less readable disclosures, resulting in capital market inefficiency. Generally, the studies on ARR confirm that annual reports are complex and “being inaccessible to a large proportion of private lay investors” (Jones & Shoemaker, Citation1994). Li (Citation2008)suggests that one potential motivation for management to make annual reports less readable may be to delay the integration of negative information into stock prices. This is because the stock market tends to under-react to the narrative content of annual reports.
Annual reports represent a crucial means through which stakeholders acquire firm-specific information. This study aims to explore the association between ARR (a substitute for the cost of firm-specific information processing) and Synchronicity. We use Synchronicity as a proxy for measuring the utilization of information (Bai et al., Citation2019). Lehavy et al. (Citation2011) establish that the readability of financial disclosures can serve as a measure of the cost incurred by stakeholders to interpret, process and comprehend the textual content. That means the lesser the readability, the higher will be the difficulties for the stakeholders to process and understand the disclosures; because it requires the users to pay more attention, effort, and time in extracting and comprehending the most relevant information (R. J. Bloomfield, Citation2002). When information gathering or processing cost is high (lesser readability), the uninformed investors use the stock price movements as an information source and make decisions. Following Li (Citation2008) and Farooq & Ahmed (Citation2014), we hope that improving the ARR will increase information transparency and ultimately lead to higher Synchronicity.
With this premise, our first hypothesis is stated as follows;
H1: Companies with high ARR have higher Synchronicity.
It is to be noted that the hypothesis developed here is in contrast with the findings of (Bai et al., Citation2019) as for an emerging market like India which is semi-strong form is informationally efficient and a sample consisting of higher sophisticated investors. Grossman and Stiglitz (Citation1980) opined that the cost of analysing data must equate the return to analyse data in an efficient market, the lack of which shall suboptimal level of investors analysing data and resulting in mean reversion of the returns. Further, Boubaker et al., (Citation2019) noted a negative relationship between ARR and stock liquidity, meaning that complex ARR makes those firm’s stock unattractive and are less traded. Therefore, as ARR increases, information asymmetry decreases, the information environment becomes more transparent and inclusive as investors are able to read & understand with less time and better comprehension. This also reduces the information processing costs and they also become very liquid. As a result, this information symmetry gets reflected in stock prices leading to better Synchronicity.
The degree to which stock prices accurately reflect information or the efficiency of the price system is contingent on the proportion of knowledgeable investors in the market. When the proportion of sophisticated investors is high, the price system more efficiently transmits publicly available information from informed investors to uninformed investors (Grossman & Stiglitz, Citation1980). Ntow-Gyamfi et al. (Citation2015) find that close monitoring by institutional investors helps in reducing information asymmetry and improves the information environment. Hence the second hypothesis is stated as follows;
H2: The positive association between ARR and Synchronicity is more pronounced for firms with greater levels of institutional investments.
The presence of a greater proportion of knowledgeable investors in the market enhances the information environment and thus, reduces information asymmetry. This supports the findings of Ntow-Gyamfi et al. (Citation2015) that an increase in institutional investment reduces information asymmetry, we also hypothesise that;
H3: The positive association between ARR and Synchronicity is more pronounced for firms with reduced information asymmetry.
Analysts are the information intermediaries who do independent evaluations and assessments about firm performance, and they go beyond the information given in the company disclosures to upgrade their recommendations. Analysts collect, analyse, interpret and disseminate private and public information to the stakeholders (Farooq & Ahmed, Citation2014; Michaely & Womack, Citation1999) . As a result, the existence of analysts diminishes information asymmetry by providing valuable information to capital market participants. Analysts improve the information environment and make stock prices more informative, thus resulting in an increase in Synchronicity (Chan & Hameed, Citation2006; Farooq & Ahmed, Citation2014). Furthermore, as the efficiency of stock prices improves, stock price volatility decreases, and Synchronicity is enhanced (Ayers et al., Citation2003). This leads to our next hypothesis that;
H4: The positive association between ARR and Synchronicity is more pronounced for firms with high analyst following.
This paper aims to extend the literature using the sample from an emerging market, i.e., India, by focusing on the relationship between ARR and Synchronicity. Moreover, this paper also checks what happens to the relationship between ARR and Synchronicity under different market conditions. To do this, the sample is divided into subgroups based on institutional investment (as proxied by the proportion of institutional investment), information asymmetry (as proxied by bid-ask spread), and analyst coverage (measured by the total number of analysts issuing recommendations). If this paper finds a relationship between ARR and Synchronicity, we can conclude that directly or indirectly, ARR is factored into the market.
The results of the paper are believed to help investors and managers to understand how vital disclosure readability is to ensure Synchronicity and thereby market efficiency. In an efficient market condition, stock prices become more informative. The findings also indicate that the management should be more cautious about the disclosure readability if their firms have lower institutional investments, higher information asymmetry and lower analyst following.
3. Data
This section documents the details of the sample, the calculation of Synchronicity and the calculation of various proxies for measuring the readability.
3.1. Sample
To investigate the relationship between ARR and Synchronicity, we consider annual reports of Indian firms (NSE 500 firms) for the period 2015–16 to 2019–20. NSE 500 is India’s first broad market index, and the companies included in the list are the top 500 firms selected according to the market capitalisation from the eligible universe. It has representation from all industries. Since the categorisation is based on market capitalisation, they are the actively traded or monitored stocks in the market. Actively traded companies are more transparent than thinly traded or small firms (Jin & Myers, Citation2006). Hence in this study, we consider NSE 500 companies for the analysis. Further, we consider the period 2015–2019 because from 2016, India has converged into a new accounting standard, Ind AS. Ind AS was introduced in a phased manner. Almost all the companies in the sample have either voluntarily adopted the new standard or come under the first batch of mandatory adoption. Although we are not concerned about the effect of Ind AS on annual report readability, since it is a significant change in the accounting practice, we did not include the period before Ind AS implementation. The financial year 2020–22 is intentionally ignored due to the suspected impact of the global pandemic, Covid 19.
The annual reports are collected from Prime Infobase (2015–16 to 2018–19) and Bloomberg (2019–20), and readability scores are calculated using Python. We consider the full annual report for the analysis, as each section of the annual report explains different information related to the firm performance, we cannot predict which section the readers may feel is helpful for them. Each section of the annual report is expected to serve different information needs of the reader.
All other variables are downloaded from CMIE Prowess IQ and Bloomberg. Excluding the missing observations, the final sample consists of 360 firms.
3.2. Synchronicity measure
This paper follows (Farooq & Ahmed, Citation2014) for calculating Synchronicity. First, using weekly return data for each company in the sample for each year, we estimate Equation (1) and the are obtained from the regression output. The R2 given in Equation (2) is the “coefficient of determination” from estimating equation (1).
Where, is the stock return of firm
for the week
;
indicates the market return of index
for week
;
is the unspecified random factors. Next, we convert these
into Synchronicity value using Equation (2).
The log transformation of helps in creating an unbounded continuous variable as the original values from Equation (1) were restricted between 0 and 1 (Piotroski & Roulstone, Citation2004). A high value of Synchronicity (sync) signifies a robust correlation between the returns of an individual stock and the market.
3.3. Readability measures
Readability measures check for the syntactical difficulty of the text. Among the existing readability measures, the Fog index is widely used in the finance and accounting literature. Researchers like Bai et al. (Citation2019) and Xu et al. (Citation2020) have also developed similar measures to check the readability of financial disclosures. Since there are no specific measures developed for measuring the readability of financial disclosures in the Indian context, we use the popular existing measures.
This paper uses Gunning Fog Index, a popular and widely used readability index to measure ARR. This paper also uses Flesch Kincaid Grade Index, another popular readability measure in finance and accounting literature, to ensure the robustness of the main model.
3.3.1. Fog Index
The Fog index is one of the commonly employed readability measures in finance and accounting literature. (Callen et al., Citation2013; Kim & Shi, Citation2012; Li, Citation2008; Lo et al., Citation2017). Moreover, Christopher Cox, the former SEC chairman, suggested using the Fog index to measure the readability of financial disclosures (Lehavy et al., Citation2011). The calculation of the Fog index is given below;
The proportion of words with a minimum of three syllables (complex words) and the average length of the sentence are the components of the Fog Index. The Fog index and readability have an inverse relationship. A high Fog index implies lower readability, and conversely, a low Fog index indicates higher readability. According to the corporate finance institute, the Fog index value between 30 to 35 is typically ideal for official reports.Footnote2
3.3.2. Flesch Kincaid grade index
The Flesch Kincaid Grade (Flesch Kincaid) index is another readability metric that indicates the level of education a user should have to be able to comprehend the text (Laksmana et al., Citation2012; Xu et al., Citation2020). It operates similarly to the Fog Index, in that a higher index indicates lower readability and vice versa.
4. Empirical framework
This section documents empirical models used for studying the relationship between ARR and Synchronicity. In order to test the hypotheses, this paper follows the Bai et al., (Citation2019) model. The base model is estimated as below;
Where denotes Synchronicity of firm
for the year
.
and
are readability measures for the firm
for year
. We hypothesise that the Fog index and Flesch Kincaid index coefficient are negative (indicating the positive relationship between ARR and Synchronicity). That means when the Fog index is low (annual reports are readable), it indicates increased information transparency and a better information environment, and hence it provides more publicly available information. Therefore, as all capital market participants can make use of publicly available information to make decisions and there are no unexpected developments in future firm performance, Synchronicity increases (Dasgupta et al., Citation2010). On the other hand, when the annual reports are less readable (high Fog index), only the sophisticated investors use the firm-specific information, and the uninformed investors can use only the publicly available information; hence Synchronicity decreases.
Following Kim and Shi (Citation2012) and Bai et al. (Citation2019), we have included the control variables. measures the trading activity, and it is measured as the log ratio of the average monthly trading volume of the last 1 year and the number of shares outstanding, and this variable is a proxy for investor awareness (Bai et al., Citation2019).
is a proxy for firm size, and it is defined as the natural log of market capitalisation at the end of each financial year. This variable helps to control for the concern that larger firms are the representatives of their industry and possess a big share in the market. The leverage effect is controlled by using
. It is the ratio between total liabilities and assets.
is calculated by dividing the sum of the market value (MV) of equity and book value (BV) of liability with the BV of total assets. The paper expects high-growth firms to have better firm-specific information (Bai et al., Citation2019).
is included as a profitability proxy. The pictorial representation of the empirical model is given in . Using lagged values of all the independent (Fog and Flesch Kincaid) and control variables, we ensure there is no simultaneity issue in the model. This study utilizes year-fixed effects in all models and standard errors clustered at the two-digit NIC code industry level to account for the within-industry correlation of ARR.
Figure 2. Conceptual framework.
To summarize, in this paper, the authors investigate the relationship between ARR (proxied by readability indices Fog and Flesch Kincaid) and Synchronicity from a stock market performance perspective, while controlling for variables like trading volume, market capitalization, leverage, MTB and ROA. The paper hypothesizes a positive relationship between ARR and Synchronicity. The study also investigates how factors such as institutional investment, information asymmetry, and analysts following may moderate this relationship
5. Empirical results
This section documents the summary statistics, pairwise correlations, and empirical results of the models.
5.1. Summary statistics and Pairwise correlation
Table presents the summary statistics of the variables employed in the empirical analysis. The mean of the sample is 0.309, which suggests that, on average, approximately 31% of a company’s stock return variability (volatility) is influenced by industry and market factors. The measure of Synchronicity is the logarithmic transformation of
. The mean Synchronicity is −0.599, and the median is −0.504, wherein a higher Synchronicity value indicates higher co-movement. The mean and median values of the ARR measure, Fog index, are 34.68 and 33, respectively.
Table 1. Summary statistics
Table reports the pairwise correlations. The correlation between Synchronicity and the Fog index is positive and insignificant. The statistical insignificance could be because the correlation cannot capture the industry-wide variations in ARR. Then the correlation of all other control variables with the Synchronicity is significant. Synchronicity exhibits a positive correlation with leverage and firm size (LME) and a negative correlation with profitability (ROA), growth potential (MTB) and trading volume (Volume).
Table 2. Pairwise correlations
5.2. Annual report readability and Synchronicity
This section presents the results of univariate and multivariate regressions, as shown in Table . The results in Table demonstrate a negative association between the Fog index scores and Synchronicity. The control variables are not considered in the baseline (univariate) models (column 1 and column 3). Then control variables are introduced in columns (2) and (4). The coefficient on Fog is −0.010 in column (1) and −0.008 in column (2); both are significant at 1% and 5% levels, respectively. Moreover, the Flesch Kincaid Grade index coefficients are −0.00004 in column (3) and −0.00003 in column (4) and significant at 1% level. The results indicate that Synchronicity increases with the increase in ARR, which supports Hypothesis 1. Regarding control variables, LME is negative and significant, indicating that large firms’ stock returns move opposite to the industry and market. This can be mainly due to the higher analyst following or institutional investments in such firms. The coefficient of ROA is positive and statistically significant in Model (2), indicating that companies with better returns exhibit higher Synchronicity.
Table 3. ARR and Synchronicity
5.3. Effects of institutional investments
Literature shows mixed evidence on the relationship between the proportion of institutional investments and Synchronicity. In line with Bai et al. (Citation2019), our paper finds a positive relationship between institutional investments and Synchronicity (results given in Appendix I). This could be because institutional investors are sophisticated investors; they have the expertise to understand more information. We also suspect that the relationship between ARR and Synchronicity will be higher when the proportion of institutional investors is higher (Hypothesis 2). To examine this, we divided the companies in the sample into two groups based on the median institutional investment. The proportion of institutional investments represents the percentage of shares outstanding held by institutions, which include mutual funds, insurance companies, trust companies, foreign institutional investments, hedge funds, pension funds, etc. The empirical results for this are presented in Table .
Table 4. Conditioning effects of institutional investments
Table illustrates that the association between ARR and Synchronicity is consistently positive (with the coefficient on the Fog Index consistently negative) and statistically significant for firms with institutional investments above the median (the coefficient on Fog: −0.013, significant at 1%). The result is insignificant for firms below the median institutional ownership, supporting Hypothesis 2. The difference in the relationship between ARR and Synchronicity in both the groups is mainly due to the expertise that the institutional investors possess; because when the annual reports are readable, all the investors will be able to understand and incorporate the information into stock prices. That means improved information transparency due to more readable annual reports results in higher Synchronicity. On the other hand, when the annual reports are less readable (complex), then only sophisticated investors like analysts, brokers, and institutional investors will be able to extract the hidden unclear information from the disclosure; as a result, Synchronicity decreases.
5.4. Effects of information asymmetry
To further investigate the relationship between ARR and Synchronicity in different levels of information transparency, the sample is divided into two groups; firms with higher and lower information asymmetry. The bid-ask spreadFootnote3 is then taken as a proxy for information asymmetry (Amihud & Mendelson, Citation1986). All the firms which have bid-ask spread above the median (higher information asymmetry) and below the median (lower information asymmetry) bid-ask spread is categorised as two subgroups.
Literature evidence shows that Synchronicity increases as information transparency increases (Dasgupta et al., Citation2010). A better information environment and increased transparency indicate lesser information asymmetry. It should be noted that in this context, a positive relationship between ARR and Synchronicity means that as readability increases, Synchronicity also increases. This is because the coefficient on the Fog index, which is used as a proxy for ARR, is negative. Additionally, the results of the analysis given in indicate that this relationship is more pronounced when information asymmetry is low, as indicated by a lower median bid-ask spread. This suggests that companies with more easily readable annual reports and lower levels of information asymmetry tend to have a stronger co-movement of their stock returns with the overall market. The result is insignificant when the information asymmetry is higher, supporting Hypothesis 3.
Table 5. Conditioning effects of information asymmetry
5.5. Effects of analyst following
In line with Farooq & Ahmed, (Citation2014) and Bai et al. (Citation2019), our paper confirms a positive association between analyst following and Synchronicity (results given in Appendix I). Hypothesis 4 assumes that the relationship between ARR and Synchronicity will be attenuated for the companies with more analysts following. To validate the hypothesis, the sample is classified based on the median number of analysts following, where the analyst following is the total number of analysts making recommendations for security. Then the effect of ARR on Synchronicity is compared in both groups separately. The results of the re-estimation are given in Table , where column (1) shows consistent results with the results shown in Table . The Synchronicity increases with the increase in the ARR for firms with high (above median) analyst following (the coefficient on Fog is −0.010, significant at the 10% level). However, the result in column (2) shows a positive association but is insignificant for firms with lesser analyst following (the coefficient on Fog is −0.008 and statistically insignificant).
Table 6. Conditioning effects of analyst following
The results presented in Table support the hypothesis that analysts play a crucial role in the capital market as agents who incorporate available information into stock prices. By doing so, they strengthen the effect of ARR on Synchronicity, supporting Hypothesis 4. This suggests that firms with higher analyst following tend to have a stronger positive association between ARR and Synchronicity than firms with lower analyst following. The results underline the findings of Thomas (Citation2002) that an increase in analyst following decreases the information asymmetry and increases Synchronicity.
In summary, the empirical findings indicate a positive relationship between ARR and Synchronicity, particularly in firms with greater institutional ownership, lower information asymmetry, and more analyst following. These results differ from the findings of Bai et al. (Citation2019), who identified a negative association between the two variables. Dasgupta et al. (Citation2010) explain that stock prices react only to unexpected news, and when there is more firm-specific information available, market participants can make more accurate predictions about future events, which reduces the surprise component of stock returns and increases Synchronicity. By enhancing the readability of annual reports, more firm-specific information becomes available to the public, which reflects the quality of the information environment and ultimately leads to higher Synchronicity.
5.6. Addressing endogeneity: Two-stage regression
The empirical findings show a positive association between ARR and Synchronicity. The readability of the disclosures can be deliberately chosen to affect investor perceptions about the firm performance. Management opportunism theory indicates that management has incentives while hiding actual performance when the firm’s performance is weak (Bai et al., Citation2019). So that management can use disclosure readability strategically to obfuscate the firm performance (Li, Citation2008). Moreover, Li (Citation2008) also finds some firm-level characteristics like firm age, size, MTB etc., that may affect ARR; some of such factors can also affect Synchronicity. In order to ensure that the results of the main analysis are not affected by potential endogeneity issues related to certain factors, this paper employs a “two-stage regression” analysis technique, as proposed by Bai et al. (Citation2019). This approach aims to provide a more robust estimate of the relationship between ARR and Synchronicity, by controlling for any potential confounding variables. Following Li (Citation2008), the first model, Equation (7), is a determinant model of readability that establishes the relationship of the Fog index with its determinants.
Here, the readability of financial disclosures is measured by the Fog and Flesch Kincaid indices. The age of the company, size, number of business segments, volatility of returns, market-to-book ratio, auditor quality, and Tobin’s Q are controlled for in the analysis. The volatility of returns is calculated as the standard deviation of the Earnings Before Interest and Taxes (EBIT) over the past five years. The Market-to-Book (MTB) ratio is the ratio of the market value of equity to the book value of equity. The auditor quality is indicated by whether the company’s auditor is one of the “Big 4” firms, and Tobin’s Q is a measure of firm performance calculated as the ratio of the sum of the MV of equity and BV of total assets minus BV of equity divided by total assets.
Then in the next stage, the predicted residuals from estimating Equation (7) for Fog and Flesch Kincaid index respectively taken and renamed as “Residual Fog” and “Residual Flesch” and thereafter used to re-estimate, replacing the original values for the same in EquationEquations (5)(5)
(5) and (Equation6
(6)
(6) ).
The results of the estimation, as presented in Table , indicate that there is a negative association between the residuals of the Fog and Flesch Kincaid indexes (which serve as proxies for the readability of financial disclosures) and Synchronicity. Furthermore, the coefficients on these residuals are both negative and statistically significant at the 5% level. These findings suggest that even when controlling for potential endogeneity issues, the relationship between the readability of financial disclosures and Synchronicity remains consistent.
Table 7. Two-stage regression analysis
6. Conclusion
Financial decision-makers face difficulties in taking financial decisions due to the factors like a less transparent information environment, higher information asymmetry etc. Moreover, the management sometimes intentionally makes the financial disclosures less readable to hide negative information from the stakeholders. The information processing cost increases as the readability reduce. Therefore, in this paper, we are interested in examining the relationship between ARR and Synchronicity in the Indian context for the period 2015–16 to 2019–20.
In contrast to Bai et al. (Citation2019), this paper finds a positive relationship between ARR and future Synchronicity (supports Hypothesis 1). As the annual report becomes more readable, the information environment becomes more transparent, and information asymmetry reduces, the amount of publicly available information increases; as a result, Synchronicity also increases. On the other hand, when the annual reports are less readable, only sophisticated investors will be able to understand and reflect the information in the stock prices. At the same time, the uninformed investors will be taking the decision based on the publicly available information; hence Synchronicity reduces. As Li (Citation2008) finds, annual reports published with less readability help the management to delay adverse information into stock prices.
According to the literature, both information transparency (Farooq & Ahmed, Citation2014) and opaqueness (Jin & Myers, Citation2006) can cause Synchronicity. When the disclosures are opaque, none of the stakeholders can benefit from firm-specific information because such information is not available; hence the stakeholders use stock price fluctuations as an information source and Synchronicity decreases. When the firms are more transparent, all the stakeholders use the available information, so Synchronicity increases. The median Fog index for the sample is 34.6, which denotes that the sample firms are not highly transparent or opaque in public disclosures. On average, the firm in the sample publishes readable annual reports. Hence, we cannot conclude that the opaque nature of the disclosure practices is the only reason for high Synchronicity.
Further, we find that in the Indian context, the proportion of sophisticated investors (like institutional investors) is high. To check whether the relationship between ARR and Synchronicity changes with the changes in institutional investment, information asymmetry, and analyst following, we classified the sample into two subgroups based on the median institutional investment, information asymmetry, and analyst following. The findings indicate that the positive relationship between ARR and future Synchronicity is more pronounced for the firms with higher institutional investment (supports Hypothesis 2), lower information asymmetry (supports Hypothesis 3), and higher analyst following (supports Hypothesis 4). The results are robust when we address the potential endogeneity issue suspected on readability. Thereby we prove that the increased Synchronicity in the sample is due to the improved information transparency in the market. When the ARR is higher, both the informed and uninformed investors in the market make use of the information, and as a result, all the available information easily gets incorporated into the stock prices and hence Synchronicity increases. Since the proportion of sophisticated investors is higher in the Indian capital market when the annual reports are less readable, only the sophisticated investors in the market can incorporate such information in the stock prices, and as a result, Synchronicity decreases.
The results of the paper help in understanding how the informativeness of the annual reports (measured via the ARR) affects Synchronicity in an emerging market like India. Further, the findings also indicate how readability contributes to a better information environment. To a great extent, the informativeness of the annual reports helps reduce the surprise component in the future. The higher the ARR, the better the information transparency, the lower the information asymmetry, the better the information environment, which results in higher Synchronicity. We also find that the results may change according to the variation in the proportion of institutional investment, analyst following and information asymmetry in the capital market. The findings of the paper will be helpful for the investors and the management to understand how vital disclosure readability is to achieve better market efficiency. Better Synchronicity indicates more efficient market conditions and informationally efficient price movements. Hence under an efficient market condition, investors can use price fluctuations as an information source to make decisions. The findings also indicate that the management should be more cautious about the disclosure readability if their firms have lower institutional investments, higher information asymmetry and lower analyst following.
Disclosure statement
No potential conflict of interest was reported by the author(s).
Additional information
Funding
Notes
1. The paper has been presented at the Research Symposium on Finance and Economics 2022, Krea University, India, and the World Finance Conference 2022, University of Turin, Italy. The comments and suggestions of the discussants and participants are incorporated into the draft.
3. Bid-ask spread data downloaded from Bloomberg (it is the average of all the bid/ask spread).
References
- Ajina, A., Laouiti, M., & Msolli, B. (2016). Guiding through the Fog: Does annual report readability reveal earnings management? Research in International Business and Finance (), 38, 509–22. https://doi.org/10.1016/j.ribaf.2016.07.021
- Aldoseri, M. M., & Melegy, M. M. A. (2023). Readability of annual financial reports, information efficiency, and stock liquidity: Practical guides from the Saudi business environment. Information Sciences Letters, 12(2), 813–821. https://doi.org/10.18576/isl/120223
- Amihud, Y., & Mendelson, H. (1986). Asset pricing and the Bid-ask spread. Journal of Financial Economics, 17(2), 223–249. https://doi.org/10.1016/0304-405X(86)
- Ayers, B. C., Tull, J. M., & Freeman, R. N. (2003). Evidence that Analyst Following and Institutional Ownership Accelerate the Pricing of Future Earnings. Review of Accounting Studies, 8.
- Bai, X., Dong, Y., & Hu, N. (2019). Financial report readability and stock return synchronicity. Applied Economics, 51(4), 346–363. https://doi.org/10.1080/00036846.2018.1495824
- Bloomfield, R. J. (2002). The “Incomplete Revelation Hypothesis” and Financial Reporting. SSRN Electronic Journal. https://doi.org/10.2139/SSRN.312671
- Bloomfield, R. (2008). Discussion of “Annual report readability, current earnings, and earnings persistence.” Journal of Accounting and Economics, 45(2–3), 248–252. https://doi.org/10.1016/J.JACCECO.2008.04.002
- Boubaker, S., Gounopoulos, D., & Rjiba, H. (2019). Annual report readability and stock liquidity. Financial Markets, Institutions & Instruments, 28(2), 159–186. https://doi.org/10.1111/FMII.12110
- Callen, J. L., Khan, M., & Lu, H. (2013). Accounting quality, stock price delay, and future stock returns. Contemporary Accounting Research, 30(1), 269–295. https://doi.org/10.1111/j.1911-3846.2011.01154.x
- Chan, K., & Hameed, A. (2006). Stock price synchronicity and analyst coverage in emerging markets. Journal of Financial Economics, 80(1), 115–147. https://doi.org/10.1016/j.jfineco.2005.03.010
- Cheng, J., Zhao, J., Xu, C., & Gong, H. (2018). Annual report readability and earnings management: Evidence from Chinese Listed Companies. Advances in Social Science, Education and Humanities Research. https://doi.org/10.2991/ICSSHE-18.2018.199
- Claessens, S., & Fan, J. P. H. (2002). Corporate Governance in Asia: A Survey. International Review of Finance, 3(2), 71–103. https://doi.org/10.1111/1468-2443.00034
- Craig, R., Mortensen, T., & Iyer, S. (2013). Exploring Top Management Language for Signals of Possible Deception: The Words of Satyam’s Chair Ramalinga Raju. Journal of Business Ethics, 113(2), 333–347. https://doi.org/10.1007/s10551-012-1307-5
- Dasgupta, S., Gan, J., & Gao, N. (2010). Transparency, price informativeness, and stock return synchronicity: Theory and evidence. Journal of Financial and Quantitative Analysis, 45(5), 1189–1220. https://doi.org/10.1017/S0022109010000505
- de Souza, J. A. S., Rissatti, J. C., Rover, S., & Borba, J. A. (2019). The linguistic complexities of narrative accounting disclosure on financial statements: An analysis based on readability characteristics. Research in International Business and Finance, 48, 59–74. https://doi.org/10.1016/j.ribaf.2018.12.008
- Diamond, D. W. (1985). Optimal Release of Information By Firms. The Journal of Finance, 40(4), 1071–1094. https://doi.org/10.1111/j.1540-6261.1985.tb02364.x
- Diamond, D. W., & Verrecchia, R. E. (1991). Disclosure, Liquidity, and the Cost of Capital. The Journal of Finance, 46(4), 1325–1359. https://doi.org/10.1111/j.1540-6261.1991.tb04620.x
- Durnev, A., Morck, R., Yeung, B., & Zarowin, P. (2003). Does greater firm-specific return variation mean more or Less informed stock pricing? Journal of Accounting Research, 41(5), 797–836. https://doi.org/10.1046/J.1475-679X.2003.00124.X
- Ertugrul, M., Lei, J., Qiu, J., & Wan, C. (2017). Annual Report Readability, Tone Ambiguity, and the Cost of Borrowing. Journal of Financial and Quantitative Analysis, 52(2), 811–836. https://doi.org/10.1017/S0022109017000187
- Farooq, O., & Ahmed, S. (2014). Stock price synchronicity and corporate governance mechanisms: Evidence from an emerging market. Int. J. Accounting, Auditing and Performance Evaluation, 10(4), 4. https://doi.org/10.1504/IJAAPE.2014.066392
- Farooq, O., & Hamouda, M. (2016). Stock price synchronicity and information disclosure: Evidence from an emerging market. Finance Research Letters, 18, 250–254. https://doi.org/10.1016/j.frl.2016.04.024
- Grossman, S. J., & Stiglitz, J. E. (1980). On the Impossibility of Informationally Efficient Markets on JSTOR. The American Economic Review, 70(3), 393–408. https://www.jstor.org/stable/1805228
- Indjejikian, R. J. (1991). The impact of costly information interpretation on firm disclosure decisions. Journal of Accounting Research, 29(2), 301. https://doi.org/10.2307/2491050
- Jin, L., & Myers, S. C. (2006). R2 around the world: New theory and new tests. Journal of Financial Economics, 79(2), 257–292. https://doi.org/10.1016/j.jfineco.2004.11.003
- Jones, M. J., & Shoemaker, P. A. (1994). Accounting narratives: A review of empirical studies of content and readability - ProQuest. Journal of Accounting Literature, 13, 142. https://www.proquest.com/docview/216304635?pq-origsite=gscholar&fromopenview=true
- Khwaja, A. I., & Mian, A. (2005). Unchecked intermediaries: Price manipulation in an emerging stock market. Journal of Financial Economics, 78(1), 203–241. https://doi.org/10.1016/j.jfineco.2004.06.014
- Kim, J. B., & Shi, H. (2012). IFRS reporting, firm-specific information flows, and institutional environments: International evidence. Review of Accounting Studies, 17(3), 474–517. https://doi.org/10.1007/s11142-012-9190-y
- Klare, G. R. (2000). The Measurement of Readability: Useful Information for Communicators. ACM Journal of Computer, 24, 3.
- Kripke, H. (1973). The Myth of the Informed Layman on JSTOR. The Business Lawyer, 28(2), 631–638. https://www.jstor.org/stable/40685124
- Laksmana, I., Tietz, W., & Yang, Y. W. (2012). Compensation discussion and analysis (CD&A): Readability and management obfuscation. Journal of Accounting and Public Policy, 31(2), 185–203. https://doi.org/10.1016/J.JACCPUBPOL.2011.08.003
- Lawrence, A. (2013). Individual investors and financial disclosure. Journal of Accounting and Economics, 56(1), 130–147. https://doi.org/10.1016/j.jacceco.2013.05.001
- Lehavy, R., Li, F., & Merkley, K. (2011). The Effect of Annual Report Readability on Analyst Following and the Properties of Their Earnings Forecasts. The Accounting Review, 86(3), 1087–1115. https://doi.org/10.2308/ACCR.00000043
- Leuz, C., Lins, K., & Warnock, F. E. (2009). Do foreigners invest less in poorly governed firms. Review of Financial Studies, 22(8), 3245–3285. https://doi.org/10.1093/rfs/hhn089
- Le, S. A., Walters, B., & Kroll, M. (2006). The moderating effects of external monitors on the relationship between R&D spending and firm performance. Journal of Business Research, 59(2), 278–287. https://doi.org/10.1016/j.jbusres.2005.04.003
- Li, F. (2008). Annual report readability, current earnings, and earnings persistence. Journal of Accounting and Economics, 45(2–3), 221–247. https://doi.org/10.1016/J.JACCECO.2008.02.003
- Lo, K., Ramos, F., & Rogo, R. (2017). Earnings management and annual report readability. Journal of Accounting and Economics, 63(1), 1–25. https://doi.org/10.1016/J.JACCECO.2016.09.002
- Michaely, R., & Womack, K. L. (1999). Conflict of Interest and the Credibility of Underwriter Analyst Recommendations. The Review of Financial Studies, 12(4), 653–686. https://doi.org/10.1093/RFS/12.4.653
- Morck, R., Yeung, B., & Yu, W. (2000). The information content of stock markets: Why do emerging markets have synchronous stock price movements? Journal of Financial Economics, 58(1–2), 215–260. https://doi.org/10.1016/S0304-405X(00)
- Ntow-Gyamfi, M., Bokpin, G. A., & Gemegah, A. (2015). Corporate governance and transparency: Evidence from stock return synchronicity. Journal of Financial Economic Policy, 7(2), 157–179. https://doi.org/10.1108/JFEP-10-2013-0055
- Piotroski, J. D., & Roulstone, D. T. (2004). The Influence of Analysts, Institutional Investors, and Insiders on the Incorporation of Market, Industry, and Firm‐Specific Information into Stock Prices. The Accounting Review, 79(4), 1119–1151. https://doi.org/10.2308/ACCR.2004.79.4.1119
- Rennekamp, K. (2012). Processing Fluency and Investors’ Reactions to Disclosure Readability. Journal of Accounting Research, 50(5), 1319–1354. https://doi.org/10.1111/j.1475-679X.2012.00460.x
- Scott Asay, H., Brooke Elliott, W., & Rennekamp, K. (2017). Disclosure Readability and the Sensitivity of Investors’ Valuation Judgments to Outside Information. The Accounting Review, 92(4), 1–25. https://doi.org/10.2308/ACCR-51570
- Subramanian, R., Insley, R. G., & Blackwell, R. D. (1993). Performance and Readability: A Comparison of Annual Reports of Profitable and Unprofitable Corporations. International Journal of Business Communication, 30(1), 49–61. https://doi.org/10.1177/002194369303000103
- Thomas, S. (2002). Firm diversification and asymmetric information: Evidence from analysts’ forecasts and earnings announcements $. Journal of Financial Economics, 64. https://doi.org/10.1016/S0304-405X(02)00129-0
- Xu, H., Pham, T. H., & Dao, M. (2020). Annual report readability and trade credit. Review of Accounting and Finance, 19(3), 363–385. https://doi.org/10.1108/RAF-10-2019-0221/FULL/XML
Appendix I
Information asymmetry, institutional investment, analyst coverage and Synchronicity
This section shows the relationship of information asymmetry, institutional investment, analyst following with Synchronicity. Table shows a positive and significant relationship between institutional investment, analyst following and Synchronicity, which confirms the results of existing literature (Farooq & Ahmed, ; Ntow-Gyamfi et al., Citation2015). The direction of the relationship between information asymmetry and Synchronicity is negative but not statistically significant.
Table A1. Information asymmetry, institutional investment, analyst coverage and stock return Synchronicity
