?Mathematical formulae have been encoded as MathML and are displayed in this HTML version using MathJax in order to improve their display. Uncheck the box to turn MathJax off. This feature requires Javascript. Click on a formula to zoom.
Abstract
Market participants, regulators, and practitioners might have disregarded the prospective integration of African markets and the integration of commodity markets with traditional markets. We examine the nonhomogeneous return spillovers and contagion between 12 commodity sectors and African equities under the time-varying parameter vector autoregressions connectedness method. With daily datasets from February 2010 to February 2022, the average connectedness analysis suggests a low spillover transmission between commodities and respective African equity markets. We reveal that the return connectedness between commodities and African equities is largely driven by idiosyncratic spillovers. The results from the dynamic connectedness analysis reveal significant spillovers between the studied markets. Our findings underscore financial market contagion during stressed trading periods, suggesting that global commodity and African equity markets are not entirely immune to global market shocks. Therefore, prompt management of commodity price volatility and the integration between economies could result in controlled impacts of financial market contagion. Portfolio managers should deploy effective risk management strategies that capitalise on the nonhomogeneous roles of some assets as diversifiers, hedges, and safe havens across time horizons. Additional implications of our findings are discussed.
1. Introduction
The attraction of substantial capital flows into economies’ real sector has been a welcoming approach for African economies in recent decades (Bossman, Adam et al., Citation2022). This is seen through the several new interregional and cross-regional alliances formed among and between African states and top-developing economies such as the United Arab Emirates, Russia, and India.Footnote1 The world at large may most likely be interested in these alliances in the wake of the uncertain policy implications emanating from Brexit and the US-China trade conflict, which its persistence is envisaged to impact global financial markets (Fokuo & Ochieng, Citation2020).
Undoubtedly, with these new developments, African equity markets (AEMs) are expected to be more integrated than before, owing to the financial market integration theory (Shadlen, Citation2005). Furthermore, given these contemporary arrangements among African states, financial markets liberalisation and extended volumes of cross-border transactions are envisaged, which collectively results in an increased flow of financial assets between and within market blocs and subsequently expanding investment opportunities. The preceding argument stresses the international portfolio investment theory (Bartram & Dufey, Citation2001), which suggests that due to integrated markets, financial assets from emerging markets would be more accessible to investors across the globe. Notwithstanding, the ramifications of the turbulent trading periods initiated by several episodes of financial crises in recent decades cannot be downplayed (Bossman & Agyei, Citation2022a; Owusu Junior et al., Citation2022).
Just as AEMs stand the chance of high integration, commodities markets in Africa are projected to be detrimentally affected by the novel coronavirus disease 2019 (COVID-19), as cautioned by Karingi (Citation2021). Collectively, these factors are liable to impact the relative resilience of AEMs and the African economy as a whole. AEMs must bear diversification, hedging, and safe-haven properties to attract all classes of international investors to patronise investments in the region, but international investors stand the chance of being indisposed to such investments since high levels of market integration expel diversification benefits between equities markets. When markets are integrated, shocks to one market are highly transmittable to other markets and this results in positive correlations between markets or assets, rendering diversification inexpedient (Bossman, Citation2021).
Combinations of global commodities and African equities are more likely expected in turbulent trading periods when investors seek to diversify their portfolios. For optimal asset allocation and portfolio management, the empirical literature underscores the relevance of the knowledge of cross-asset/market connectedness (see, e.g., Diebold et al., Citation2017; Zaremba et al., Citation2021; etc.). In the wake of the rampant market volatility amid several recent strands of financial market crises such as the meltdown of the Russian and Chinese stock markets in 2014 and 2016, respectively, the dialogues surrounding Brexit and the associated uncertainties, the trade tension between the Chinese and America, and the systemic crisis occasioned by the COVID-19 pandemic, assessing cross-market linkages has been considerably researched for wide-ranging markets (Adekoya & Oliyide, Citation2021a; Ben et al., Citation2020; Bouri, Lucey et al., Citation2021; Caporin et al., Citation2021; Iqbal et al., Citation2022; Mezghani et al., Citation2021; Rehman & Vo, Citation2021; Shah & Dar, Citation2022; Suleman et al., Citation2021; Umar, Jareño et al., Citation2021), yielding highly significant results that impact policy and portfolio management. In the case of African markets, evidence of this sort is non-existent, especially when commodity exporters/producers are isolated.
As already established, not only are the price volatility and financialisation of commodity markets a problem but the recent trade agreements among and between African economies and top-developing economies from other regions also pose significant challenges to market participants in terms of asset allocation and risk management. The likelihood of market integration wiping off diversification potentials of African equities cannot be shelved. When commodities lose their diversification benefits, investors would most likely turn to equities from developing markets due to their return predictability (Bossman, Teplova et al., Citation2022). Similarly, equity investors could combine commodities in their portfolios. The essence of analysing cross-asset and cross-market connectedness is rekindled by the emergence of crisis periods (Agyei, Citation2022; Armah et al., Citation2022; Bossman et al., Citation2022; Bouri, Cepni et al., Citation2020; Bouri, Lei et al., Citation2021; Umar, Polat et al., Citation2022; Wang et al., Citation2022). In this regard, the essence of analysing how commodity and African equity markets interrelate in various crisis periods cannot be overemphasised.
Studies in the African domain have largely focused on how specific commodity markets comove with African stock markets (Asafo-Adjei, Adam et al., Citation2021; Assifuah-Nunoo et al., Citation2022; Boateng et al., Citation2021; Enwereuzoh et al., Citation2021), the connectedness between African markets returns only (Anyikwa & Le Roux, Citation2020; Tweneboah et al., Citation2019), or the susceptibility of market returns from Africa to international shocks (Adam, Citation2020; Asafo-Adjei et al., Citation2020). While the earlier works of Boako and Alagidede (Citation2016) and Kablan et al. (Citation2017) do not encompass all significant commodity markets or fail to consider the heterogeneity and adaptability of market participants, recent works that also focus on the paired comovement between commodity and stock markets’ returns do not incorporate recent episodes of financial market crises (Boako & Alagidede, Citation2021; Boako et al., Citation2020). Although Urom et al. (Citation2022) recently explored the connectedness between commodities and African markets, they make no distinction between commodity exporters and/or importers and commodity classes. Here, it is important to reiterate that the attraction of substantial capital flows into economies’ real sector has been a welcoming approach for African economies in recent decades (Bossman, Adam et al., Citation2022). The link between commodities and stock markets could be a means through which this objective is achieved, although might not have been given full attention by policymakers. To support this supposition with empirical evidence, we analyse the diversification prospects between commodities and African stocks focusing on major producers/exporters. Motivated by the above, our focus on the stock markets for the major commodity producing/exporting countries in Africa is sound since they are those that could attract capital flows through commodity markets vis-à-vis their stock markets.
To complement the existing strands of works that study the spillover dynamics between commodity and other asset classes and those that examine the connectedness of emerging markets and their global counterparts, we focus on the African domain to model the dynamic spillovers between the returns on African equities and global commodity markets. For this purpose, the newly developed spillover index approach hinged on time-varying parameter autoregressions (TVP-VAR) of Antonakakis et al. (Citation2020) is employed. Our study contributes to the literature as follows.
First, to the best of the authors’ knowledge, no study in the empirical literature examines the dynamic connectedness of African stock and global commodity markets’ returns incorporating commodities from varied classes of energies, softs, precious metals, and grains whilst focusing on significant African producers/exporters of these commodities. Assessments of the spillover dynamics between markets and asset classes are essential for asset allocation based on the risk appetite of investors and market players (Diebold et al., Citation2017; Zaremba et al., Citation2021). We provide empirical evidence for these assessments.
Second, based on the stock markets in a given system, we cover all relevant financial market events (e.g., the meltdown of stock markets of Russia and China, Brexit, the European debt crisis, the trade tension between China and the US, and the COVID-19 pandemic) over the last decade. Third, in wake of contemporary alliances and liberalisation of market powers in recent periods—which are suggestive of high market integration—and with the increasing commodity financialisation, commodities may tend to have similar features to traditional assets like stocks and bonds, we maintain that this study is timely in a systemic crisis-era like the COVID-19 pandemic. Knowing how the returns on commodity classes and stock markets have evolved over the period serves as a vital instrument for risk management and market regulation (Diebold et al., Citation2017; Zaremba et al., Citation2021).
Methodically, we employ a novel and more robust technique in terms of spillover analysis in the African context. The TVP-VAR-based connectedness measure does well over previous approaches such as the Diebold and Yilmaz (Citation2014) spillover metric by allowing variations in the variance-covariance matrix using Kalman filter procedures with forgetting factors (Koop & Korobilis, Citation2014). Furthermore, the arbitrary selection of window size and possible loss of observation in the course of dynamic connectedness estimations in a rolling window framework from the spillover index of Baruník and Křehlík (Citation2018) is overcome by the TVP-VAR-based connectedness (Antonakakis et al., Citation2020). Owing to its numerous advantages, the use of the TVP-VAR connectedness in the empirical literature has been predominant (Adekoya & Oliyide, Citation2021a; Akhtaruzzaman et al., Citation2022; Antonakakis et al., Citation2020, Citation2021; Bossman, Umar et al., Citation2023; Bossman, Owusu Junior et al., Citation2022; Fassas, Citation2020; Tiwari et al., Citation2022; Umar, Aziz et al., Citation2021).
Our findings divulge substantial (low) time-varying (average) connectedness between global commodities and African stocks with varying contagious spillovers during turbulent periods. Within systems like copper (precious metals), corn (grains), coffee (softs), and crude oil (energies), we find significant diversification, hedging, and safe-haven potentials between commodities and African equities, and among pairs of African equities, based on the market condition.
The remaining parts of the paper are organised as follows. Section 2 reviews related empirical studies. We present the datasets and discuss the methodology in Section 3. The empirical results and discussion are detailed in Section 4 following which we detail the practical implications in Section 5 and conclude in Section 6.
2. Literature review
Market players, researchers, practitioners, and regulators all pay close attention to empirical assessments of the links between markets or assets in an effort to find assets that satisfy portfolio goals during times of crises. The majority of the studies on this topic concentrate on developed markets (Bouri, Cepni et al., Citation2020; Bouri, Lei et al., Citation2021; Kumar et al., Citation2021; Naeem et al., Citation2022; Umar, Gubareva et al., Citation2021; Wang et al., Citation2022), with little literature focusing on Africa (Boako & Alagidede, Citation2021, Citation2016; Boako et al., Citation2020; Bossman & Agyei, Citation2022b; Bossman, Agyei et al., Citation2022a; Kablan et al., Citation2017; Urom et al., Citation2022).
One important takeaway from the previous works is that because asymmetric and nonlinear market occurrences exist, market responses to market dynamics are substantially varied (Bossman, Umar et al., Citation2022; Kenourgios et al., Citation2020; Ng et al., Citation2020; Umar, Bossman, Choi, Teplova et al., Citation2022; Yin et al., Citation2021; Zhu et al., Citation2020). Studies must, therefore, include techniques that include these crucial components in addition to addressing all pertinent market developments. This leads to empirical studies that look at how crises affect the interconnectedness of the stock and commodity markets (Adekoya & Oliyide, Citation2021b; Bouri, Lei et al., Citation2021; Bouri, Shahzad et al., Citation2020; Ferreira et al., Citation2022; Hu et al., Citation2020; Hung & Vo, Citation2021; Iqbal et al., Citation2022; Ji et al., Citation2020; Karanasos et al., Citation2021; Mezghani et al., Citation2021; Niu & Hu, Citation2021; Suleman et al., Citation2021; Swinnen & McDermott, Citation2020; Umar, Gubareva et al., Citation2021; Yousaf et al., Citation2021). These studies’ driving force is the identification of safe assets, diversifiers, and hedges over a range of investment trading durations. Only a few studies in the African region could be found during the recent and past financial crises.
The conditional link between African equities and commodities was modelled in Boako and Alagidede’s (Citation2016) study using daily data from 1 January 2003, to 29 December 2014. The writers not only neglect to discuss contemporary financial market developments, but they also restrict the available commodities to gold, cocoa, oil, platinum, and silver without limiting the markets that can be researched. Conclusions may be skewed if data from significant producers and exporters is combined with that from non-producers or exporters. Kablan et al. (Citation2017) used a monthly dataset for commodity exporters in Africa encompassing the years 1980–2014 to study the time-variant dynamic relationship between financial distress and commodities. The research by Kablan et al. (Citation2017) also failed to take important events into account and ignores the variety and adaptability of market actors.
Boako et al. (Citation2020) and Boako and Alagidede (Citation2021), both using daily datasets from February 1996 to February 2018, conducted two follow-up studies to the work of Boako and Alagidede (Citation2016) in a bi-wavelet framework. Both studies looked at the time- and frequency-domain linkages between commodities and stock markets, concentrating on the paired comovements between returns on the stock market and commodity markets. Because of the limitations of their prior study, it should be noted that the combinations of the commodities and stock markets were not based on market producers and exporters. The information flow between commodities and African stocks was examined in a recent study by Bossman, Agyei et al. (Citation2022a) using the transfer entropy paradigm. The authors report substantial uncertainty for African stocks under commodities shocks and vice versa based on the mutual information these markets exchange. Similarly, in a vector-wavelet approach, Bossman and Agyei (Citation2022b) explored the diversification advantages between commodities and African stocks.
As prior research restrict their scope to either a specific commodity and African stock markets (Boateng et al., Citation2021; Enwereuzoh et al., Citation2021) or just the connectivity between the stock returns (Adam, Citation2020; Anyikwa & Le Roux, Citation2020; Tweneboah et al., Citation2019), we observe that empirical evidence regarding the total connectedness of these assets is lacking. The only known to us study is Urom et al. (Citation2022), who make no distinction between commodity exporters and/or importers and commodity classes. To fill the empirical gap, we analyse the dynamics of spillover connectedness between commodities and African stocks by classifying the systems based on major commodities. Assessments of the spillover dynamics between markets and asset classes are essential for asset selection and fund allocation for a well-suited portfolio based on the risk appetite of investors and market players (Diebold et al., Citation2017; Zaremba et al., Citation2021). The wake of contemporary alliances and liberalisation of market powers in recent periods are suggestive of prospective high market integration. Notwithstanding, with the increasing commodity financialisation, commodities may tend to have similar features to traditional assets like stocks and bonds (Hu et al., Citation2020; Idilbi-Bayaa & Qadan, Citation2021; Zaremba et al., Citation2021). As a result, knowing how the returns on commodity classes and stock markets have evolved over the period serves as a vital instrument for risk management and market regulation (Diebold et al., Citation2017; Zaremba et al., Citation2021).
3. Materials and methods
3.1. Data
Our daily data comprises 12 commodities and 13 African stock returns series ranging between 23 February 2010 to 4 February 2022. The sampled stock markets from Africa include South Africa, Uganda, Malawi, Kenya, Ivory Coast, Ghana, Namibia, Morocco, Egypt, Zimbabwe, Nigeria, Tanzania, and Zambia. The commodities, which could be classified into four sectors (namely, softs, precious metals, energy, grains) include cocoa, coffee, copper, corn, crude oil, gold, natural gas, palladium, palm oil, rice, silver, and soybeans. The sampled commodities can further be grouped into various sectors or classes, namely energy, grains, precious metals, and softs. The choice of sample is influenced by available stock market data for African countries. The constituent stock markets for the 12 commodity-based samples are determined by the major exporters of the various commodities in Africa, as per Bossman, Agyei et al. (Citation2022a). The sampled commodities are those that have high significance for African countries. Several of these commodities are those that the selected African markets produce or export (Bossman & Agyei, Citation2022b) and have a pivotal contribution to the growth and development of African economies (Alagidede et al., Citation2021). All data were gleaned from EquityRT.
The sample statistics for the data are detailed in Table (see Appendix) with their trajectories in Figure A1 (see Appendix).
3.2. Methodology
The TVP-VAR of Antonakakis et al. (Citation2020) improves the Diebold and Yilmaz (Citation2014) spillover metric by allowing variations in the variance-covariance matrix using Kalman filter procedures with forgetting factors (Koop & Korobilis, Citation2014). We employ the TVP-VAR-based connectedness measure, which does well over previous approaches such as the connectedness approach of Diebold and Yilmaz (Citation2014) by allowing the variance-covariance matrix to vary via a Kalman filter estimation with forgetting factors in the view of Koop and Korobilis (Citation2014). The arbitrary selection of window size and possible loss of observation in the course of dynamic connectedness estimations in a rolling window framework from the spillover index of Baruník and Křehlík (Citation2018) is overcome by the TVP-VAR-based connectedness (Antonakakis et al., Citation2020). Therefore, the TVP-VAR based connectivity measure serves as the best approach to be used in this study.
The model is introduced as:
with
where expressed all available information until
,
and
correspond to
and
vectors.
and
are respectively,
and
dimensional matrices.
is an
vector, and
is
dimensional vector, with
, and
being
and
dimensional matrices, respectively.
is the vectorisation of
and is an
dimensional vector.
A transformation of the TVP-VAR is made to its vector moving average (VMA) form based on the “Wold” representation theorem. In doing so, the generalised impulse response functions (GIRF) and generalised forecast error variance decompositions (GFEVD) are estimated. Resultantly, the retrieval of the VMA representation takes its depicted form as
, where
is
dimensional matrix.
The represents the responses of all variables
, following a shock in
computed with an
ahead forecast.
has the following form:
where is an
of
element, and 0 otherwise. Thence, the
is computed based on
, which has the following representation:
with , and
.
Hinged on the above data, the total connectedness index (TCI) takes the expression:
Total directional connectedness (TDC) to others, i.e., transmits its shock to all other variables
is introduced as:
TDC from others, i.e., receives from all other variables
takes the specification:
Net total directional connectedness is defined as:
4. Empirical results
The results from the TVP-VAR spillover connectedness approach are presented in three stages. First, the overall (average) connectedness of markets is presented in spillover tables for each commodity-based sample. The time-varying and directional spillovers are presented in the second and third stages, respectively.
4.1. Average connectedness analysis
Tables display the overall system connectedness of the various commodities and their accompanying stock markets on averaged terms. For each Table, “FROM others” (last column) represents the system’s return spillovers contributed by all other variables to a stated variable. “TO others” (third to the last row) displays return spillovers from a named variable to the system of all other variables. “NET” (penultimate row) shows the net directional return spillovers of each variable. TCI (bold, right bottom corner) is the total connectedness index of the system of all variables. The last row displays the net pairwise directional connectedness (NPDC), which are reported to only give supplementary insights on the pairwise position of each variable.
Table 1. Total connectedness index of stocks and cocoa
Table 2. Total connectedness index of stocks and coffee
Table 3. Total connectedness index of stocks and copper
Table 4. Total connectedness index of stocks and corn
Table 5. Total connectedness index of stocks and crude oil
Table 6. Total connectedness index of stocks and gold
Table 7. Total connectedness index of stocks and natural gas
Table 8. Total connectedness index of stocks and palladium
Table 9. Total connectedness index of stocks and palm oil
Table 10. Total connectedness index of stocks and rice
Table 11. Total connectedness index of stocks and silver
Table 12. Total connectedness index of stocks and soybeans
The overall degree of interconnectedness of cocoa and stock returns is expressed by the TCI, which is 1.74%, in the right bottom corner of Table . This means that the combined dynamics of the system variables may explain roughly 2% of the variations in the system variables. Turning to the last but second-row (“TO”), each variable’s contribution to the system’s connectedness is found. Ghana (2.02%) and cocoa (2.03%) are the largest providers of spillover “TO” the system. The last column “FROM” depicts the spillover received by each variable from the system. Again, Ghana and cocoa are the main recipients of the system spillovers (1.93% and 1.87%, respectively). The net spillover for each variable is shown in the last row (“NET”) of Table . A positive (negative) value indicates a net transmitter (receiver) of spillovers. Cocoa and Ghanaian stock returns are the net transmitters whereas stocks from Ivory Coast are net spillover receivers.
The TCI coffee and stock returns is 17.43%, implying that the combined dynamics of the system variables may explain roughly 17% of the variations in the system variables. Kenya (36.67%) and Tanzania (21.75%) are the largest providers of spillover “TO” the system whiles Uganda (38.7%) and Tanzania (29.07%) serve as the main recipients of the system spillovers. Whiles Kenya acts as a net transmitter of shocks, Ivory Coast, Tanzania, Uganda, and coffee are all net shock recipients.
The TCI of copper and stock returns is 22.04%, which means that the combined dynamics of the system variables may explain roughly 22.04% of the variations in the system variables. South Africa (32.56%) and Namibia (32.56%) are the largest providers of spillover “TO” the system whiles South Africa (36.26%) and Namibia (30.22%) serve as the main recipients of the system spillovers. The net transmitters (recipients) of system spillovers are Namibia and South Africa (Zambia and coffee).
The TCI of corn and stock returns from African markets is 19.68%, as reported in Table . This suggests that roughly 20% of the variations in the system are explained by the combined dynamics of the system variables. Kenya (38.92%) and South Africa (35.32%) are the largest providers of spillover “TO” the system whiles Uganda (33.93%) and South Africa (29.18%) receive the most system spillovers. The net transmitters (recipients) of system spillovers are the market returns from Kenya, Nigeria, and South Africa (Egypt, Malawi, Uganda, and corn).
The TCI of crude oil and stock returns is 18.67%, indicating that the combined dynamics of the system variables may explain about 19% of the variations in the system variables. Morocco (36.59%) and Egypt (28.76%) are both the largest providers and recipients of system spillovers, making them the net transmitters of spillovers with a “NET” spillover index of 6.79% and 1.43%, respectively. Meanwhile, Nigeria (−0.71%), Tanzania (−5.85%), and crude oil (−1.67%) are net system shock recipients.
The TCI of gold and stock returns from African markets is 7.67%, as reported in Table . This implies that roughly, less than 8% of the variations in the system are explained by the combined dynamics of the system variables. South Africa (14.2%) and gold (11.21%) are the largest providers of spillovers “TO” the system whiles Tanzania (10.68%) and South Africa (10.23%) receive the most system spillovers. The net transmitters (recipients) of system spillovers are the market returns from Ghana, South Africa, and gold (Ivory Coast and Tanzania).
From Table , the TCI of natural gas and stock returns from African markets is 4.75%, suggesting that roughly 5% of the variations in the system are explained by the combined dynamics of the system variables. Nigeria (7.79%) transmits the largest spillover “TO” the system while Tanzania (9.81%) receive the most system spillovers. The net transmitters of system spillovers are the market returns from Nigeria (3.93%), Egypt (1.54%), and natural gas (0.06%). Tanzania is the only net recipient of spillovers in the system.
From Table , the TCI of palladium and stock returns is 12.52%, implying that the combined dynamics of the system variables may explain about 13% of the variations in the system variables. South Africa (18.31%) and Palladium (18.33%) are the largest providers and recipients (18.78% and 17.82, respectively) of system spillovers. Stock returns from South Africa (−0.47%) and Zimbabwe (−0.04%) are net recipients of spillovers from palladium’s net transmitter position with a net index of (0.51%).
The TCI of palm oil and stock returns from African markets is 8.85%, as reported in Table . This suggests that roughly 9% of the variations in the system are explained by the combined dynamics of the system variables. South Africa (14.76%) and Kenya (10.28%) transmit and receive (13.06% and 11.51%, respectively) the largest spillovers “TO” and “FROM” the system. With a net spillover index of 1.69%, South Africa is the only net transmitter of system spillovers whiles Ghana (−0.17%), Ivory Coast (−0.11%), Kenya (−1.24), and palm oil (−0.18) are net spillover receivers.
The TCI of rice and stock returns is 22.29%, in the right bottom corner of Table . This means that the combined dynamics of the system variables may explain a little over 22% of the variations in the system variables. Egypt serves as both the largest provider (33.47%) and the largest recipient (31.74%) of system spillovers. The net transmitters of spillovers are Egypt (1.73%), Nigeria (1.01%), and rice (4.92%). Meanwhile, Tanzania (−7.66%) serves as a net system spillover recipient.
The TCI of silver and stock returns from African markets is 4.11%, as reported in Table . This suggests that roughly 4% of the variations in the system are explained by the combined dynamics of the system variables. Namibia (0.34%) and silver (5.86%) transmit and receive (5.56% and 5.68%, respectively) the largest spillovers “TO” and “FROM” the system. With a net spillover index of −0.52%, Zambia is the only net recipient of system spillovers from the net transmitter positions of Namibia (0.34%) and silver (0.18%) in the system.
From Table , the TCI of soybeans and stock returns from African markets is 5.92%, suggesting that roughly 6% of the changes in the system are explained by the combined dynamics of the system variables. Nigeria (9.84%) and Uganda (7.07%) transmit the largest spillovers “TO” the system whiles Uganda (8.8%) and Zambia (8.57%) receive the most system spillovers. The net transmitters of system spillovers are the market returns from Nigeria (6.1%) only. Ghana (−0.31%), Malawi (−0.08%), Uganda (−1.74%), Zambia (−2.91%), and Soybeans (−1.17%) are all net recipients of spillovers in the system.
The average connectedness analysis of commodity and respective stock markets is cemented with their net pairwise plots, which are reported in Figure . We use network analysis to properly evaluate the pairwise connectedness of net transmitters and receivers of spillovers in the system. Our network analysis aids in identifying the net transmitters and net recipients of spillovers on a pairwise basis. Figure shows global commodities and African equity market returns’ net pairwise connectivity patterns and linkages. Note that these plots complement the NET and NPDC positions of the variables as reported in each of the spillover tables.
Figure 1. Network plots of commodity and African stock markets’ returns.
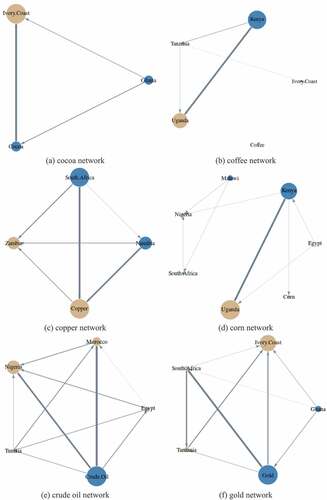
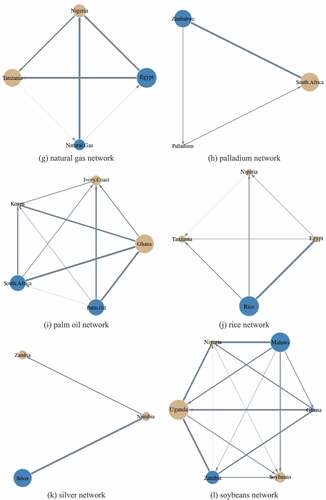
In the respective commodity-based networks, Ivory coast (cocoa), Uganda (coffee), Zambia and copper (copper), Uganda (corn), Nigeria and Morocco (crude oil), Ivory Coast, South Africa, and Tanzania (gold), Tanzania and Nigeria (natural gas), South Africa (palladium), Ghana and Ivory Coast (palm oil), Tanzania, Nigeria, and Egypt (rice), Namibia and Zambia (silver), and Uganda and Soybeans (soybeans), are all net recipients of spillovers in their (named) networks. All other variables from the network are net transmitters of spillovers, as depicted by the blue nodes. The net recipients are potential hedges for other variables in the system. This will be confirmed by analysing their time-varying connectedness.
4.2. Dynamic connectedness analysis
We employ the dynamic technique at this stage of the connectedness analysis for global commodity and African stock markets. This is a rolling window technique that helps overcome notable limitations associated with a static (i.e., the averaged connectedness) measure. As noted by Diebold and Yilmaz (Citation2014), non-stationarity, probable structural breaks, instability, and the influence of fat tails in the data series are among the downsides of the average approach. When the system contains financial asset classes, a dynamic strategy is essential (Owusu Junior et al., Citation2020; Umar, Jareño et al., Citation2021). Given the intensity of commodity financialisation, utilising dynamic analysis does not only helps us to understand the evolution of connectedness but also gives a valuable robustness test and a more edifying image (Aharon et al., Citation2021).
By employing the spillover connectedness approach of Antonakakis et al. (Citation2020), we resort to other works that use 200 days as the rolling window size, forecast horizon of 10 days, and lag length of one (Aharon et al., Citation2021; Antonakakis et al., Citation2020, Citation2021; Zaremba et al., Citation2021). In the dynamic connectedness, the TCI is presented as a function of time, detailing the degree of market connectedness across the sample period for all samples. The results from the dynamic estimations are displayed in Figure in order of the already defined commodity-based samples.
Figure 2. Time-varying connectedness between global commodity and African stock returns.
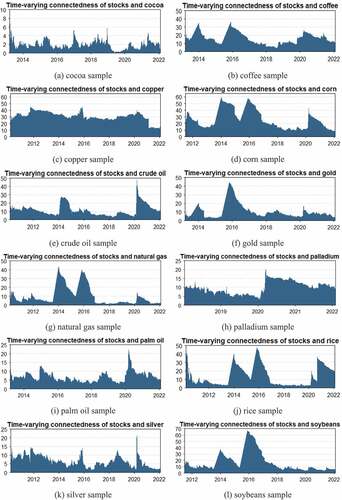
The plots show that the connection between the system variables changes with time, which supports and substantiates the dynamic estimation performed in this research. In particular, one can see that the connectedness witnessed substantial hikes in certain periods. The connectedness index for cocoa and stock markets’ returns generally varies from 0.5% to 5.8%. For the remaining commodity-based samples, the connectedness of the respective stock markets against commodities results in connectedness ranging between 5%-35% for the coffee sample, 12% to 45% for the copper sample, 9% to 60% for the corn sample, 5% to 48% for the crude oil sample, 3% to 45% for the gold sample, 3% to 43% for the natural gas sample, 3% to 20% for the palladium sample, 3% to 23% for the palm oil sample, 3% to 48% for the rice sample, 2% to 22% for the silver sample, and 5% to 68% for the soybeans sample.
The spillover plots communicate the essence of the time-varying analysis under a rolling window framework (Antonakakis et al., Citation2020; Umar, Umar, Yousaf et al., Citation2021). The intuition is that some essential relationships across time are likely to be hidden if the average connectedness measure is solely relied on (Aharon et al., Citation2021). Hence, in unveiling the intricate connectedness between commodity markets, it was appropriate for this research to conduct a dynamic connectedness analysis to supplement the static (average) models.
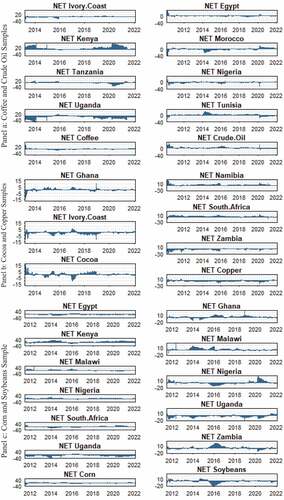
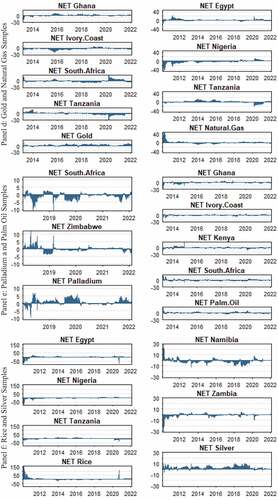
4.3. Directional and net spillover connectedness
So far, the general dynamic analysis has revealed that the interconnectedness of the variables in the system varies across time. While the significance of the dynamic analysis cannot be overemphasised, examining the contribution of each variable to the system’s overall linkages, is just as significant. This aids our understanding of each commodity and stock market’s potential role(s) in risk reduction. As a result, we further explore each variable’s dynamic connectivity with the whole system in Figure .
Figure 3. Directional spillovers between commodities and African stocks.
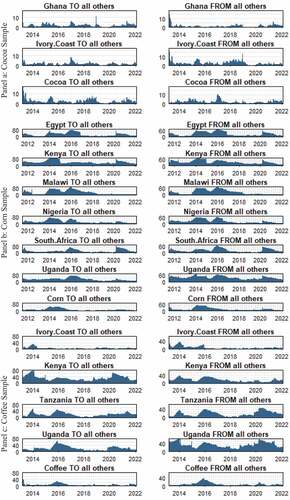
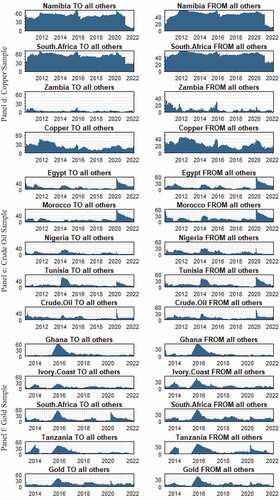
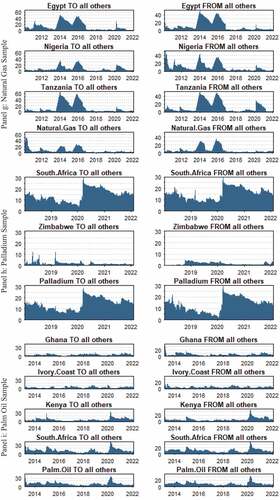
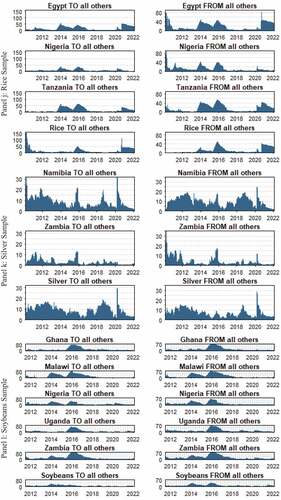
From Figure , we find that the magnitude with which spillovers are transmitted or received in each system is commodity-dependent. For the cocoa sample, the “TO” and “FROM” spillovers measure up to 13%; for the coffee sample, up to 80% (transmitted by Kenya) and 60% (received by Uganda) are the highest directional spillovers; for the copper sample, up to 70% (contributed by Namibia and South Africa); for the corn sample, up to 80% (contributed by Kenya and Malawi); for the crude oil sample, up to 80% (transmitted by Morocco) and 60% (received by Egypt and Morocco); for the gold sample, up to 60% (both received and transmitted by Ghana); for the natural gas sample, up to 60% (transmitted by Tanzania) and 50% (received by Tanzania and Egypt); for the palladium sample, up to 30% (transmitted by South Africa and received by Palladium and South Africa); for the palm oil sample, up to 40% (transmitted by South Africa and received by South Africa and Kenya); for the rice sample, up to 90% (received by Nigeria); for the silver sample, up to 32% (contributed by Namibia); for the soybeans sample, up to 80% (contributed by Malawi and Zambia).
In terms of net directional spillovers (as reported in Figure ), the findings reveal that all variables in the cocoa samples switch between the roles of net transmitters and net recipients of system spillovers. For the coffee sample, Kenya and Uganda are found as net transmitters and recipients, respectively, whiles Ivory Coast, Tanzania, and coffee have varied transmission positions. From the copper sample, copper and Zambia (Namibia and South Africa) are found to be net spillover receivers (transmitters) across the sample period. Kenya and Uganda, respectively, serve as a net transmitter and receiver of spillovers in the corn sample while the remaining variables have varied positions across the period. From the crude oil sample, our findings divulge that Morocco (Tunisia and crude oil) consistently received (transmitted) net spillovers until the COVID-19 period when it (they) transmitted (received) net spillovers. Nigeria is found largely as a net recipient of spillovers while Egypt switches positions. All variables in the natural gas, palladium, palm oil, rice, silver, and soybeans samples are inconsistent with their roles as either net transmitters or receivers.
Figure 4. Net Directional Spillovers between commodities and African stocks.
4.4. Results’ discussion
From the static (average) framework, the analysis of the market returns’ spillovers between African equities and global commodities suggests a low spillover transmission between all commodity samples and their corresponding African equities. On average, less than a quarter of return spillovers exist between African equities and commodities and this may be preferable in the context of risk management. In our commodity-based systems, the low spillover connectedness index between commodities and African stocks is consistent with Urom et al. (Citation2022), who analysed the connectedness between several commodities and African stocks in a single system using the DCC-GARCH connectedness approach. It is noteworthy that averaged connectedness spillovers are unable to communicate the full picture of cross-market or cross-asset shock transmissions (Aharon et al., Citation2021; Hazgui et al., Citation2021; Mensi et al., Citation2021). This partly explains why dynamic or time-varying spillovers are essential for asset allocation.
Before we move to the discussion on the dynamic connectedness, an essential observation that needs to be highlighted—from the spillover dynamics between equity and commodity markets’ returns—is the extent to which self-induced shocks affect African markets as well as commodities. For instance, among commodities, as much as 98.13% of the return spillovers from global commodity markets could be attributed to their “own” shocks, as in the case of cocoa. Similarly, of the overall return spillovers presented to various African equities markets, as high as 99.02% is traceable to the self-induced shocks from within the market in question, as in the case of Zimbabwe in the palladium sample. Market integration could be attributed to these increased idiosyncratic spillovers between global commodity and African equity markets. The findings lend support to the empirical literature such as Khalfaoui et al. (Citation2015) and Mensi et al. (Citation2021) who reported high idiosyncratic shocks between equity and commodity market-based spillover systems.
The results from the dynamic connectedness analysis suggest that equity-commodity return spillover transmission varies across time. When particularly paid attention to, the time-varying spillovers suggest that there are high overall and directional spillovers from either individual equities or commodities. It is worth noting that the spillover index for all samples is time-varying with some extraordinary peaks around 2014, 2016, and 2020–2021. Most of the peaked spillover indices across the samples were recorded around the aforementioned periods, which correspond to stressed market conditions in the history of financial markets. The 2014 hikes could be attributed to the fall of the Russian currency which was followed by the imposition of economic sanctions and the meltdown of Russian equity markets (Islam & Volkov, Citation2021).
Similarly, the peaked connectedness index recorded in 2016 for all commodity samples was commensurate with the period in which the Brexit dialogues were more intense and brought about the referendum that led to the exit of Britain from the European Union (David, Citation2016). This event was reported to have caused significant record-breaking losses accumulating to $2 trillion in just a day. It was within the same period in which fears about a Chinese crisis led to a significant decrease in Chinese stock markets’ performance, resulting in markets cancelling contracts (Islam & Volkov, Citation2021). These are linked to commodity-equity investments because, in such tumultuous trading times, equity investors may intensify their search for alternate contracts or investments—like commodities—that would provide yields to cover the losses suffered by existing assets, as the MPT outlines (Markowitz, Citation1952).
In respect of 2020–2021, peaked return connectedness results from the financial market meltdown occasioned by the COVID-19 pandemic. Not only did the pandemic cause plummeting share values globally, but it also affected supply chains which led to a general decline in international economic activities (Agyei et al., Citation2021; Bossman & Ferreira, Citation2021; Bossman & Agyei, Citation2022a; Owusu Junior et al., Citation2021). The ripple effect of the COVID-19 pandemic has affected business operations and capital flows within and across economies and these have affected corporate earnings that translate into owners’ wealth. As a result, through the hypothesis of adaptive markets, it is natural to see the emergence of new markets through structural changes (Ijasan et al., Citation2021; Lo, Citation2004) and market participants are likely to adapt to these changes after considering their risk appetite, as expounded by the heterogeneous markets hypothesis (Agyei et al., Citation2022; Asafo-Adjei et al., Citation2022; Asafo-Adjei; Asafo-Adjei, Owusu Junior et al., Citation2021; Bossman & Agyei, Citation2022a; Müller et al., Citation1993).
The peaked connectedness indices recorded during the 2014 Russian market meltdown, the 2016 Chinese market crash and Brexit, and the 2020/2021 financial market meltdown in the COVID-19 era are further backed by the hypothesis of competitive markets such that, the search for alternate assets by market participants intensify during crises periods, leading to increased spillover transmission among markets (Owusu Junior et al., Citation2021). Furthermore, the principles of contagion suggest that interdependence fails to exist when the linkages between markets undergo significant changes after one market experiences shock or is hit by a crisis (Forbes & Rigobon, Citation2001, Citation2002; Owusu Junior et al., Citation2020). The results suggest that global commodity and African stock markets are not entirely immune to international market shocks. Aside from the theoretical underpinnings, our findings lend support to those of Anyikwa and Le Roux (Citation2020) and Adam (Citation2020) in terms of how susceptible African markets could be to global and/or regional market shocks.
The directional spillovers between commodities and African equities reveal each variable’s contribution to spillovers in addition to how it responds to system spillovers. In the view of portfolio and policy management, it is essential to know the net status (i.e., whether a net transmitter or a net receiver) of each asset in their respective commodity-based systems (Diebold et al., Citation2017; Umar, Gubareva et al., Citation2021; Umar, Jareño et al., Citation2021, Citation2021; Zaremba et al., Citation2021). In the spirit of spillover connectedness analysis, net receivers could be hedges against shocks during average market conditions. Hence, if such an attribute exists in stressed conditions, then we could term net recipients as safe-havens, as per Baur and Lucey (Citation2010).
Impliedly, the findings from the directional spillover analysis suggest that equity returns from Uganda could act as both a hedge and safe-haven for Kenyan equity returns in the coffee sample. From the copper sample, returns from copper and Zambian equities are safe-havens and hedges for returns from Namibian and South African equities. From the corn sample, Ugandan equity returns could hedge and also act as a safe-haven for the return spillovers from Kenya. It is important to note that from the crude oil sample, Morocco could act as a hedge for returns from Tunisian equities and crude oil during normal trading periods and other crises periods. Although their roles as transmitters and receivers change during the COVID-19 period, pairs between them would still yield hedging benefits during the crisis period, making Tunisia and crude oil safe-havens for Moroccan equities. These findings have essential implications for asset and policy management.
5. Practical implications of findings
This study provides sufficient significant evidence of time-varying return spillovers between global commodities and African equities, the magnitude of which depends on the prevailing market condition. These spillovers were found to be significantly made up of idiosyncratic spillovers propagated within individual markets. While this may be normal among developed market equities, it poses a surprise in the context of African markets, which were known to be dissimilar from the international financial market (Boako & Alagidede, Citation2021, Citation2017). From another breadth, this finding is comprehensible as it lends support to empirical findings (Adam, Citation2020; Anyikwa & Le Roux, Citation2020).
The recent alliances between African economies (Karingi, Citation2021; UNECA, Citation2021) coupled with commodity financialisation may be attributable to the changing market dynamics between the studied markets (Hu et al., Citation2020; Idilbi-Bayaa & Qadan, Citation2021; Zaremba et al., Citation2021). With these findings, we divulge that the spillovers between global commodities and African markets are largely idiosyncratic, as in the case of noticeable developed and developing economies and the same conclusions could be made of global commodities (Khalfaoui et al., Citation2015; Mensi et al., Citation2021).
Moreover, the time-varying spillovers that revealed peaked linkages in stressed market periods divulge that the connectedness between commodity and African equity markets responds to external shocks during significant global events or market crises. Accordingly, we document that the connectedness of the studied commodity and equity markets do not only emerge from interdependence but also result from contagion, as empirically defined in the financial contagion literature (Akhtaruzzaman et al., Citation2022; Forbes & Rigobon, Citation2001, Citation2002; Owusu Junior, Citation2020; Owusu Junior et al., Citation2020; Shahzad et al., Citation2017).
In the context of asset allocation and portfolio management, the net recipient status of various markets is definitive of their roles as hedging instruments during normal average periods while they act as safe-havens in turbulent trading phases (Baur & Lucey, Citation2010). Hence, our findings underscore the hedging and safe-haven roles for notable African equities within the coffee, copper, corn, and crude oil samples (as summarised in Table ). Similarly, pairs of markets with mild time-varying spillovers could facilitate diversification advantages in normal trading periods. It is worth noting that the net spillover position of assets may change owing to the time-based behaviour of market participants and this results in some assets switching between roles as diversifiers, hedges, and/or safe-havens across time and trading conditions. Classified into commodity classes, Table summarises the significant portfolio benefits between specific commodities and African stock markets.
Table 13. Summary of significant portfolio benefits based on commodity sectors
6. Concluding remarks
This study examined the dynamic spillover connectedness of global commodities and African equity markets’ returns. The TVP-VAR connectedness method was employed on daily datasets covering 23 February 2010 to 4 February 2022. The study contributes to the strands of literature that examine cross-market linkages. We specifically contribute to the African and emerging markets literature that assesses spillovers, the degree of connectivity, and integration between African or emerging markets’ equities and global commodities.
The findings divulged that, when examined from the average (static) domain, spillovers between global commodity and African equity markets are moderate across commodity-based systems. Meanwhile, the idiosyncratic return spillovers revealed in this research were significantly high, which gives priority to the dynamic spillover analysis. The dynamic spillover analysis explicated that the magnitude, direction, and net return spillovers, recorded by commodity and African equity markets were time-varying over the sample period. More importantly, we unveiled contagious spillovers in notable crises in the history of financial markets, specifically the 2014 Russian equity market crash, the China equity market crisis in 2016, Brexit, and the financial market meltdown in the COVID-19 era.
In a more practical sense, owing to financial market contagion, financial market regulators and investors need to care for idiosyncratic risks that are largely propagated internally within markets. In the case of African markets, proper management of the internal market shocks would significantly lessen their interrelations with global markets. Despite the benefits of market integration, the associated decrement of capital flows and direct foreign investments cannot be overlooked when equity investments are considered. This may warrant thorough assessments of terms of trade and agreement, particularly in newly proposed alliances. Managing the interrelations and interdependence between economies could result in controlled impacts of financial market contagion. With such characteristics, decoupled markets attract investors who seek to diversify their portfolio holdings. Therefore, investors could take advantage of the net spillover positions of global commodity and African equity markets to diversify and hedge against losses from integrated markets across divergent market conditions. The dynamic nature of the spillovers between global commodity and African stock markets suggests that portfolio managers should deploy effective risk management strategies that capitalise on the non-homogeneous roles of some assets as diversifiers, hedges, and safe-havens across time horizons. By carefully and timely regulating local commodity and stock markets, policymakers in Africa could capitalise on the low connectedness between commodities and African stocks to attract foreign investment. This may be achieved by concentrating efforts on policy actions that lessen shock transmission and contagion from global markets to their African counterparts.
It is important to acknowledge that the study’s framework of analysis bears some limitations. For instance, by isolating producers/exporters of a given commodity, the role of other commodities in the analysed system may be missing. Therefore, future studies may consider the connectedness between all commodities and African stocks in a single system.Footnote2 Furthermore, as the current economic and market situations have changed owing to the Russia-Ukraine geopolitical risk-driven stress (Bossman, Gubareva et al., Citation2023; Umar, Bossman, Choi, Teplova et al., Citation2022; Umar, Bossman et al., Citation2022; Wang et al., Citation2022), future studies could extend this analysis by analysing the effect of geopolitical risk on the connectedness between commodities and African stocks. The hedging effectiveness for portfolios containing African stocks and commodities could also be ascertained in future studies.
Data availability
Data will be made available on request.
Acknowledgements
This article was prepared within the framework of the Samuel and Emelia Brew-Butler-SGS/GRASAG-UCC Research Grant, 2021/2022 under the Master of Commerce (Finance) programme at the University of Cape Coast, Ghana.
Disclosure statement
No potential conflict of interest was reported by the author(s).
Additional information
Funding
Notes
2. We acknowledge the suggestion of an anonymous reviewer here.
References
- Adam, A. M. (2020). Susceptibility of stock market returns to international economic policy: Evidence from effective transfer entropy of Africa with the implication for open innovation. Journal of Open Innovation: Technology, Market, and Complexity, 6(3), 71. https://doi.org/10.3390/joitmc6030071
- Adekoya, O. B., & Oliyide, J. A. (2021a). How COVID-19 drives connectedness among commodity and financial markets: Evidence from TVP-VAR and causality-in-quantiles techniques. Resources Policy, 70(October). https://doi.org/10.1016/j.resourpol.2020.101898
- Adekoya, O. B., & Oliyide, J. A. (2021b). How COVID-19 drives connectedness among commodity and financial markets: Evidence from TVP-VAR and causality-in-quantiles techniques. Resources Policy, 70, 101898. https://doi.org/10.1016/j.resourpol.2020.101898
- Agyei, S. K. . (2022). Diversification benefits between stock returns from Ghana and Jamaica: Insights from time-frequency and VMD-based asymmetric quantile-on-quantile analysis. Mathematical Problems in Engineering, (2022, 1–39. https://doi.org/10.1155/2022/9375170
- Agyei, S. K., Isshaq, Z., Frimpong, S., Adam, A. M., Bossman, A., & Asiamah, O. (2021). COVID-19 and food prices in sub-Saharan Africa. African Development Review, 33(S1), S102–S113. https://doi.org/10.1111/1467-8268.12525
- Agyei, S. K., Owusu Junior, P., Bossman, A., Asafo-Adjei, E., Asiamah, O., Adam, A. M., Owusu Junior, P., Bossman, A., Asafo-Adjei, E., Asiamah, O., & Adam, A. M. (2022). Spillovers and contagion between BRIC and G7 markets: New evidence from time-frequency analysis. PLoS ONE, 17(7), e0271088. https://doi.org/10.1371/journal.pone.0271088
- Aharon, D. Y., Umar, Z., & Vo, X. V. (2021). Dynamic spillovers between the term structure of interest rates, bitcoin, and safe‑haven currencies. Financial Innovation, 7(59), 1–25. https://doi.org/10.1186/s40854-021-00274-w
- Akhtaruzzaman, M., Boubaker, S., & Umar, Z. (2022). COVID-19 media coverage and ESG leader indices. Finance Research Letters, 45, 102170. https://doi.org/10.1016/j.frl.2021.102170
- Alagidede, I. P., Boako, G., & Sjo, B. (2021). African equity markets’ exposure to oil and other commodities - implications for global portfolio diversification. Journal of Economics and Finance, 45(2), 288–315. https://doi.org/10.1007/s12197-020-09527-3
- Antonakakis, N., Chatziantoniou, I., & Gabauer, D. (2020). Refined measures of dynamic connectedness based on time-varying parameter vector autoregressions. Journal of Risk and Financial Management, 13(4), 84. https://doi.org/10.3390/jrfm13040084
- Antonakakis, N., Chatziantoniou, I., & Gabauer, D. (2021). The impact of Euro through time: Exchange rate dynamics under different regimes. International Journal of Finance and Economics, 26(1), 1375–1408. https://doi.org/10.1002/ijfe.1854
- Anyikwa, I., & Le Roux, P. (2020). Integration of African stock markets with the developed stock markets: An analysis of co-movements, volatility and contagion. International Economic Journal, 34(2), 279–296. https://doi.org/10.1080/10168737.2020.1755715
- Armah, M., Amewu, G., & Bossman, A. (2022). Time-frequency analysis of financial stress and global commodities prices: Insights from wavelet-based approaches. Cogent Economics & Finance, 10(1), 2114161. https://doi.org/10.1080/23322039.2022.2114161
- Asafo-Adjei, E., Adam, A. M., & Darkwa, P. (2021). Can crude oil price returns drive stock returns of oil producing countries in Africa? Evidence from bivariate and multiple wavelet. Macroeconomics and Finance in Emerging Market Economies, 1–19. https://doi.org/10.1080/17520843.2021.1953864
- Asafo-Adjei, E., Agyapong, D., Agyei, S. K., Frimpong, S., Djimatey, R., Adam, A. M., & Ma, J. (2020). Economic policy uncertainty and stock returns of Africa: A wavelet coherence analysis. Discrete Dynamics in Nature and Society, (2020, 1–8. https://doi.org/10.1155/2020/8846507
- Asafo-Adjei, E., Bossman, A., Boateng, E., Owusu Junior, P., Idun, A. A., Agyei, S. K., Adam, A. M., & Li, Y. (2022). A nonlinear approach to quantifying investor fear in stock markets of BRIC. Mathematical Problems in Engineering, 2022, 1–20. https://doi.org/10.1155/2022/9296973
- Asafo-Adjei, E., Owusu Junior, P., Adam, A. M., & Ferreira, P. J. S. (2021). Information flow between global equities and cryptocurrencies: A VMD-based entropy evaluating shocks from COVID-19 pandemic. Complexity, 2021(2021), 1–25. https://doi.org/10.1155/2021/4753753
- Assifuah-Nunoo, E., Owusu Junior, P., Adam, A. M., & Bossman, A. (2022). Assessing the safe haven properties of oil in African stock markets amid the COVID-19 pandemic: A quantile regression analysis. Quantitative Finance and Economics, 6(2), 244–269. https://doi.org/10.3934/QFE.2022011
- Bartram, S. M., & Dufey, G. (2001). International portfolio investment: Theory, evidence, and institutional framework. Financial Markets, Institutions & Instruments, 10(3), 85–155. https://doi.org/10.1111/1468-0416.00043
- Baruník, J., & Křehlík, T. (2018). Measuring the frequency dynamics of financial connectedness and systemic risk. Journal of Financial Econometrics, 16(2), 271–296. https://doi.org/10.1093/jjfinec/nby001
- Baur, D. G., & Lucey, B. M. (2010). Is gold a hedge or a safe haven? An analysis of stocks, bonds and gold. Financial Review, 45(2), 217–229. https://doi.org/10.1111/j.1540-6288.2010.00244.x
- Ben, H. H., Mezghani, I., & Al Dohaiman, M. (2020). Common shocks, common transmission mechanisms and time-varying connectedness among Dow Jones islamic stock market indices and global risk factors. Economic Systems, 44(2), 100760. https://doi.org/10.1016/j.ecosys.2020.100760
- Boako, G., & Alagidede, P. (2016). Global commodities and African stocks: A “market of one?”. International Review of Financial Analysis, 44, 226–237. https://doi.org/10.1016/j.irfa.2016.02.009
- Boako, G., & Alagidede, P. (2017). Co-movement of Africa’s equity markets: Regional and global analysis in the frequency–time domains. Physica A: Statistical Mechanics and Its Applications, 468, 359–380. https://doi.org/10.1016/j.physa.2016.10.088
- Boako, G., & Alagidede, I. P. (2021). Commodities price cycles and their interdependence with equity markets (No. 457; African Economic Research Consortium).
- Boako, G., Alagidede, I. P., Sjo, B., & Uddin, G. S. (2020). Commodities price cycles and their interdependence with equity markets. Energy Economics, 91, 104884. https://doi.org/10.1016/j.eneco.2020.104884
- Boateng, E., Adam, A. M., & Owusu Junior, P. (2021). Modelling the heterogeneous relationship between the crude oil implied volatility index and African stocks in the coronavirus pandemic. Resources Policy, 74, 102389. https://doi.org/10.1016/j.resourpol.2021.102389
- Bossman, A. . (2021). Information flow from COVID-19 pandemic to Islamic and conventional equities: An ICEEMDAN-induced transfer entropy analysis. Complexity, (2021, 1–20. https://doi.org/10.1155/2021/4917051
- Bossman, A., Adam, A. M., Owusu Junior, P., & Agyei, S. K. (2022). Assessing interdependence and contagion effects on the bond yield and stock returns nexus in Sub-Saharan Africa: Evidence from wavelet analysis. Scientific African, 16, e01232. https://doi.org/10.1016/j.sciaf.2022.e01232
- Bossman, A., Agyei, S. K. . (2022a). ICEEMDAN-based transfer entropy between global commodity classes and African equities. Mathematical Problems in Engineering, (2022a, 1–28. https://doi.org/10.1155/2022/8964989
- Bossman, A., & Agyei, S. K. (2022b). Interdependence structure of global commodity classes and African equity markets: A vector wavelet coherence analysis. Resources Policy, 79(December), 103039. https://doi.org/10.1016/j.resourpol.2022.103039
- Bossman, A., Agyei, S. K., Owusu Junior, P., Agyei, E. A., Akorsu, P. K., Marfo-Yiadom, E., & Amfo-Antiri, G. (2022). Flights-to-and-from-quality with islamic and conventional bonds in the COVID-19 pandemic era: ICEEMDAN-based transfer entropy. Complexity, (2022, 1–25. https://doi.org/10.1155/2022/1027495
- Bossman, A., Gubareva, M., & Teplova, T. (2023). Asymmetric effects of geopolitical risk on major currencies: Russia-Ukraine tensions. Finance Research Letters, 51, 103440. https://doi.org/10.1016/j.frl.2022.103440
- Bossman, A., Owusu Junior, P., & Tiwari, A. K. (2022). Dynamic connectedness and spillovers between Islamic and conventional stock markets: Time- and frequency-domain approach in COVID-19 era. Heliyon, 8(4), e09215. https://doi.org/10.1016/J.HELIYON.2022.E09215
- Bossman, A., Teplova, T., & Umar, Z. (2022). Do local and world COVID-19 media coverage drive stock markets? Time-frequency analysis of BRICS. Complexity, (2022, 2249581. https://doi.org/10.1155/2022/2249581
- Bossman, A., Umar, Z., Agyei, S. K., & Teplova, T. (2023). The impact of the US yield curve on sub-Saharan African equities. Finance Research Letters, 103636. https://doi.org/10.1016/j.frl.2023.103636
- Bossman, A., Umar, Z., & Teplova, T. (2022). Modelling the asymmetric effect of COVID-19 on REIT returns: A quantile-on-quantile regression analysis. The Journal of Economic Asymmetries, 26, e00257. https://doi.org/10.1016/J.JECA.2022.E00257
- Bouri, E., Cepni, O., Gabauer, D., & Gupta, R. (2020). Return connectedness across asset classes around the COVID-19 outbreak. International Review of Financial Analysis, November, 101646. https://doi.org/10.1016/j.irfa.2020.101646
- Bouri, E., Lei, X., Jalkh, N., Xu, Y., & Zhang, H. (2021). Spillovers in higher moments and jumps across US stock and strategic commodity markets. Resources Policy, 72(February), 102060. https://doi.org/10.1016/j.resourpol.2021.102060
- Bouri, E., Lucey, B., Saeed, T., & Vo, X. V. (2021). The realized volatility of commodity futures: Interconnectedness and determinants. International Review of Economics and Finance, 73(December2020), 139–151. https://doi.org/10.1016/j.iref.2021.01.006
- Bouri, E., Shahzad, S. J. H., Roubaud, D., Kristoufek, L., & Lucey, B. (2020). Bitcoin, gold, and commodities as safe havens for stocks: New insight through wavelet analysis. The Quarterly Review of Economics and Finance, 77, 156–164. https://doi.org/10.1016/j.qref.2020.03.004
- Caporin, M., Naeem, M. A., Arif, M., Hasan, M., Vo, X. V., & Hussain Shahzad, S. J. (2021). Asymmetric and time-frequency spillovers among commodities using high-frequency data. Resources Policy, 70(December2020), 101958. https://doi.org/10.1016/j.resourpol.2020.101958
- David, J. E. (2016). Brexit costs investors $2 trillion, the worst one-day drop ever – British pound sterling falls below Friday’s 31-year low amid uncertainty. https://desdemonadespair.net/2016/06/brexit-costs-investors-2-trillion-wors.html
- Diebold, F. X., Liu, L., & Yilmaz, K. (2017). Commodity connectedness. In NBER Working Paper Series ( No. 23685; Vol. 23685). National Bureau of Economic Research. http://www.nber.org/papers/w23685
- Diebold, F. X., & Yilmaz, K. (2014). On the network topology of variance decompositions: Measuring the connectedness of financial firms. Journal of Econometrics, 182(1), 119–134. https://doi.org/10.1016/J.JECONOM.2014.04.012
- Enwereuzoh, P. A., Odei-Mensah, J., & Owusu Junior, P. (2021). Crude oil shocks and African stock markets. Research in International Business and Finance, 55, 101346. https://doi.org/10.1016/j.ribaf.2020.101346
- Fassas, A. P. (2020). Risk aversion connectedness in developed and emerging equity markets before and after the COVID-19 pandemic. Heliyon, 6(12), e05715. https://doi.org/10.1016/j.heliyon.2020.e05715
- Ferreira, P., Almeida, D., Dionísio, A., Bouri, E., & Quintino, D. (2022). Energy markets – Who are the influencers? Energy, 239, 121962. https://doi.org/10.1016/j.energy.2021.121962
- Fokuo, I. K., & Ochieng, A. (2020, February 18). Up and coming: Here’s why Africa has the potential to boost global growth. World Economic Forum. https://www.weforum.org/agenda/2020/02/how-emerging-markets-will-shape-africa-in-2020/
- Forbes, K. J., & Rigobon, R. (2001). Measuring contagion: Conceptual and empirical issues. In International Financial Contagion (pp. 43–66). Springer US. https://doi.org/10.1007/978-1-4757-3314-3_3
- Forbes, K. J., & Rigobon, R. (2002). No contagion, only interdependence: Measuring stock market comovements. The Journal of Finance, 57(5), 2223–2261. https://doi.org/10.1111/0022-1082.00494
- Hazgui, S., Sebai, S., & Mensi, W. (2021). Dynamic frequency relationships between bitcoin, oil, gold and economic policy uncertainty index. Studies in Economics and Finance. https://doi.org/10.1108/SEF-05-2021-0165
- Hu, C., Li, Z., & Liu, X. (2020). Liquidity shocks, commodity financialization, and market comovements. Journal of Futures Markets, 40(9), 1315–1336. https://doi.org/10.1002/FUT.22127
- Hung, N. T., & Vo, X. V. (2021). Directional spillover effects and time-frequency nexus between oil, gold and stock markets: Evidence from pre and during COVID-19 outbreak. International Review of Financial Analysis, 76, 101730. https://doi.org/10.1016/j.irfa.2021.101730
- Idilbi-Bayaa, Y., & Qadan, M. (2021). Forecasting commodity prices using the term structure. Journal of Risk and Financial Management, 14(12), 585. https://doi.org/10.3390/JRFM14120585
- Ijasan, K., Owusu Junior, P., Tweneboah, G., Oyedokun, T., & Adam, A. M. (2021). Analysing the relationship between global REITs and exchange rates: Fresh evidence from frequency-based quantile regressions. Advances in Decision Sciences, 25(3), 58–91. https://doi.org/10.47654/V25Y2021I3P58-91
- Iqbal, N., Bouri, E., Grebinevych, O., & Roubaud, D. (2022). Modelling extreme risk spillovers in the commodity markets around crisis periods including COVID19. Annals of Operations Research, 10479. https://doi.org/10.1007/s10479-022-04522-9
- Islam, R., & Volkov, V. (2021). Contagion or interdependence? Comparing spillover indices. Empirical Economics, 63(3), 1403–1455. https://doi.org/10.1007/s00181-021-02169-2
- Ji, Q., Zhang, D., & Zhao, Y. (2020). Searching for safe-haven assets during the COVID-19 pandemic. International Review of Financial Analysis, 71, 101526. https://doi.org/10.1016/j.irfa.2020.101526
- Kablan, S., Ftiti, Z., & Guesmi, K. (2017). Commodity price cycles and financial pressures in African commodities exporters. Emerging Markets Review, 30, 215–231. https://doi.org/10.1016/j.ememar.2016.05.005
- Karanasos, M., Yfanti, S., & Hunter, J. (2021). Emerging stock market volatility and economic fundamentals: The importance of US uncertainty spillovers, financial and health crises. Annals of Operations Research, 1–40. https://doi.org/10.1007/S10479-021-04042-Y/TABLES/10
- Karingi, S. (2021). Commodity markets in Africa to remain volatile amid COVID-19. https://www.telesurenglish.net/news/Commodity-Markets-In-Africa-To-Remain-Volatile-Amid-COVID-19-20211007-0004.html
- Kenourgios, D., Umar, Z., & Lemonidi, P. (2020). On the effect of credit rating announcements on sovereign bonds: International evidence. International Economics, 163(March), 58–71. https://doi.org/10.1016/j.inteco.2020.04.006
- Khalfaoui, R., Boutahar, M., & Boubaker, H. (2015). Analyzing volatility spillovers and hedging between oil and stock markets: Evidence from wavelet analysis. Energy Economics, 49, 540–549. https://doi.org/10.1016/J.ENECO.2015.03.023
- Koop, G., & Korobilis, D. (2014). A new index of financial conditions. European Economic Review, 71, 101–116. https://doi.org/10.1016/J.EUROECOREV.2014.07.002
- Kumar, A., Badhani, K. N., Bouri, E., & Saeed, T. (2021). Herding behavior in the commodity markets of the Asia-Pacific region. Finance Research Letters, 41, 101813. https://doi.org/10.1016/j.frl.2020.101813
- Lo, A. W. (2004). The adaptive markets hypothesis. The Journal of Portfolio Management, 30(1), 15–29. https://doi.org/10.3905/jpm.2004.442611
- Markowitz, H. (1952). Portfolio selection. The Journal of Finance, 7(1), 77–91. https://doi.org/10.2307/2975974
- Mensi, W., Al-Yahyaee, K. H., Vo, X. V., & Kang, S. H. (2021). Modeling the frequency dynamics of spillovers and connectedness between crude oil and MENA stock markets with portfolio implications. Economic Analysis and Policy, 71, 397–419. https://doi.org/10.1016/j.eap.2021.06.001
- Mezghani, T., Ben Hamadou, F., & Boujelbène Abbes, M. (2021). The dynamic network connectedness and hedging strategies across stock markets and commodities: COVID-19 pandemic effect. Asia-Pacific Journal of Business Administration, 13(4), 520–552. https://doi.org/10.1108/APJBA-01-2021-0036
- Müller, U. A., Dacorogna, M. M., Davé, R. D., Pictet, O. V., Olsen, R. B., & Ward, J. R. (1993). Fractals and intrinsic time: A challenge to econometricians. Unpublished Manuscript, Olsen & Associates, Zürich, 130. O&A Research Group.
- Naeem, M. A., Peng, Z., Bouri, E., Hussain Shahzad, S. J., & Karim, S. (2022). Examining the asymmetries between equity and commodity ETFs during COVID-19. Resources Policy, 79, 103048. https://doi.org/10.1016/j.resourpol.2022.103048
- Ng, S. L., Chin, W. C., & Chong, L. L. (2020). Realized volatility transmission within Islamic stock markets: A multivariate HAR-GARCH-type with nearest neighbor truncation estimator. Borsa Istanbul Review, 20, S26–S39. https://doi.org/10.1016/j.bir.2020.10.001
- Niu, H., & Hu, Z. (2021). Information transmission and entropy-based network between Chinese stock market and commodity futures market. Resources Policy, 74, 102294. https://doi.org/10.1016/J.RESOURPOL.2021.102294
- Owusu Junior, P. (2020). Emerging financial markets: Spatial risks, elicitability of risk models, and shape shift contagion. University of the Witwatersrand.
- Owusu Junior, P., Agyei, S. K., Adam, A. M., & Bossman, A. (2022). Time-frequency connectedness between food commodities: New implications for portfolio diversification. Environmental Challenges, 9(December), 100623. https://doi.org/10.1016/j.envc.2022.100623
- Owusu Junior, P., Alagidede, I., & Tweneboah, G. (2020). Shape-shift contagion in emerging markets equities: Evidence from frequency-and time-domain analysis. Economics and Business Letters, 9(3), 146–156. https://doi.org/10.17811/ebl.9.3.2020.146-156
- Owusu Junior, P., Frimpong, S., Adam, A. M., Agyei, S. K., Gyamfi, E. N., Agyapong, D., Tweneboah, G., & Li, Y. (2021). COVID-19 as information transmitter to global equity markets: Evidence from CEEMDAN-based transfer entropy approach. Mathematical Problems in Engineering, 2021, 1–19. https://doi.org/10.1155/2021/8258778
- Rehman, M. U., & Vo, X. V. (2021). Energy commodities, precious metals and industrial metal markets: A nexus across different investment horizons and market conditions. Resources Policy, 70, 101843. https://doi.org/10.1016/J.RESOURPOL.2020.101843
- Shadlen, K. C. (2005). Exchanging development for market access - Deep integration and industrial policy under multilateral and regional-bilateral trade agreements. Review of International Political Economy, 12(5), 750–775. https://doi.org/10.1080/09692290500339685
- Shah, A. A., & Dar, A. B. (2022). Asymmetric, time and frequency-based spillover transmission in financial and commodity markets. The Journal of Economic Asymmetries, 25, e00241. https://doi.org/10.1016/J.JECA.2022.E00241
- Shahzad, S. J. H., Ferrer, R., Ballester, L., & Umar, Z. (2017). Risk transmission between Islamic and conventional stock markets: A return and volatility spillover analysis. International Review of Financial Analysis, 52, 9–26. https://doi.org/10.1016/j.irfa.2017.04.005
- Suleman, M. T., McIver, R., & Kang, S. H. (2021). Asymmetric volatility connectedness between Islamic stock and commodity markets. Global Finance Journal, 49(June), 100653. https://doi.org/10.1016/j.gfj.2021.100653
- Swinnen, J., & McDermott, J. (2020). Covid-19 and global food security. EuroChoices, 19(3), 26–33. https://doi.org/10.1111/1746-692X.12288
- Tiwari, A. K., Abakah, E. J. A., Gabauer, D., & Dwumfour, R. A. (2022). Dynamic spillover effects among green bond, renewable energy stocks and carbon markets during COVID-19 pandemic: Implications for hedging and investments strategies. Global Finance Journal, 51, 100692. https://doi.org/10.1016/j.gfj.2021.100692
- Tweneboah, G., Owusu Junior, P., & Oseifuah, E. K. (2019). Integration of major African stock markets: Evidence from multi-scale wavelets correlation. Academy of Accounting and Financial Studies Journal, 23(6), 1–15. https://www.researchgate.net/publication/340647142_INTEGRATION_OF_MAJOR_AFRICAN_STOCK_MARKETS_EVIDENCE_FROM_MULTI-SCALE_WAVELETS_CORRELATION
- Umar, Z., Aziz, S., & Tawil, D. (2021). The impact of COVID-19 induced panic on the return and volatility of precious metals. Journal of Behavioral and Experimental Finance, 31, 100525. https://doi.org/10.1016/j.jbef.2021.100525
- Umar, Z., Bossman, A., Choi, S., & Teplova, T. (2022). Does geopolitical risk matter for global asset returns? Evidence from quantile-on-quantile regression. Finance Research Letters, 48(May), 102991. https://doi.org/10.1016/j.frl.2022.102991
- Umar, Z., Bossman, A., Choi, S., & Vo, X. V. (2022). Are short stocks susceptible to geopolitical shocks? Time-frequency evidence from the Russian-Ukrainian conflict. Finance Research Letters, 103388. https://doi.org/10.1016/j.frl.2022.103388
- Umar, Z., Gubareva, M., & Teplova, T. (2021). The impact of COVID-19 on commodity markets volatility: Analyzing time-frequency relations between commodity prices and coronavirus panic levels. Resources Policy, 73, 102164. https://doi.org/10.1016/j.resourpol.2021.102164
- Umar, Z., Jareño, F., & Escribano, A. (2021). Dynamic return and volatility connectedness for dominant agricultural commodity markets during the COVID-19 pandemic era. Applied Economics, 1–25. https://doi.org/10.1080/00036846.2021.1973949
- Umar, Z., Polat, O., Choi, S., & Teplova, T. (2022). The impact of the Russia-Ukraine conflict on the connectedness of financial markets. Finance Research Letters, 48(May), 102976. https://doi.org/10.1016/j.frl.2022.102976
- Umar, Z., Riaz, Y., & Zaremba, A. (101999). (2021). Patterns of Spillover in Energy, Agricultural, and Metal Markets: A Connectedness Analysis for Years 1780-2020. Finance Research Letters, 43(March). https://doi.org/10.1016/j.frl.2021.101999
- Umar, Z., Yousaf, I., & Aharon, D. Y. (2021). The relationship between yield curve components and equity sectorial indices: Evidence from China. Pacific-Basin Finance Journal, 68(May), 101591. https://doi.org/10.1016/j.pacfin.2021.101591
- UNECA. (2021). Commodity markets in Africa to remain volatile amid COVID-19. TeleSUR World News. https://www.telesurenglish.net/news/Commodity-Markets-In-Africa-To-Remain-Volatile-Amid-COVID-19-20211007-0004.html
- Urom, C., Ndubuisi, G., Del Lo, G., & Yuni, D. (2022). Global commodity and equity markets spillovers to Africa during the COVID-19 pandemic. Emerging Markets Review, 100948. https://doi.org/10.1016/j.ememar.2022.100948
- Wang, Y., Bouri, E., Fareed, Z., & Dai, Y. (2022). Geopolitical risk and the systemic risk in the commodity markets under the war in Ukraine. Finance Research Letters, 49, 103066. https://doi.org/10.1016/j.frl.2022.103066
- Yin, L., Nie, J., & Han, L. (2021). Intermediary capital risk and commodity futures volatility. Journal of Futures Markets, 41(5), 577–640. https://doi.org/10.1002/fut.22185
- Yousaf, I., Bouri, E., Ali, S., & Azoury, N. (2021). Gold against Asian stock markets during the COVID-19 outbreak. Journal of Risk and Financial Management, 14(4), 186. https://doi.org/10.3390/jrfm14040186
- Zaremba, A., Umar, Z., & Mikutowski, M. (2021). Commodity financialisation and price co-movement: Lessons from two centuries of evidence. Finance Research Letters, 38(January2021), 101492. https://doi.org/10.1016/j.frl.2020.101492
- Zhu, H., Huang, R., Wang, N., & Hau, L. (2020). Does economic policy uncertainty matter for commodity market in China? Evidence from quantile regression. Applied Economics, 52(21), 2292–2308. https://doi.org/10.1080/00036846.2019.1688243/SUPPL_FILE/RAEC_A_1688243_SM5371.RAR
Appendix
Table A1. Descriptive statistics
Figure A1. Trajectories of indices and returns of African stocks and global commodities.