
 ?Mathematical formulae have been encoded as MathML and are displayed in this HTML version using MathJax in order to improve their display. Uncheck the box to turn MathJax off. This feature requires Javascript. Click on a formula to zoom.
Abstract
The objective of this study was to measure eight variables, which included total labor, female labor, trained labor, high school labor, annual capital, asset and long-term capital, state capital, and abroad capital. A second objective was to assess which variables impact labor productivities, capital productivities, and gross domestic product (GDP) growth in four provinces in the southern key economic region in Vietnam. It also assessed how the GDP growth of transportation logistics in Ho Chi Minh (HCM), the GDP growth of HCM, and the GDP growth of Vietnam are impacted by the above eight variables and how they affect each other. The methodology used included the Cobb-Douglas formulation employed in a structural equation modeling (SEM) analysis and five steps of SEM’s goodness of fit testing. The software used is Stata 17.0. Some remarkable findings are: Firstly, trained labor had a total and direct positive impact on both goods labor productivity and passenger labor productivity. Secondly, state capital had no effect on goods labor productivity, passenger labor productivity, goods capital productivity, and passenger capital productivity. Thirdly, while trained labor positively affected the growth of Tay Ninh Province, state capital negatively affected the GDP growth of Tien Giang Province. Fourthly, trained labor indirectly negatively affected the GDP growth of transportation logistics in HCM. The implications are that, based on the magnitude of the coefficients, the direction of the effects, the number of variables that affect and are affected, and the magnitude of the effects, we believe that trained labor should be decreased while the GDP growth of transportation logistics should be increased in HCM. State capital had a direct and negative impact on GDP growth in Tien Giang Province; our recommendation is that state capital should be reduced in order to increase GDP growth in Tien Giang Province.
Public Interest Statement
Our study is an empirical study in terms of Transportation Logistics’ development in the current context of Ho Chi Minh City, Vietnam.
On the one hand, Ho Chi Minh is the largest city and economic locomotive of Vietnam. On the other hand, Ho Chi Minh is one of the biggest and strongest cities in the Southern key economic region of Vietnam.
Vietnam is one of the countries with the highest growth rate in the world. In the context that the COVID-19 epidemic has been negatively affecting all socio-economic fields, this is a great success for Vietnam. The average GDP of Transportation Logistics in the period 2010-2020 is about 16% of the GDP of Ho Chi Minh, in which the record number is 80.12% in 2012.
1. Introduction
Transportation logistics is one of the most important sectors of the economy, its share is increasing every year, and this is determined by the process of globalization. In the European Union, the transportation logistics and storage sector employs around 11 million people, accounting for more than 5% of total employment and almost 5% of GDP growth (Ginters et al., Citation2019). Transportation logistics plays an important role in socio-economic development in developing countries (Abu-Eisheh et al., Citation2020). Transportation logistics policies not only play a role in promoting the economy but also affect human health (Dannenberg et al., Citation2021). Improving transportation logistics increases GDP significantly (Gallen & Winston, Citation2021). The key role of transportation logistics is not only within the economy, but also as one of the leading sectors generating the largest share of greenhouse gas emissions globally (Liu et al., Citation2021). In the United States, transportation logistics generates revenue from taxes on motor fuel, vehicle registration, permits, parking, and traffic. This leaves federal, state, and local governors highly dependent on transportation logistics (Lewis & Clark, Citation2021).
Under the authors’ approach, the term “transportation logistics” is “transportation and warehousing.” The term “transportation and warehousing” is named specifically in the socio-economic reports of the General Statistics Office of Vietnam, the Statistics Office of HCM, Vietnam’s Statistical Yearbooks, and HCM’s Statistical Yearbooks. Accordingly, transportation logistics belongs to the service sector, which is a service industry in nine key service industries in the service sector in Vietnam. Transportation logistics are a type of non-state enterprise. Transportation logistics enterprises are mainly small and medium sized. Logistics does not fall into the category of oligopolistic competition or oligopoly.
Currently, developing and emerging countries need to research and find solutions to keep up with the momentum of world trade integration. With GDP in 2020 increasing by 2.91% compared to 2019, Vietnam is one of the countries with the highest growth rates in the world. Given that the COVID-19 epidemic has had a negative impact on all socioeconomic fields, this is a huge accomplishment for Vietnam. However, Vietnam’s transportation logistics’ costs are still high, accounting for more than 20% of the country’s GDP. Meanwhile, in other countries, this cost is only about 11% of average GDP. This means that Vietnam’s transportation logistics’ costs are almost twice as high as the world’s average transportation logistics’ costs. HCM is the largest city in Vietnam, the commercial center, and the economic locomotive of the country. HCM GDP accounts for 23–25% of Vietnam’s GDP. The average GDP of transportation logistics in the period 2010–2020 was about 16% of the GDP of HCM, where the record number was 80.12% in the year 2012. However, one problem is that, according to the statistics of the HCM Statistics Office for the period 2010–2020, the total number of profitable enterprises in transportation logistics only accounts for more than 40%, while the loss-making enterprises account for about 50%, and roughly 8% are bankrupt, dissolved, or have ceased operations indefinitely.
From the reasons outlined above, we realize that it is necessary to analyze the factors affecting the development of transportation logistics in HCM. The objective of this paper was to develop the Cobb-Douglas formulation and apply it in an SEM analysis. This will help to assess how labor factor and capital factor affect labor productivities, capital productivities, and GDP growth of transportation logistics in HCM. Using the economic point of view, we measured how these factors affect the GDP growth of four provinces in the southern key economic region in Vietnam, GDP growth of HCM, and the GDP growth of Vietnam.
The novelty of the paper is as follows:
To begin, an in-depth examination of the labor and capital factors is conducted with respect to eight variables, including total labor, female labor, trained labor, high school labor, annual capital, asset and long-term capital, state capital, and foreign capital.
Secondly, we examined the effects of the eight variables listed above on labor productivity, capital productivity, and GDP growth in four provinces in Vietnam’s southern key economic region.
Thirdly, we measured how the GDP growth of transportation logistics in HCM, the GDP growth of HCM, and the GDP growth of Vietnam impacted each other.
The study area is HCM, Vietnam.
2. Literature review
This section is divided into two parts, the first of which is background theory to justify in more detail the variables employed. The next part deals with previous research and how this is related to the study’s objectives in order to find novelty and gaps.
Background theory:
Cobb-Douglas production function:
As Equationequation (1)(1)
(1) states:
P is total production
L is Labor
C is Capital
Labor factor: The total labor factor originates from the gender structure, in which female workers play an increasingly important role. Women enter the workforce, and are paid, in numbers unprecedented in the 20th century (Patricia & Johnson, Citation2019). The world economy has identified trade as a potential determinant of female labor force participation. The female labor force increases whenever trade expands (Saure & Hosny, Citation2014). Women are starting to participate more in the labor markets of developing countries (German Cubas, Citation2016). Female labor plays an important role in the workforce, alongside a total labor variable, therefore, we included a female employees’ variable and named it female labor.
Workers’ educational status is one of the factors that affect the productivity and economic efficiency of charcoal production in northwest Ethiopia (Andaregiea et al., Citation2020). The gap in farmers’ knowledge and skills is the main cause of obstacles to crop production (Tadesse et al., Citation2021). Education, knowledge, and skills play an important role in the job market. Therefore, we believe that including variables like high school graduation and vocational training is necessary for this study. Accordingly, the total number of employees who have received vocational training was used as a variable and was named “trained labor”. Also, the total number of employees who have graduated from high school was used as a variable and was named “high school labor.”
Capital factor: According to (Eugen, Citation1890, Citation1891), capital includes the theory of capital formation and the theory of capital use. Regarding the theory of capital formation, he argued that capital is formed in production. And for the theory of capital use, he stated that, besides the nature of capital, the use of capital is an object of independent nature and independent value to profit from capital. (Mill, Citation1829) observed that “capital forms itself through labor, and therefore all costs of production and raw material costs can be attributed to labor”.
From the authors’ point of view, capital is formed through mobilizing from many sources, such as self-contributed capital from shareholders in the enterprises, long-term investment capital from organizations outside the enterprises, capital is invested from the State budget, and investment capital from abroad. The effective use of capital depends on many factors, in which labor productivity plays an important role. The obvious fact is that labor productivity comes from the workforce. Therefore, we also agree with Mill’s (Citation1829) point of view about capital. We then included a factor of capital, which comprises four exogenous variables: total annual operating capital of the business named as “annual capital”; total fixed assets and long-term investments named as “asset and long-term capital”; total investment from the State budget named as “State capital”; and total investment from abroad named as “abroad capital.”
Previous researches:
A simplified version of Cobb-Douglas has been developed, in which each household is provided with a fixed amount of capital (K) and a fixed amount of available time for labor (L). Each derives utility from the consumption of a synthetic product (X) Fullerton and Chi (Citation2019). According to (Florin Marius Pavelescua, Citation2014), “the practical use of the proposed analytical method for estimated returns to scale in the context of the Cobb-Douglas production function is applied in the case of the Romanian economy in the period 1960–1979.” Crop production in the southwest of Ethiopia shows a very vigorous process of replacing labor and has led the value of returns on the scale to be greater than 10.00 (Tadesse et al., Citation2021). By using the Cobb-Douglas stochastic boundary model, the results obtained show that the average level of technical efficiency of the participants in rural economic development in Bangladesh required training to improve technical efficiency and production level (Biswas et al., Citation2021). When adjusting for capital or labor, the terms convex and fixed costs have significant meanings for China’s industrial firms. At the same time, adjusting for the two inputs of capital and labor is related. Adjusting capital and labor simultaneously is more expensive than adjusting for the two inputs sequentially. In addition, removing the contradictions in adjusting both capital and labor would lead to a 1% increase in total factor productivity and a 7% increase in total aggregate output (Le Tang, Citation2022). Earnings in the cocoa industry are less than the current average hourly rate due to the increasing addition of labor input and capital investment in pest and disease management systems (Scudder et al., Citation2022). The service sector has seen an increase in capital value. The manufacturing process has been simplified. Advanced agriculture, mining, and construction are cutting the amount of required labor. It shows that rapid economic and technological transformation affects corporate investment in general and can affect labor demand and wage correlation in particular (David Wadley, Citation2021). Educated labor, intellectual labor tools, and managerial labor, all contribute to improving the quality and productivity of labor in all types of activities (Lokteva et al., Citation2022). In Sweden, social capital is positively related to the attainment of steady employment for job seekers who were initially unemployed. However, self-employment efficiency may contribute only slightly to how social capital affects labor market outcomes (Anton & Andersson, Citation2021). The substitution elasticity between capital and labor plays an important role in analyzing economic issues and government policies such as tax policy on the formation of business capital (Wemy, Citation2021). As capital becomes more abundant than labor along economic growth, it leads to a situation where low-skilled labor is replaced by capital, resulting in a faster increase in capital intensity (Chaoran Chen, Citation2020). Based on a collection of 3,186 estimates of elasticity reported in 121 studies, codifying 71 variables that reflect the context in which researchers produce their estimates; the conclusion is that the mean elasticity of large substitution between capital and conditional labor in the absence of problems is 0.3 (Gechert et al., Citation2022). The increase in activities that positively promote social capital has a positive impact on the multifactor productivity of gold mining in Colombia (Arturo Delgado Alvarez et al., Citation2014). In China, public investment has an impact on labor and employment in the transportation logistics industry (Zhang et al., Citation2017). Transportation logistics expands and develops to promote economic development and reshape the geospatial economic model (Duan et al., Citation2020).
By collecting, reviewing, and producing a structured literature review. We have tried to capture and synthesize information and knowledge from reputable and scientific data sources. Previous studies were related to capital, labor, and Cobb-Douglas formulation which have been published by reputable journals through reputable publishers. The literature review achieves certain findings and contributions both in theory and application. That is, the significance of these studies forms the basis of our research. Previous studies, on the other hand, are not directly related to transportation logistics and are not specific in terms of gender labor, trained labor, educated labor, annual operating capital, asset and long-term investment capital, state capital, or foreign capital. We are confident that our research fills these gaps in the literature.
3. Methodology
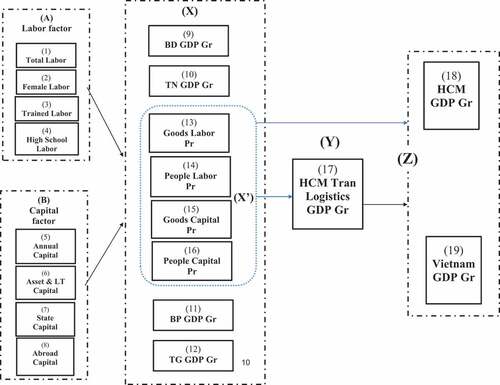
3.1. Study model
3.2. Formula of study model
The formula of the SEM study model is as follows:
From (1), (2), and (3), we have:
(A, B, X, X’, Y, z, e.X, e.Y, e.z) ∼ i.i.d. with mean vector μ and covariance matrix Σ where i.i.d. means that observations are independent and identically distributed.
We must appreciate that μ and Σ are estimated, just as ai, bi, x’i, yi. Some of the elements of Σ, however, are constrained to be 0; the element constrained is determined by the specification of the model (Stata Corp, Citation2021).
3.3. Explanation of variables in the study model
The SEM study model includes eight exogenous variables and eleven endogenous variables.
The eight exogenous variables include:
Total labor is the total number of employees of the transportation logistics industry (TLI) (person).
Female labor is the total number of female employees of TLI (person).
Trained labor is the total number of employees who have received vocational training of TLI (%).
High school labor is the total number of employees who have graduated from high school of TLI (%).
Annual capital is the total annual operating capital of the business of TLI (VND billion).
Asset and LT capital is the total fixed assets and long-term investment of TLI (VND billion).
State capital is the total investment from the State budget of TLI (VND billion).
Abroad capital is the total investment from abroad of TLI (US dollars thousand).
The eleven endogenous variables, including:
BD GDP Gr is the GDP growth of Binh Duong Province.
TN GDP Gr is the GDP growth of Tay Ninh Province.
BP GDP Gr is the GDP growth of Binh Phuoc Province.
TG GDP Gr is the GDP growth of Tien Giang Province.
Goods labor Pr is the goods productivity calculated on the total number of employees of TLI.
People labor Pr is the passenger productivity calculated on the total number of employees of TLI.
Goods capital Pr is the goods productivity calculated on total capital of TLI.
People capital Pr is the passenger productivity calculated on total capital of TLI.
HCM Tran logistics GDP Gr is the GDP growth of transportation logistics in HCM.
HCM GDP Gr is the GDP growth of HCM.
Vietnam GDP Gr is the GDP growth of Vietnam.
HCM City is Vietnam’s largest city and economic engine. HCM is one of the biggest and strongest cities in the southern key economic region of Vietnam. HCM is the area researched in this article.
Alongside HCM, Binh Duong, Tay Ninh, Binh Phuoc, and Tien Giang Provinces are four provinces in the southern key economic region of Vietnam.
Although the topic covers both labor and capital factors that affect the development of transportation logistics in HCM, however, from an economics perspective, transportation logistics does not exist and operate separately and independently within the area of HCM. Transportation logistics affects, governs, and is heavily influenced by the four provinces mentioned above, which are part of the southern key economic region of Vietnam.
3.4. Study hypothesis
H1:
(A) Labor factor and (B) Capital factor affect X factor
H2:
X’ factor affects Y factor and z factor
H3:
Y factor affects z factor
3.5. Data collect and methodology
3.5.1. Data collect
The statistical yearbook of HCM for variables (1), (2), (5), (6), (7), (8), (13), (14), (15), (16), (17), (18).
The statistical yearbook of Vietnam for variable (19).
The statistical yearbook of Binh Duong Province for variable (9).
The statistical yearbook of Tay Ninh province for variable (10).
The statistical yearbook of Binh Phuoc Province for variable (11).
The statistical yearbook of Tien Giang Province for variable (12).
The provincial competitiveness index of the Vietnam Chamber of Commerce and Industry and the United States Agency for International Development in Vietnam for variables (3) and (4).
The process and methodology for processing the SEM model included the first step of extracting secondary data from various sources, as mentioned above. The next step was to use 100% intact secondary data manually extracted from the first step without any processing stage. The data was then clearly presented in a Microsoft Excel file, and the Excel file containing the data was imported into Stata software. We did not need to process data, we used 100% intact data to build and develop a research model, including the relationships between endogenous variables and exogenous variables based on research objectives. The important issue is that we achieved SEM convergence, and the indicators of the five steps of SEM’s goodness of fit testing were reliable. Furthermore, the data used were secondary data that had been published by reputable and valuable sources. Therefore, we used the intact secondary data in order to reflect the study objectives and the practical context of the study’s area.
Methodology:
Descriptive statistics are presented, followed by collinearity/multicollinearity checking. This was followed by SEM’s estimation using observed information matrix (OIM) and expected information matrix (EIM) techniques. Finally, we applied five steps of SEM’s goodness of fit testing, which included root mean square error of approximation (RMSEA), coefficient of determination (CD), stability analysis of simultaneous systems, and the Wald test, and modification indices (MI).
Stata 17.0 (copyrighted by Statacorp, 4905 Lakeway Drive, College Station, Texas 77,845 USA.) was used for SEM analysis.
4. Data source
Annual time series data were carefully extracted and retrieved between the periods 2010 and 2021.
The data used in this study were obtained from the Statistics Department of Vietnam and HCM, as well as the Statistical Year Books of HCM, Vietnam, Binh Duong Province, Tay Ninh Province, Binh Phuoc Province, and Tien Giang Province. Also, data were obtained from the provincial competitiveness index of the Vietnam Chamber of Commerce and Industry and the United States Agency for International Development in Vietnam.
5. Study results
5.1. Summary of descriptive statistics of variables
Table is a summary of the descriptive statistics of the variables employed.
Table 1. Statistics summary of variables
5.2. Collinearity/multicollinearity
We created a multivariate regression model with eight independent exogenous variables, including total labor, female labor, trained labor, high school labor, annual capital, asset and long-term capital, state capital, and abroad capital, and one dependent endogenous variable from a group of eight endogenous variables that had a direct correlation with the eight independent exogenous variables mentioned above.
The results of multivariate regression are shown in Table .Table shows the average of the outcomes of the authors’ three multivariate regression analyses.
Table 2. Results of the Multivariate Regression
The results of the 1st multivariate regression are R-squared = 0.9842 and adjusted R-squared = 0.9419. The only variable that has VIF<10 is trained labor. The two variables from which the biggest VIF was removed are annual capital and female labor.
The results of the 2nd multivariate regression after removal of annual capital and female labor are R-squared = 0.9695, adjusted R-squared = 0.9330. There are three independent exogenous variables that have VIF>10; abroad capital with VIF = 50.12, high school labor with VIF = 43.32, asset and long-term capital with VIF = 11.67, and total labor with VIF = 10.56. They were all removed.
The results of the 3rd multivariate regression after removal of four variables, including abroad capital, high school labor, asset and long-term capital, and total labor are as follows: R-squared = 0.4305, adjusted R-squared = 0.3040. The VIFs of trained labor = 1.38, State capital = 1.38.
A common cutoff threshold, according to (Joseph et al., Citation2010), is a tolerance value of .10, which corresponds to a VIF value of 10. Thus, trained labor and State capital are the two independent exogenous variables selected for the next step, which is exploratory factor analysis.
5.3. Exploratory factor analysis (EFA) results
Table shows the results of the KMO analysis on ensuring the completeness of the sampling. The result shows that KMO = 0.5, a P-value of 0.05 indicates statistical significance.
Table 3. Kaiser-Meyer-Olkin (KMO) analysis results
In accordance with (Hair et al., Citation1995), and (Tabachnick & Fidell, Citation2001), KMO≥0.5 is considered appropriate.
Thus, the three observed variables in Table are consistent with the theory mentioned above.
Table shows the results of factor analysis and correlation. The method used was principal-component factors. From Table , it can be seen that Eigenvalues are greater than 1 at Factor 1. All factors stopped at 100% of the explained variance.
Table 4. Results of factor analysis and correlation
The total variance of the factor extracted that has Eigenvalues as greater than 1 is 0.7635 > 50%, showing that the two extracted factors explain 76.35% of the data variation of the five observed variables participating in the factor analysis.
According to K1 - Kaiser’s method (Kaiser, Citation1960), only structures with Eigenvalues greater than one (1) are kept for interpretation (Fabrigar et al., Citation1999; Gorsuch, Citation1983). Also, according to (Hair et al., Citation1995) and (Pett et al., Citation2003), factors should be stopped when at least 95% of the variance is explained.
Thus, the results are consistent with the theory mentioned above.
Table describes the results of the factor loading coefficient and unique variance: The results show that the magnitude of the factor loading coefficients for the two observed variables is the same, 0.8738. The factor loading coefficient shows the correlation between the observed variable and the factor.
Table 5. Wald test result
According to (Anderson & Gerbing, Citation1998; Hair et al., Citation1998, Citation2009), 0.3 ≤ factor loading≤0.4 is considered minimal, factor loading≥0.5 is considered to be of practical significance.
Thus, the results are consistent with the theory mentioned above.
5.4. SEM’s estimation results
Figure is the SEM’s depiction of estimates of two exogenous variables and eleven endogenous variables, according to the maximum likelihood estimation method. The results are shown in Appendix 1.
Figure 1. SEM’s estimation depiction.
The depiction illustrates the cause-and-effect relationships between exogenous variables and endogenous variables. Exogenous variables and endogenous variables are in the boxes, latent variables are in the circles.
The two exogenous variables included T_Labor (Trained labor), and S_Capital (State capital).
The eleven endogenous variables included GLaborP (goods labor productivity), PLaborP (passenger labor productivity), GcapitalP (goods capital productivity), PcapitalP (passenger capital productivity), BDGDPG (GDP growth of Binh Duong Province), TNGDPG (GDP growth of Tay Ninh Province), BPGDPG (GDP growth of Binh Phuoc Province), TGGDPG (GDP growth of Tien Giang Province), HCMTLogGDPG (GDP growth of transportation logistics in HCM), HCMGDPG (GDP growth of HCM), and VNGDPG (GDP growth of Vietnam).
Appendix A1 is the SEM estimation results processed by OIM and EIM techniques, showing the detailed results of the cause-and-effect relationships between three exogenous variables and eleven endogenous variables described in Figure :
1. The H1 hypothesis states that trained labor and State capital affect endogenous variables:
Direct effects:
First result: Trained labor positively affected goods labor productivity, passenger labor productivity, and the GDP growth of Tay Ninh Province.
Second result: State capital negatively affected the GDP growth of Tien Giang Province.
Indirect effects and total effects:
First, trained labor negatively affected the GDP growth of transportation logistics in HCM.
2. The H2 hypothesis states that goods labor productivity, passenger labor productivity, goods capital productivity, and passenger capital productivity affect the GDP growth of transportation logistics in HCM, the GDP growth of HCM, and the GDP growth of Vietnam.
Direct effects:
Firstly, passenger labor productivity negatively affected the GDP growth of transportation logistics in HCM.
Secondly, goods capital productivity positively affected the GDP growth of transportation logistics in HCM.
Thirdly, goods capital productivity and passenger capital productivity negatively affected the GDP growth of HCM.
Fourthly, goods labor productivity negatively affected the GDP growth of Vietnam.
Fifthly, passenger labor productivity positively affected the GDP growth of Vietnam.
Indirect effects:
Passenger labor productivity negatively affected the GDP growth of Vietnam.
Total effects:
Firstly, goods capital productivity positively affected the GDP growth of transportation logistics in HCM.
Secondly, passenger labor productivity negatively affected the GDP growth of transportation logistics in HCM.
The H3 hypothesis states that the GDP growth of transportation logistics in HCM affects the GDP growth of HCM and the GDP growth of Vietnam.
Direct effects and total effects:
The GDP growth of transportation logistics in HCM positively affected the GDP growth of Vietnam.
5.5. Testing the goodness of fit of SEM
5.5.1. Root mean square Error of approximation (RMSEA)
Table shows the RMSEA result of SEM: Probability RMSEA of SEM≤0.05, and confidence interval (CI) = 90%.
Table 6. RMSEA test result
(Browne & Cudeck, Citation1993) defined “close match” as an RMSEA value that is less than or equal to 0.05. According to (MacCallum et al., Citation1996), a 90% confidence interval (CI) around the point estimate allows an assessment of the accuracy of the RMSEA estimation. On the basis of CI, it can be said with a certain degree of confidence that the given interval contains the true value of the fit index for that model in the population.
Thus, this result satisfies the theory mentioned above.
5.5.2. The coefficient of determination (CD)
Table shows the result of the CD test of the SEM. It represents the amount of variability in the data that the model explains.
Table 7. CD test result
CD represents the amount of variability in the data that the model explains. In general, the closer the CD is to 1, the better the model is. CD < 0.19 is very weak, 0.19 ≤ CD < 0.33 is weak, 0.33 ≤ CD < 0.67 is moderate, CD ≥ 0.67 is significant (Chin, Citation1998). According to Hair et al. (Citation2011), CD < 0.25 is very weak, 0.25 ≤ CD < 0.50 is weak, 0.50 ≤ CD < 0.75 is moderate, CD ≥ 0.75 is significant.
The result of Table shows that the CD = 0.893 is significant and that it satisfies the theory mentioned above.
5.5.3. Stability analyses of simultaneous systems
The result of stability analyses of simultaneous systems. The result describes the Eigenvalue stability condition clearly with a stability index = 1.62e-06.
A non-recursive SEM is said to be stable if an SEM has an Eigenvalue approaching zero (0), an Eigenvalue equal to zero is perfectly stable (Katzman et al., Citation2021; Bela, Citation2006).
Thus, result of Table satisfies the theory mentioned above.
5.5.4. Wald test
Table shows the Wald test results for the equations. The result shows that the magnitudes of Chi square Δχ2 are quite large. Specifically, the Chi square of the GDP growth of transportation logistics in HCM = 1107.70, the Chi square of HCM’s GDP growth = 94.35, the Chi square of Vietnam’s GDP growth = 114.60.
P-values of almost all the variables are less than or equal to 5%, except for the P-value of goods capital productivity which is 0.4827, the P-value of passenger capital productivity which is 0.3413, the P-value of GDP growth of Binh Duong which is 0.1142, and the P-value of GDP growth of Binh Phuoc which is 0.4136.
However, the Wald test is asymptotically equivalent to the Chi-squared difference test (Δχ2) and does not require a redefinition of the model (Bollen, Citation1989).
Based on the theory mentioned above, we do not have a redefinition of the model.
5.5.5. Modification indices (MI)
The output of Stata software is written as “no modification indices to report, all MI values are less than 3.841458820694123”.
MI is the index that estimates the change of χ2 for each case of adding a possible relationship (corresponding to one degree of freedom). If , then allowing relationship hints increases the model’s goodness of fit. However, the researchers should be cautious because the relationship added to the model is only considered when it supports the theory, and they should not try everything to improve the indices to make the model more suitable (Hair et al., Citation1998; Topcu & Erdur-Baker, Citation2010).
In this case, we decided not to add any more relationships to the model.
6. Discussion
The two exogenous variables—trained labor and State capital—that were selected to run EFA have VIFs that are less than 2 (<2).
The results of the EFA analysis for the two exogenous variables (trained labor and State capital) are KMO = 0.5, the total variance of one extracted factor which has Eigenvalue greater than 1 is 0.7635 > 50%, the factor loading coefficients of the two observed variables have magnitudes that are the same = 0.8738.
Based on the results of collinearity/multicollinearity checking and EFA analysis, we selected the two exogenous variables to estimate SEM.
The SEM estimated using OIM and EIM techniques produced identical results regarding the interactions between exogenous and endogenous variables. The exogenous variables were the trained labor and the State capital.
6.1. The results of the effects of two exogenous variables on endogenous variables are as follows
Trained labor:
Trained labor totally positively and directly positively affected the goods labor productivity at a coefficient of 10.54529, totally positively and directly positively affected the passenger labor productivity at a coefficient of 10.44035, and totally positively and directly positively affected the GDP growth of Tay Ninh Province at a coefficient of 2.487214.
Trained labor indirectly negatively affected the GDP growth of transportation logistics in HCM at a coefficient of −102.3824.
State capital
State capital totally negatively and directly negatively affected the GDP growth of Tien Giang Province at a coefficient of −.0000653.
Besides, passenger labor productivity totally negatively and directly negatively affected the GDP growth of transportation logistics in HCM at a coefficient of −9.178089. Goods capital productivity and passenger capital productivity totally positively and directly positively affected the GDP growth of HCM at a coefficient of .9810097.
In addition, goods capital productivity and passenger capital productivity directly negatively affected the GDP growth of HCM at coefficients of −.3192912 and −3.533263, respectively. Passenger labor productivity, goods capital productivity, and passenger capital productivity totally negatively affected the GDP growth of HCM at coefficients of −.0371799, −.3825935, and −.2888562, respectively.
Moreover, goods labor productivity directly negatively affected the GDP growth of Vietnam at a coefficient of −.3363117. Passenger labor productivity directly positively affected the GDP growth of Vietnam at a coefficient of .7493375.
7. Conclusion
7.1. Theory
The study results show that trained labor positively affected goods labor productivity and passenger labor productivity. It seems that the paper supports the experimental study of Andaregiea et al. (Citation2020), who reported that the educational status of workers is variable and that this affects their productivity and economic efficiency.
7.2. Practicality
The first remarkable finding is that trained labor totally positively and directly positively affected the goods labor productivity and the passenger labor productivity.
The second remarkable finding is that State capital has no effect on goods labor productivity, passenger labor productivity, goods capital productivity, and passenger capital productivity.
The third remarkable finding is that while trained labor positively affected the growth of Tay Ninh Province, State capital negatively affected the growth of Tien Giang Province.
The fourth remarkable finding is that trained labor indirectly negatively affected the GDP growth of transportation logistics in HCM.
7.3. Implications
Based on the theory of capital, the study results, the discussion, and the conclusion, we would state the following implications for the government, transportation logistics policy makers, and managers:
Considerations, calculations, comparisons, and trade-offs are required for each case below:
Firstly, on the one hand, trained labor totally positively and directly positively affects goods labor productivity and passenger labor productivity, it positively affects the growth of Tay Ninh Province, and it indirectly negatively affects the GDP growth of transportation logistics in HCM.
On the other hand, passenger labor productivity totally negatively and directly negatively affects the GDP growth of transportation logistics in HCM, and goods labor productivity directly negatively affects the GDP growth of Vietnam.
Based on the direction of effects, the number of variables affected and that can be affected, and the magnitude of coefficients, our suggestion is that trained labor should be reduced to have an increase in the GDP growth of transportation logistics in HCM and allowing a reduction in the growth of Tay Ninh Province.
Secondly, State capital totally negatively and directly negatively affected the GDP growth of Tien Giang Province, our advice is that there should be a decrease in State capital to have an increase in the GDP growth of Tien Giang Province.
Limitations: The limitation of this study is the sample size. The data used is the annual time series data, which has been extracted manually between 2010–2021. The sample size covers 12 years only which we consider as significant limitation to this study. The reason for this small sample size is that Vietnam has been excluded from the US embargo since 1995. After 15 years of opening up and integrating the economy, since 2010, the statistical software systems of some provinces and cities in Vietnam and have not been working. We tried very hard to extract data from 10 data sources for a 12-year period from 2010–2021. The year 2022 data has not been released as at December 2022, so we could not obtain the year 2022 data. However, Vietnam’s economic period spans every 4 years, and the sample size of this paper is 12 year, it means we have data of 3 economic periods. For this reason, we believe that the 12-year sample size is temporarily acceptable in the context of Vietnam’s economy today.
Future study: We would study about the same subject with this article. However, we will collect the data by having questionnaires to survey the transportation logistics companies in Ho Chi Minh City, Vietnam.
Author contributions
Both authors contributed equally to the conception and design of the study.
Correction
This article has been corrected with minor changes. These changes do not impact the academic content of the article.
Acknowledgments
“This research is funded by University of Economics and Law, Vietnam National University Ho Chi Minh City / VNU-HCM.”
“We thank Dr. James Bleach, Dr. Susan Keron, and Dr. Graham Birley of the ōbex project for language editing support.”
And “We thank Edit Syndicate for English proofread and edited”.
Disclosure statement
We declare that we have no significant competing interests, including financial or non-financial, professional, or personal interests that interfer with the full and objective presentation of the work described in this manuscript.
We have described our financial and non-financial interests in the space below.
Data availability statement
The authors, Vu Thi Kim Hanh and Nguyen Hong Nga, collected and extracted the time series secondary data manually. The data is annual and spans the years 2010–2021. https://docs.google.com/spreadsheets/d/1CbuU5OZxS8mZls0Myp6lV_zrxiMg8bIJwFyM_CL6c8U/edit?usp=sharing.
Additional information
Funding
Notes on contributors

Vu Thi Kim Hanh
Vu Kim Thi Hanh Master of Trade, IELTS academic, TEFL Certificate, Japanese level which is equivalent to N3 University of Economics and Law, Ho Chi Minh City, Vietnam, Vietnam National University, Ho Chi Minh City, Vietnam, Transportation Logistics, Economics, 15 years working in international corporations in foreign trade, import and export, customs declaration, logistics, and international trade, University lecturer and PhD student.
Nguyen Hong Nga
Nguyen Hong Nga Associate Professor, Doctor of Economics, University of Economics and Law, Ho Chi Minh City, Vietnam Vietnam National University, Ho Chi Minh City, Vietnam.Economics, Transportation Logistics.
References
- Abu-Eisheh, S., Kuckshinrichs, W., & Dwaikat, A. (2020). Strategic planning for sustainable transportation in developing countries: the role of vehicles. Transportation Research Procedia, 48(2020), 3019–28. https://doi.org/10.1016/j.trpro.2020.08.184
- Andaregiea, A., Workua, A., & Astatkieb, T. (2020). Analysis of economic efficiency in charcoal production in Northwest Ethiopia: A Cobb-Douglas production frontier approach. Trees, Forests and People, 2(2020), 100020. https://doi.org/10.1016/j.tfp.2020.100020
- Anderson, J. C., & Gerbing, D. W. (1998). Structural Equation modeling in practice: a review and recommended two-step approach. Psychological Bulletin, 103(3), 411–423. https://doi.org/10.1037/0033-2909.103.3.411
- Anton, B. A. (2021, February). Social capital and self-efficacy in the process of youth entry into the labour market: Evidence from a longitudinal study in Sweden. Research in Social Stratification and Mobility, 71, 100580. https://doi.org/10.1016/j.rssm.2020.100580
- Arturo Delgado Alvarez, C., Arango Aramburo, S., & Romero Hernandez, A. (2014, September). A system approach to analyze the productivity of a Colombian gold mining process. Revista Facultad de Ingeniería Universidad de Antioquia, 72, 173–185.
- Bela, G. L. (2006). Process Control and Optimization (Vol. II). Taylor & Francis.
- Biswas, B., Mallick, B., Roy, A., & Sultana, z. (2021). Impact of agriculture extension services on technical efficiency of rural paddy farmers in southwest Bangladesh. Environmental Challenges, 5(2021), 100261. https://doi.org/10.1016/j.envc.2021.100261
- Bollen, K. A. (1989). Structural equations with latent variables. Wiley.
- Browne, M. W., & Cudeck, R. (1993). Alternative ways of assessing model fit. In K. A. Bollen & J. S. Long (Eds.), Testing structural equation models (p. pp. 136−162). Sage.
- Chaoran Chen. (2020, July). Capital-skill complementarity, sectoral labor productivity, and structural transformation. Journal of Economic Dynamics & Control. 116(2020), 103902. https://doi.org/10.1016/j.jedc.2020.103902
- Chin, W. W. (1998). The partial least squares approach to structural equation modeling. Modern Methods for Business Research, 295(2), 295–336.
- Dannenberg, A. L., Rodriguez, D. A., & Sandt, L. S. (2021). Advancing research in transportation and public health: A selection of twenty project ideas from a U.S. research roadmap. Journal of Transport & Health, 21, 101021. https://doi.org/10.1016/j.jth.2021.101021
- David Wadley. (2021). Technology, capital substitution and labor dynamics: Global workforce disruption in the 21st century? Futures. 132 September. 102802. https://doi.org/10.1016/j.futures.2021.102802.
- Duan, L., Sun, W., & Zheng, S. (2020). Transportation network and venture capital mobility: An analysis of air travel and high-speed rail in China. Journal of Transport Geography, 88, 102852. https://doi.org/10.1016/j.jtrangeo.2020.102852
- Eugen, V.B.B. (1890). Capital and Interest: A Critical History of Economic Theory. Macmillan and Co.
- Eugen, V.B.B. (1891). The positive theory of capital. G E Stechert & Co.
- Fabrigar, L. R., Wegener, D. T., MacCallum, R. C., & Strahan, E. J. (1999). Evaluating the use of exploratory factor analysis in psychological research. Psychological Methods, 4(3), 272–299. https://doi.org/10.1037/1082-989X.4.3.272
- Florin Marius Pavelescua. (2014). Methodological considerations regarding the estimated returns to scale in case of Cobb-Douglas production function. Procedia Economics and Finance, 8(2014), 535–542. https://doi.org/10.1016/S2212-5671(14)00125-7
- Fullerton, D., & Chi, L. T. (2019). Environmental policy on the back of an envelope: A Cobb-Douglas model is not just a teaching tool. Energy Economics, 84(2019), 104447. https://doi.org/10.1016/j.eneco.2019.07.007
- Gallen, C., & Winston, T. S. (2021). Transportation capital and its effects on the us economy: A general equilibrium approach. Journal of Macroeconomics, 103334, 103334. https://doi.org/10.1016/j.jmacro.2021.103334
- Gechert, S., Havranek, T., Irsova, z., & Kolcunova, D. (2022, July). Measuring capital-labor substitution: The importance of method choices and publication bias. Review of Economic Dynamics, 45 (2022), 55–82. https://doi.org/10.1016/j.red.2021.05.003
- German Cubas. (2016). Distortions, infrastructure, and female labor supply in developing countries. European Economic Review, 87(2016), 194–215. https://doi.org/10.1016/j.euroecorev.2016.05.006
- Ginters, E., Paulauskas, V., & Arturo Ruiz Estrada, M. (2019). ICTE in Transportation and Logistics 2018 (ICTE 2018). Procedia computer science, 149(2019), 1–2. https://doi.org/10.1016/j.procs.2019.01.099
- Gorsuch, R. (1983). Factor analysis (2nd ed.). Lawrence Erlbaum Associates.
- Hair, J. F., Jr., Anderson, R. E., Tatham, R. L., & Black, W. C. (1998). Multivariate Data Analysis with Readings. Prentice-Hall.
- Hair, J. F., Anderson, R. E., Tatham, R. L., & Black, W. C. (1995). Multivariate data analysis with readings (4 th ed.). Prentice-Hall.
- Hair, J. F., Ringle, C. M., & Sarstedt, M. (2011). PLS-SEM: Indeed a silver bullet. Journal of Marketing Theory and Practice, 19(2), 139–152. https://doi.org/10.2753/MTP1069-6679190202
- Hair, J. F., William, C. B., Barry, J. B., Rolph, E. A. (2009). Multivariate data analysis: A global perspective (7th edition) (pp. 761). Prentice Hall.
- Joseph, F., Jr, H., William, C., Black, B. J., & Barin, E. A. (2010). Multivariate Data Analysis (7th ed.). Pearson Prentice Hall.
- Kaiser, H. F. (1960). The application of electronic computers to factor analysis. Educational and Psychological Measurement, 20(1), 141–151. https://doi.org/10.1177/001316446002000116
- Katzman, D., Moreno, J., Noelanders, J., & Winston-Galant, M. (2021). Using Eigenvalues and Eigenvectors to Find Stability and Solve ODEs. University of Michigan. https://eng.libretexts.org/Bookshelves/Industrial_and_Systems_Engineering/Book%3A_ChemicalProcessDynamicsandControlsWoolf/10%3ADynamicalSystemsAnalysis/10.04%3A-Using-eigenvalues-andeigenvectorstofindstability_and_solve_ODEs#:~:text=If%20the%20two%20repeated%20eigenvalues,point%20is%20a%20stable%20sink
- Le Tang. (2022). The dynamic demand for capital and labor: Evidence from Chinese industrial firms. Economic Modelling. 107 February. 105731. https://doi.org/10.1016/j.econmod.2021.105731.
- Lewis, R., & Clark, B. Y. (2021). Retooling local transportation financing in a new mobility future. Transportation Research Interdisciplinary Perspectives, 10, 100388. https://doi.org/10.1016/j.trip.2021.100388
- Liu, M., Zhang, X., Mengya, Z., Yuqing, F., Yingjie, L., Jixin, W., & Liyuan, L. (2021). Influencing factors of carbon emissions in transportation industry based on CD function and LMDI decomposition model: China as an example. Environmental Impact Assessment Review, 90, 106623. https://doi.org/10.1016/j.eiar.2021.106623
- Lokteva, O., Zavyalov, A., Loktev, D., & Apattsev, V. (2022). Preservation of human capital by achieving the “zero” indicator in labor protection in transport. Transportation Research Procedia, 63(2022), 1847–1852. https://doi.org/10.1016/j.trpro.2022.06.203
- MacCallum, R. C., Browne, M. W., & Sugawara, H. M. (1996). Power analysis and determination of sample size for covariance structure modeling. Psychological Methods, 1(2), 130–149. https://doi.org/10.1037/1082-989X.1.2.130
- Mill, J., & Democracy, (1829). Analysis of the Phenomena of the Human Mind (pp. 280–328). Springer.
- Patricia, A. M., & Johnson, K. (2019). Female labor force participation in the us: how is immigration shaping recent trends? Social Science Research, 87, 102398. https://doi.org/10.1016/j.ssresearch.2019.102398
- Pett, M. A., Lackey, N. R., & Sullivan, J. J. (2003). Making Sense of Factor Analysis: The Use of Factor Analysis for Instrument Development in Health Care Research. SAGE Publications, Thousand Oaks. https://doi.org/10.4135/9781412984898
- Saure, P., & Hosny, z. (2014). International trade, the gender wage gap and female labor force participation. Journal of Development Economics, 111, 17–33. https://doi.org/10.1016/j.jdeveco.2014.07.003
- Scudder, M., Wampe, N., Waviki, z., Applegate, G., & Herbohn, J. (2022). Smallholder cocoa agroforestry systems; is increased yield worth the labour and capital inputs? Agricultural Systems, 196(2022), 103350. https://doi.org/10.1016/j.agsy.2021.103350
- Stata Corp. (2021). Stata: Release 17. Statistical Software. StataCorp LLC.
- Tabachnick, & Linda, S. F. (2001). Using Multivariate Statistics (Fourth Edition ed.). Allyn & Bacon.
- Tadesse, B., Tilahun, Y., Bekele, T., & Mekonen, G. (2021). Assessment of challenges of crop production and marketing in bench-sheko, kaffa, sheka, and west-omo zones of southwest Ethiopia. Heliyon, 7(6), e07319. https://doi.org/10.1016/j.heliyon.2021.e07319
- Topcu, Ç., & Erdur-Baker, Ö. (2010). The revised cyber bullying inventory (RCBI): Validity and reliability studies. Procedia - Social and Behavioral Sciences, 5, 660–664. https://doi.org/10.1016/j.sbspro.2010.07.161
- Wemy, E. (2021, April). Capital-labor substitution elasticity: A simulated method of moments approach. Economic Modelling, 97, 14–44. https://doi.org/10.1016/j.econmod.2020.12.022
- Zhang, X., Wan, G., & Wang, X. (2017). Road infrastructure and the share of labor income: Evidence from China’s manufacturing sector. Economic Systems, 41(4), 513–523. https://doi.org/10.1016/j.ecosys.2017.08.001
Appendix
Table A1. The SEM estimation result of direct effects, indirect effects, and total effects was processed by the expected information matrix (EIM) technique
Appendix 1 is the result of direct effects, indirect effects, and total effects of SEM estimation processed by EIM, showing the detail of the result of the cause-and-effect relationships between two exogenous variables and eleven endogenous variables, as described in Figure .
There are two exogenous variables, which included trained labor and State capital.
There are eleven endogenous variables, which included goods labor productivity, passenger labor productivity, goods capital productivity, passenger capital productivity, Binh Duong’s GDP growth, Tay Ninh’s GDP growth, Binh Phuoc’s GDP growth, Tien Giang’s GDP growth, GDP growth of transportation logistics in HCM, HCM’s GDP growth, and Vietnam’s GDP growth.