
 ?Mathematical formulae have been encoded as MathML and are displayed in this HTML version using MathJax in order to improve their display. Uncheck the box to turn MathJax off. This feature requires Javascript. Click on a formula to zoom.
Abstract
The study uses wavelet power spectrum and wavelet coherence transformation methodologies to examine how geopolitical risk affected the returns on stocks, oil, and gold during the GFC, COVID-19, and Russia-Ukraine war-three disruptive events that affected the world’s financial markets. For better diversification benefits during the turbulent times, we further investigate the degree of co-movement in frequency and time domains. We observe that GPR has high variations during Russia-Ukraine war period compared to COVID-19 period and is shown to have least variation during the GFC period. WTI crude oil and DJGI indexes are observed to have high variations during GFC, and COVID-19 periods followed by Russia-Ukraine war. We further observe that GOLD offers better diversification opportunity as well as leading movement against WTI and DJGI during disruptive events in financial markets. The results provide new understanding of how geopolitical risk affects financial assets for international investors, fund managers, and regulators, which would further aid to find risky and safer haven possibilities during the turmoil periods.
PUBLIC INTEREST STATEMENT
The recent crises such as the COVID-19 pandemic, oil price fluctuations and Russia invasion of Ukraine have affected the financial market globally. The study makes an honest attempt to investigate the impact of geopolitical risk (GPR) on crude oil, gold and stock returns and compare the effect during the period of three major disruptive events namely – Global financial crisis (GFC), COVID-19 and Russia-Ukraine war. We observe that GPR has high variations during Russia-Ukraine war period compared to COVID-19 period and is shown to have least variation during the GFC period. WTI crude oil, and DJGI indexes are observed to have high variations during GFC, and COVID-19 periods followed by Russia-Ukraine war. This study is important for policy makers, portfolio managers, and investors in identifying better diversification opportunities and devise strategies to minimize the risk of the portfolio during the turmoil periods in global perspectives.
1. Introduction
Uncertainty caused due to the recent pandemic has already created rumpus in the global financial markets (Liu et al., Citation2022; Salisu & Shaik, Citation2022; Salisu & Sikiru, Citation2020; Shaik, Citation2022, Citation2022; Singh & Shaik, Citation2021). In addition, a number of geopolitical tensions have sparked wild fluctuations in crude oil prices, gold, and equity markets in recent years (Qian et al., Citation2022; Umar et al., Citation2022). As a result, geopolitical risk (GPR) has overtaken economic risk to become the most important factor driving worldwide financial health.
In this research, we investigate the impact of geopolitical risk on crude oil, gold and stock returns and compare the effect during the period of three major disruptive events namely—Global financial crisis (GFC), COVID-19 and Russia-Ukraine war. We use the Geopolitical Risk index (GPR) proposed by Caldara and Iacoviello (Citation2022), a monthly indicator that precisely tracks the time and degree of rising geopolitical risk based on a count of newspaper articlesFootnote1 discussing geopolitical tensions. The study incorporates the wavelet methodology to understand the impact of the selected variables and the degree of co movement at different time frequency domains. To the best of our knowledge this is the first study to investigate the effect of GPR on the crude oil, gold, and stock returns using wavelet techniques. This study is important for policy makers, portfolio managers, and investors in identifying better diversification opportunities and devise strategies to minimize the risk of the portfolio during the turmoil periods in global perspectives.
There are many studies that investigate the impacts of events such as elections, governmental changes, political upheavals, civil strife, and terrorist attacks on economic and financial performances (Antonakakis et al., Citation2014; Balcilar et al., Citation2018; Bouri et al., Citation2018; Qadan & Idilbi-Bayaa, Citation2020; Qadan & Nama, Citation2018). Most of these studies have documented that the effects of such events on stock market returns are negative. To harness the power of oil, a succession of worldwide crises and wars have risen GPR, including the Iran-Iraq War, the Gulf War, and the Libyan War, all of which had substantial effects on oil prices (Ji & Guo, Citation2015). The global GPR fluctuates owing to changes in oil prices when there is a clear conflict or injustice that is prone to causing a war (Kuhn & Weidmann, Citation2015). Thus, it is clear that understanding the effect of geopolitical risks on oil is imperative. Given gold’s status as a safe haven asset in general and against financial turmoil in particular we hypothesize that it is also a hedge against global geopolitical risks. Li et al. (Citation2021) find evidence that gold is also used as an instrument to hedge against rise in geopolitical risk (GPR).
This paper contributes to the literature by analyzing the impact of geopolitical risk on stock markets, oil, and gold returns during the period from January 2007 to April 2022 which covers the three major disruptive events in financial markets. To capture the performance of the global stock markets, we use Dow Jones Global Index (DJGI) as a proxy which aims to provide 95% market capitalization coverage of stocks globally,Footnote2 including developed and emerging regions. We use West Texas Intermediate (WTI) crude oil prices and gold prices for the empirical analysis. We use the wavelet power spectrum and wavelet coherence transformation approaches for investigating the impact of geopolitical risk and further examine the co-movement between the variables for better diversification opportunities.
The main findings of this research show that GPR has high variations during Russia-Ukraine war period compared to COVID-19 period and is shown to have the least variation during the GFC period. WTI crude oil and DJGI indexes are observed to have high variations during GFC and COVID-19 periods followed by the Russia-Ukraine war. GOLD is shown to be resilient and remains to be a safe haven asset during these major disruptive events. Further, between GPR and WTI, we observe that GPR is leading and has high correlations during COVID-19 and Russia-Ukraine war period. In case of GPR and DJGI, we find strong correlations and find that DJGI is leading GPR during GFC, COVID-19, and also during Russia-Ukraine war. We further observe that GOLD offers better diversification opportunity as well as leading movement against WTI and DJGI during disruptive events in financial markets.
The remainder of this paper is structured as follows: Section 1 discusses the literature review and Section 2 describes the data & methodology. In Section 3, we discuss the empirical analysis followed by Section 4 which summarizes the main findings and provides concluding remarks.
2. Literature review
As the world economy was still reeling from the effects of the economic shock created by the COVID-19 pandemic, the recent attack by Russia on Ukraine has created another panic in the market including equity and commodity markets. The recent attack (2022) in Ukraine created yet another supply chain disruption resulting in the rise in prices of both the commodities and equity. The impact of the latest war between Russia and Ukraine is inevitable on the world economy as Russia is the world’s third largest producer of oil and heavily relies on the export of metals, gas, and mining. In the last 15 years, the world has witnessed three major crises viz, the global financial crisis of 2008, COVID-19 pandemic, and Russia-Ukraine war. In the following section we review the relevant studies on the impact of Geo-Political Risk on Stocks, Oil, and Gold Returns during GFC, COVID-19, and Russia-Ukraine War.
Kanjilal and Ghosh (Citation2017) analyzed the dynamics of gold and equity prices post global financial crisis of 2008 and concluded that the relationship between gold and oil prices is non-linear and asymmetric. The study further concluded that the investors could switch between the gold and oil investment to diversify the portfolio risk. Similar findings were obtained by (Maghyereh et al., Citation2017; Mensi et al., Citation2018; Mollick & Assefa, Citation2013; Morales & Andreosso O’callaghan, Citation2014; Qadan, Citation2019; Sinlapates et al., Citation2021). The relationship between gold and oil does not remain constant forever as it is more of a regime dependent and hence changes over time (Mensi et al., Citation2018).
Recently the relationship between equity, oil and gold prices have enthralled many researchers primarily due to wild fluctuations in commodity and equity prices caused by a series of crises (Atif et al., Citation2022; Naeem, Rabbani, et al., Citation2021). Gold and oil are important because besides their physical utility they are important economic indicators, highly liquid and account for the largest share in commodity trade (Dharani et al., Citation2022). There is a general belief that commodity markets react strongly and quickly to the geo-political tensions (Rabbani et al., Citation2021). Similar wild fluctuations were witnessed in commodity and equity prices during the global financial crisis of 2008, Covid-19, and Russia-Ukraine war as are observed due to shocks in macroeconomic indicators such as, inflation, market rate of interest and exchange rate (Adekoya et al., Citation2022; Zhou et al., Citation2022).
Historically, the empirical evidence suggests that the prices of equity, gold and oil have shown solid close connections over the years and reacted strongly to the geo-political tensions (Maghyereh et al., Citation2017; Morales & Andreosso O’callaghan, Citation2014). For instance, the equity market crashed during the financial crisis of 2008 and the same crash was witnessed during the COVID-19 pandemic during March 2020 when the market fell by 26% in just four days due to the government’s knee-jerk response to the pandemic (Hassan et al., Citation2020; Miah et al., Citation2021). Similarly, the on-going Russia Ukraine war has created a situation where investors are looking for safe haven investments in the form of gold and oil and it is expected that the prices might go higher (Adekoya et al., Citation2022; Zhou et al., Citation2022).
The price movements of gold, equity and oil have important economic and financial implications (Abdulla & Rabbani, Citation2021; Alawi et al., Citation2022). The impact of price changes in equity, gold and oil is directly reflected in the investment, consumption, industrial production, and portfolio management (Rabbani et al., Citation2022). Price changes in the equity market are of crucial importance to the investors as investors gain from the price movement and it is a vital indicator of growth of the shareholders’ wealth (Choudhury & Daly, Citation2021; Hassan et al., Citation2021; Kinateder et al., Citation2021). Price movement in commodity markets including gold and oil has important insinuations for the investors as price change is the only way by which investors gain from commodity trading (Akhtaruzzaman et al., Citation2021; Bekiros et al., Citation2017; Boubaker et al., Citation2018). Most often, the investors opt for gold as a refuge against unprecedented situations and hyper-inflation (Bekiros et al., Citation2017), due to its store of value function (Disli et al., Citation2021; Salisu et al., Citation2021; Shahzad et al., Citation2020). The investors often switch between equity, gold and oil or invest in combination to minimize the risk by diversifying their portfolio (Demir & Danisman, Citation2021; Naeem, Sehrish, et al., Citation2021). This paper contributes to the existing literature in understanding the impact of geopolitical risk on financial assets like stocks, oil, and gold returns during the periods of major financial turmoil’s like GFC, COVID-19, and the Russian-Ukraine war.
3. Methodology
3.1 Data
The data for this research is extracted from Thomson Reuter DataStream and it covers the period from January 2007 to April 2022. The period of study covers the major disruptions in financial markets namely, GFC (2008–2009), COVID-19 (2020–2021), and Russia-Ukraine War (2022).
We use Geopolitical Risk (GPR) index developed by Caldara and Iacoviello (Citation2022) definedFootnote3 as the risk associated with wars, terrorist acts, and tensions between the states that affect the normal and peaceful course of international relations. GPR increases correspond to well-known historical events such as military operations, terrorist attacks, and periods of international conflict. The indexing measurement is based on the methodology proposed by Saiz and Simonsohn (Citation2013) and Baker et al. (Citation2016). It is based on an algorithm that measures the frequency of articles about geopolitical threats in the most widely circulated foreign newspapers in the United States, the United Kingdom, and Canada. The index measures the percentage of news items mentioning geopolitical risk in each month, normalized to a value of 100 for the 2000–09 decade. A score of 300 indicates that in that month, newspaper mentions of increased geopolitical danger were thrice as common as the 2000s average.
To capture the performance of the global stock markets, we use Dow Jones Global Index (DJGI) as a proxy for stocks which aims to provide 95% market capitalization coverage of stocks globally, including both the developed and the emerging regions. We use West Texas Intermediate (WTI) crude oil, and gold monthly price series data for this study.
3.2 Model specification
The present study specified its model using the return form. We have used continuously compounded returns for all the variables. Hence, the popular return transformation process is applied, that is, log of the current period’s value (Pt) divided by log of the previous months’ value (Pt-1). The above-mentioned return form formula is as follows:
Here, Rt denotes the return index, Pt and Pt-1 indicate the present and previous months’ prices, respectively. To investigate the geopolitical risk on crude oil, gold, and Dow jones global stock indices, we apply wavelet approach. Wavelet has been widely used as a dynamic econometric approach in recent years (Vukovic et al., Citation2021). It is not only famous for image and signal processing in physics and engineering departments but also widely applicable in finance literature. Along with the signal processing properties, it critically investigates the time-frequency domain characteristics in time series data. Notably, the focus of this approach is to measure a significant level of dependency in multi-stage properties. This method can decompose data into different scales. Therefore, it can bring vigorous outcomes not revealed by time series techniques (Ferrer et al., Citation2016). In addition, time-frequency-based properties help to understand higher (lower) scales properties in a better way (Naeem, Rabbani, et al., Citation2021). This technique, moreover, is suitable to overcome the stationarity problem in time series data (Antonakakis et al., Citation2018). Notably, it is run by a small wave that grows and declines over time. The functions of wavelet are as follows:
Where, s and denote the length and position of the parameter respectively. In other words, the normalization dynamic is denoted by s, and the frequency-scale relationship is denoted by
. Furthermore, the Morlet-based wavelet is used in this study, which explains the father (smoothest) and mother (details) functions of the wavelet family. These functions are frequently used in economics and finance literature due to their significant implications from practical as well as theoretical standpoints (Reboredo et al., Citation2017). The mathematical specification of this method is as follows:
Where, 4π1/4 depicts the energy of wavelet that is known as a band and central frequency. ϖο states to the localizations that keep the balance between frequency and time. Moreover, e−t2/2 directs the Gaussian envelope, and eiϖοt shows a complex wavelet analytic. The wavelet approach comprises two areas, that is, the Continuous Wavelet Transformation (CWT) and Discrete Wavelet Transformation (DWT) techniques. CWT is more popular and widely applied technique that provides very simple colorful orientation. CWT is known as a multi-solution-based approach for contraction and dilatation, while DWT is known as a multiresolution-based approach for data decomposition and re-composition (Sharif et al., Citation2020).
Where, Ψ represents the function of details (mother) wavelet and * describes the complex link among the functions. Moreover, τ signifies the transformation of the parameter and denotes the scales of the parameter.
Coherence for wavelets is defined as follows:
Here, R2 presents the wavelets coherence, S contains the smoothing operator.
4. Empirical results and discussion
4.1 Preliminary analysis
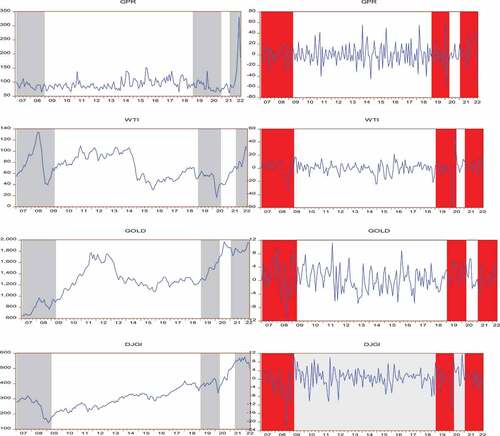
Figure displays the price and return series of geopolitical risk index (GPR) and crude oil (WTI), gold (GOLD) and stock price (DJGI). The price movement is expressed in terms of US dollar. We highlight the regions of GFC, COVID-19, and Russia-Ukraine war periods in black and red color bars for price and return movements respectively. We observe that the GFC, COVID-19 pandemic and Russia-Ukraine war have a significant impact on all the variables during the study period.
Figure 1. Geopolitical risk index, crude oil, gold, and stock index price performance and return movement.
4.2 Summary for descriptive statistics
Table presents the summary of descriptive statistics of the return series for the period from January 2007 to April 2022. The results show that GOLD has the highest mean return with a value of 0.61 and WTI has the highest amount of risk (highest standard deviation with a value of 11.61). We observe that WTI and DJGI have negative skewness while GOLD exhibit positive skewness. Negative skewness indicates an asymmetric distribution with an extended tail toward the left, whereas positive skewness denotes an asymmetric distribution with a longer right-hand tail. Kurtosis, on the other hand, measures how fat distribution is and the value of 3.00 represents the normal distribution. Furthermore, a leptokurtic (peaked) distribution has a kurtosis value larger than 3.00, and a platykurtic (flat) distribution has a value less than 3.00. We observe that all the return series are leptokurtic in nature. In addition, the Jarque-Bera statistics indicate that the normal distribution assumption is rejected for all series at 1% significance level. The Augmented Dicky Fuller (ADF) analysis is conducted for unit root testing. The results reveal that null hypothesis of a unit-root cannot be rejected in all cases in levels at 1% significance level. This indicates that all variables are stationary in levels. Further, correlation matrix is shown in Table . The results report that GOLD is highly correlated and DJGI is least correlated with GPR. We observe that there is a negative correlation between DJGI and GOLD. Further, we find that there is a positive correlation between WTI and GOLD and between WTI and DJGI.
Table 1. Summary of descriptive statistics
Table 2. Correlation Matrix
4.2 Wavelet power spectrum (WPS)
We use the continuous wavelet transformation (CWT) approach in this study. The horizontal and vertical axes represent time and frequency band scales respectively. The study covers the period from 2007 to 2022. The time span corresponding to 50–150 days represents the following time periods—50/(2007–2011), 100/(2012–2016) and 150/(2017–2022. Further, we can divide the scales into three different holding period such as (i) 2–16 scale that indicate the short-term holding period (ii) 16–32 scale that refer to the mid-term holding period and (iii) 32–64 scale that relate to the long-term holding period.
Figure exhibits the wavelet power spectrum (WPS) result using red and blue color regions. Particularly, WPS measures the variance of economic series using both time and frequency-based components (Dahir et al., Citation2018; Dewandaru et al., Citation2017). Blue regions indicate low variation, red regions indicate high-intensity or variations among the series, whereas green regions indicate no variation. A thick contour exhibits 5% significance level on the estimation of Monte Carlo simulations that randomized surrogate time series. WPS for GPR mainly shows four regions of high variations (red contour region) in the plot namely: (i) in short-term holding period (i.e., between 2–16 scales) and 50-day scale corresponding to the year 2011 (representing the Arab Spring: Syrian & Libyan war) (ii) in short-term holding period (i.e., between 2–16 scales) and 80–100 day scale corresponding to the years 2013 to 2015 (representing the events like Syrian Civil War escalation (2013), Russia annexes Crimea (2014), and ISIS escalation (2015)) (iii) in short-term holding period (i.e., between 2–16 scales) and 150-day scale corresponding to the year 2020 (representing the COVID-19 pandemic period) (iv) in short-term to medium-term holding period (i.e., between 2–16 scales and 32–64 scales) and above 150-day scale corresponding to the year 2022 (representing the Russia-Ukraine war). Clearly, the plot reveals that among the four high variations of the WPS for GPR plot, the Russia-Ukraine war is observed to have high intensity variations. The global financial crisis period (2007–2009) is observed to have very low variations on GPR index in the short to medium term holding periods.
Figure 2. Wavelet power spectrum. GPR, WTI, DJGI stands for Geo-Political Risk index, West Texas Intermediate crude oil price and Dow Jones Global Index respectively.
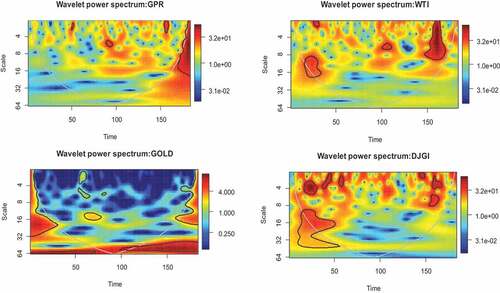
Further WPS spectrum plot for WTI has three regions of high variations (red contour region) in the plot namely: (i) in short-term holding period (i.e., between 2–16 scales) and 20–30 day scale corresponding to the years 2008–2009 (representing the Global Financial Crisis period) (ii) in short-term holding period (i.e., between 2–16 scales) and 100–110 day scale corresponding to the years 2016 to 2017 (iii) in short-term holding period (i.e., between 2–16 scales) and above 150-day scale corresponding to the year 2021–2022 (representing the COVID-19 pandemic period and Russia-Ukraine war). Moreover, the WPS spectrum plot of GOLD is clearly observed to have low variations (blue regions) during major disruptive events in financial markets like GFC, COVID-19, Russia-Ukraine war, and others. The WPS spectrum for DJGI is observed to have high variations during the periods of GFC (2008–2010) in short, medium, and long-term holding periods. The DJGI is also observed to have high variations (red contour regions) during the pandemic period of 2020–2021and medium variations during the period of Russia-Ukraine war, 2022.
Overall, from the WPS spectrum plot analysis, we observe that GPR has high variations during Russia-Ukraine war period compared to COVID-19 period and is shown to have least variation during the GFC period. In contrast, WTI crude oil, and DJGI indexes are observed to have high variations during GFC, and COVID-19 periods followed by Russia-Ukraine war. It is also observed that WTI is affected mostly by COVID-19 compared to GFC period, whereas in case of DJGI, GFC is shown to have medium to long period impact compared to a short-term impact of COVID-19. However, the GOLD is shown to be resilient and remains to be a safe haven asset during these major disruptive events.
The global economy has been facing geopolitical shocks, commodity price volatility and stock price slump in recent years (Sharif et al., Citation2020). These consequences will likely cause an economic downturn in the long run and drive the world economy into the next recession (Duan et al., Citation2021; Uddin et al., Citation2021). However, GFC and COVID-19 and Russia-Ukraine crises were the major disruptive episodes that causing unprecedented effect in all over world (Youssef et al., Citation2021). These crises have different variations due to the different causes, consequences, nature and structural break system (Nalban & Smădu, Citation2021). Moreover, geopolitical risk, assets class and time-frequency domain properties also play a vital role for responding the shocks during the turmoil period (Bouri et al., Citation2021). For example, oil price variation is positively associated with geopolitical risk, whereas, the global stock price index does not respond in a similarly profound way in terms of mean return and variability (Antonakakis et al., Citation2017; Smales, Citation2021).
4.3 Wavelet coherence transformation (WCT)
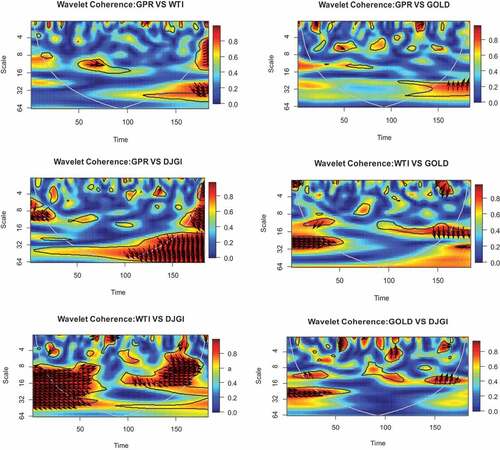
To examine the effect of GPR on WTI, GOLD and DJGI, we plot the findings of wavelet coherence for the pairs—GPR vs WTI, GPR vs GOLD and GPR vs DJGI in Figure along with the wavelet coherence plots between WTI vs GOLD, WTI vs DJGI and GOLD vs DJGI for examining the degree of co-movement and lead-lag relationship. Degree of co-movement is important for investors and fund managers for taking investment and asset allocation decisions. Red regions indicate the strong co-movement and blue regions depict the low-level co-movement and better portfolio diversifications benefits (Cui et al., Citation2021; Ourir et al., Citation2021). The red islands at the bottom (top) of the wavelet coherence plot indicate a strong correlation at low (high) frequency. On the other hand, the top (bottom) blue Island indicates a lower correlation at high (low) frequency.
Figure 3. Wavelet coherence plots. Here, GPR, WTI and DJGI stands for Geo-Political Risk index, West Texas Intermediate crude oil price and Dow Jones Global Index respectively.
Moreover, Wavelet coherence is a very popular and widely used color code-based technique, which interprets the degree of co-movement between two-time series. The presence of the red region at the left-hand side in the plot examined the significant level of co-movement between the two variables. It is worth noting that the decomposition of time series data is the decomposition of the signal into a set of coefficients. However, each set is associated with a spatial scale and each element of this set is linked with a specific location (Mensi et al., Citation2018, Citation2020).
Figure exhibits the results of wavelet coherency that explain the strength of correlation between two time series. It justifies the importance of this methodology to determine the co-movement and lead-lag relationship in terms of time and scales domain properties (Ftiti et al., Citation2016; Owusu Junior et al., Citation2017; Sun & Xu, Citation2018). The results indicate a significant higher correlation between GPR and WTI above 150-time scale (representing the COVID-19 and Russia-Ukraine war periods). In case of GPR and GOLD, we observe lower correlation during short-term and medium-term holding periods, whereas between GPR and DJGI, we observe very strong correlations during global financial crisis (2007–2009), COVID-19, and during Russia-Ukraine war. These findings suggest that DJGI and WTI are strongly correlated with GPR, while, relatively lower level of correlation is exist between Gold and GPR during the major disruptive events.
However, the above figure also illustrates the phase differences between GPR vs WTI, GPR vs GOLD and GPR vs DJGI in frequency and time domain properties. The significant differences between two series are detected by the trend of the arrow. The right and left arrow points out when two variables (GPR vs WTI, GPR vs Gold or GPR vs DJGI) are in same movement or direction. Right pointing up-ward arrow and left-pointing down-wards arrows indicate first variables that is GPR is leading while left-pointing up-ward arrow and right-pointing down-wards arrows indicates second variables that is WTI is leading and first variable GPR is lagging.
The findings suggest that between GPR vs WTI, GPR is leading during Syrian & Libyan war (2011) and also during Russia-Ukraine war (2022) in the long-term holding period. Between GPR vs DJGI, we observe that DJGI is leading GPR during global financial crisis (2007–2009), COVID-19 (2020–2021), and also during Russia-Ukraine war (2022). We further observe that GOLD offers better portfolio diversification benefits against WTI and DJGI. We observe WTI and DJGI to have higher co-movement and hence low portfolio diversification benefit during Russian-Ukraine war period compared to GFC and COVID-19 periods.
5. Conclusion
The study investigates the impact of geopolitical risk on crude oil, gold and stock returns using wavelet power spectrum and wavelet coherence transformation analysis to understand the impact during GFC, COVID-19, and Russia-Ukraine war.
We compare the effects of major events like GFC, COVID-19 and ongoing the Russia-Ukraine conflict between equities and commodities using wavelet-based power spectrum and coherence tools. These tools are very popular for determining variances, co-movement and lead-lag relationship (Kirikkaleli & Güngör, 20121; Maghyereh et al., Citation2019; Qiao et al., Citation2020)
In this study, we observe that GPR has high variations during Russia-Ukraine war period as compared to COVID-19 period and is shown to have least variation during the GFC period. WTI crude oil and DJGI indexes are observed to have high variations during GFC and COVID-19 periods followed by Russia-Ukraine war. GOLD is shown to be resilient and remains to be a safe haven asset during these massive disruptive events. We observe that during the periods of COVID-19 and Russia-Ukraine war, there is a strong correlation between GPR and WTI; in addition, GPR leads WTI during these periods. GPR and DJGI are also found to be strongly correlated; additionally, we observe that DJGI is leading GPR during the periods of GFC, COVID-19, and also during Russia-Ukraine war. We further observe that GOLD offers better diversification opportunity and leads movements in WTI and DJGI during disruptive events in financial markets.
The research contributes to the existing literature in understanding the interlinkages between the major financial assets like oil, gold, and stock indices and how the Geopolitical risk impact the co movement especially during the periods of uncertainty using the wavelet methodology. We provide evidence that impact of Geopolitical risk indeed varies across time and that their direction and magnitude is closely related to global economic developments. The implications provide new information for global investors, fund managers, and regulators in response to a better understanding of the impact of geopolitical risk on financial assets, which will aid in identifying risky and safer haven possibilities during times of major instability. Our findings are important to investors and portfolio managers who have positions in oil, gold, and stocks and thus need to adjust their holdings according to Geopolitical risks and uncertain global financial events.
Examining the consequences of oil price shocks on gold, stock markets, and other specific financial assets, as opposed to the overall effects on stock indexes, may be an attractive direction for future research. The unique peculiarities of the industrial sectors could be hidden by overall stock market indices. A fascinating topic for additional study is the effects of Geopolitical risk on oil price shocks, and other financial assets, such as currency rates and commodity price indices, such as industrial metals or agricultural commodities, that are included in investment portfolios.
Disclosure statement
We don’t have any conflict of interest to declare.
Additional information
Funding
Notes on contributors

Mustafa Raza Rabbani
Mustafa Raza Rabbani holds a Ph.D. in Banking and Financial Services from the prestigious Jamia Millia Islamia University, New Delhi, India. Dr. Rabbani is a passionate researcher and in the last 2 years he has published more than 30 peer-reviewed research papers in the international journal of repute published by Emerald, Elsevier, Springer, Indesrscience, and indexed in Scopus, Web of Science (WoS) and ABDC listed, etc. He is serving as an Associate Professor of Accounting and Finance at the British University of Bahrain. His work has been published in a variety of international journals including Energy Economics, Annals of Operations Research, Research in International Business and Finance (RIBAF), Cogent Economics and Finance, Journal of Islamic and Middle eastern Finance and Management, Journal of Islamic Accounting and Business Research, Heliyon Business and Economics, Environmental Science and Pollution Research, Economic Research.
Notes
1. The list of newspapers include: The Boston Globe, Chicago Tribune, The Daily Telegraph, Financial Times, The Globe and Mail, The Guardian, Los Angeles Times, The New York Times, The Times, The Wall Street Journal, and the Washington Post.
2. The index includes 8125 number of constituent stocks. The top 10 constituent stocks by index weight are Apple Inc, Microsoft Corp, Amazon.com Inc, Alphabet Inc A, Tesla Inc, Alphabet Inc C, Berkshire Hathaway B, Johnson & Johnson, Unitedhealth Group Inc, and Nvidia Corp.
3. Data downloaded from https://www.matteoiacoviello.com/gpr.htm on April 29, 2022.
References
- Abdulla, Y., & Rabbani, M. R. (2021). COVID-19 and GCC islamic market indices. 2021 International Conference on Sustainable Islamic Business and Finance, 56–14. University of Bharain, Sakhir, Bahrain.
- Adekoya, O. B., Oliyide, J. A., Yaya, O. S., & Al-Faryan, M. A. S. (2022). Does oil connect differently with prominent assets during war? Analysis of intra-day data during the Russia-Ukraine saga. Resources Policy, 77, 102728. https://doi.org/10.1016/j.resourpol.2022.102728
- Akhtaruzzaman, M., Boubaker, S., & Sensoy, A. (2021). Financial contagion during COVID–19 crisis. Finance Research Letters, 38, 101604. https://doi.org/10.1016/j.frl.2020.101604
- Alawi, S. M., Karim, S., Meero, A. A., Rabbani, M. R., & Naeem, M. A. (2022). Information transmission in regional energy stock markets. Environmental Science and Pollution Research, 1–13. https://doi.org/10.1007/s11356-022-19159-1
- Antonakakis, N., Chatziantoniou, I., & Filis, G. (2014). Spillovers between oil and stock markets at times of geopolitical unrest and economic turbulence. MPRA Paper 59760, University Library of Munich,
- Antonakakis, N., Gabauer, D., Gupta, R., & Plakandaras, V. (2018). Dynamic connectedness of uncertainty across developed economies: A time-varying approach. Economics Letters, 166, 63–75. https://doi.org/10.1016/j.econlet.2018.02.011
- Antonakakis, N., Gupta, R., Kollias, C., & Papadamou, S. (2017). Geopolitical risks and the oil-stock nexus over 1899–2016. Finance Research Letters, 23, 165–173. https://doi.org/10.1016/j.frl.2017.07.017
- Atif, M., Rabbani, M. R., Bawazir, H., Hawaldar, I. T., Chebab, D., Karim, S., & AlAbbas, A. (2022). Oil price changes and stock returns: Fresh evidence from oil exporting and oil importing countries. Cogent Economics & Finance, 10(1), 2018163. https://doi.org/10.1080/23322039.2021.2018163
- Baker, S. R., Bloom, N., & Davis, S. J. (2016). Measuring economic policy uncertainty. The Quarterly Journal of Economics, 131(4), 1593–1636. https://doi.org/10.1093/qje/qjw024
- Balcilar, M., Bonato, M., Demirer, R., & Gupta, R. (2018). Geopolitical risks and stock market dynamics of the BRICS. Economic Systems, 42(2), 295–306. https://doi.org/10.1016/j.ecosys.2017.05.008
- Bekiros, S., Boubaker, S., Nguyen, D. K., & Uddin, G. S. (2017). Black swan events and safe havens: The role of gold in globally integrated emerging markets. Journal of International Money and Finance, 73, 317–334. https://doi.org/10.1016/j.jimonfin.2017.02.010
- Boubaker, S., Hamza, T., & Vidal-García, J. (2018). Financial distress and equity returns: A leverage-augmented three-factor model. Research in International Business and Finance, 46, 1–15. https://doi.org/10.1016/j.ribaf.2016.09.003
- Bouri, E., Demirer, R., Gupta, R., & Marfatia, H. A. (2018). Geopolitical risks and movements in islamic bond and equity markets: A note. Defence and Peace Economics, 30(3), 367–379. https://doi.org/10.1080/10242694.2018.1424613
- Bouri, E., Saeed, T., Vo, X. V., & Roubaud, D. (2021). Quantile connectedness in the cryptocurrency market. Journal of International Financial Markets, Institutions and Money, 71, 101302. https://doi.org/10.1016/j.intfin.2021.101302
- Caldara, D., & Iacoviello, M. (2022). Measuring geopolitical risk. American Economic Review, April, 112(4), 1194–1225. https://doi.org/10.1257/aer.20191823
- Choudhury, T., & Daly, K. (2021). Systemic risk contagion within US states. Studies in Economics and Finance, 38(4), 836–860. https://doi.org/10.1108/SEF-08-2020-0342
- Cui, J., Goh, M., & Zou, H. (2021). Coherence, extreme risk spillovers, and dynamic linkages between oil and China’s commodity futures markets. Energy, 225, 120190. https://doi.org/10.1016/j.energy.2021.120190
- Dahir, A. M., Mahat, F., Ab Razak, N. H., & Bany-Ariffin, A. N. (2018). Revisiting the dynamic relationship between exchange rates and stock prices in BRICS countries: A wavelet analysis. Borsa Istanbul Review, 18(2), 101–113. https://doi.org/10.1016/j.bir.2017.10.001
- Demir, E., & Danisman, G. O. (2021). Banking sector reactions to COVID-19: The role of bank-specific factors and government policy responses. Research in International Business and Finance, 58, 101508. https://doi.org/10.1016/j.ribaf.2021.101508
- Dewandaru, G., Masih, R., & Masih, M. (2017). Regional spillovers across transitioning emerging and frontier equity markets: A multi-time scale wavelet analysis. Economic Modelling, 65, 30–40. https://doi.org/10.1016/j.econmod.2017.04.026
- Dharani, M., Hassan, M. K., Rabbani, M. R., & Huq, T. (2022). Does the Covid-19 pandemic affect faith-based investments? Evidence from global sectoral indices. Research in International Business and Finance, 59, 101537. https://doi.org/10.1016/j.ribaf.2021.101537
- Disli, M., Nagayev, R., Salim, K., Rizkiah, S. K., & Aysan, A. F. (2021). In search of safe haven assets during COVID-19 pandemic: An empirical analysis of different investor types. Research in International Business and Finance, 58, 101461. https://doi.org/10.1016/j.ribaf.2021.101461
- Duan, W., Khurshid, A., Rauf, A., Khan, K., & Calin, A. C. (2021). How geopolitical risk drives exchange rate and oil prices? A wavelet-based analysis. Energy Sources, Part B: Economics, Planning, and Policy, 16(9), 861–877. https://doi.org/10.1080/15567249.2021.1965262
- Ferrer, R., Bolós, V. J., & Benítez, R. (2016). Interest rate changes and stock returns: A European multi-country study with wavelets. International Review of Economics & Finance, 44, 1–12. https://doi.org/10.1016/j.iref.2016.03.001
- Ftiti, Z., Guesmi, K., & Abid, I. (2016). Oil price and stock market co-movement: What can we learn from time-scale approaches? International Review of Financial Analysis, 46, 266–280. https://doi.org/10.1016/j.irfa.2015.08.011
- Hassan, M. K., Djajadikerta, H. G., Choudhury, T., & Kamran, M. (2021). Safe havens in Islamic financial markets: COVID-19 versus GFC. Global Finance Journal, 54, 100643. https://doi.org/10.1016/j.gfj.2021.100643
- Hassan, M. K., Rabbani, M. R., & Ali, M. A. (2020). Challenges for the Islamic Finance and banking in post COVID era and the role of fintech. Journal of Economic Cooperation and Development, 43(3), 93–116.
- Ji, Q., & Guo, J. F. (2015). Oil price volatility and oil-related events: An internet concern study perspective. Applied Energy, 137, 256–264. https://doi.org/10.1016/j.apenergy.2014.10.002
- Kanjilal, K., & Ghosh, S. (2017). Dynamics of crude oil and gold price post 2008 global financial crisis: New evidence from threshold vector error-correction model. Resources Policy, 52, 358–365. https://doi.org/10.1016/j.resourpol.2017.04.001
- Kinateder, H., Campbell, R., & Choudhury, T. (2021). Safe haven in GFC versus COVID-19: 100 turbulent days in the financial markets. Finance Research Letters, 43, 101951. https://doi.org/10.1016/j.frl.2021.101951
- Kuhn, P. M., & Weidmann, N. B. (2015). Unequal we fight: Between- and within-group inequality and ethnic civil war. Political Science Research and Methods, 3(3), 543–568. https://doi.org/10.1017/psrm.2015.7
- Li, Y., Huang, J., & Chen, J. (2021). Dynamic spillovers of geopolitical risks and gold prices: New evidence from 18 emerging economies. Resources Policy, 70(2021), 101938. https://doi.org/10.1016/j.resourpol.2020.101938
- Liu, Y., Wei, Y., Wang, Q., & Liu, Y. (2022). International stock market contagion during the COVID-19 pandemic. Finance Research Letters, 45, 102145. https://doi.org/10.1016/j.frl.2021.102145
- Maghyereh, A. I., Awartani, B., & Abdoh, H. (2019). The co-movement between oil and clean energy stocks: A wavelet-based analysis of horizon associations. Energy, 169, 895–913. https://doi.org/10.1016/j.energy.2018.12.039
- Maghyereh, A. I., Awartani, B., & Tziogkidis, P. (2017). Volatility spillovers and cross-hedging between gold, oil and equities: Evidence from the gulf cooperation council countries. Energy Economics, 68, 440–453. https://doi.org/10.1016/j.eneco.2017.10.025
- Mensi, W., Hkiri, B., Al-Yahyaee, K. H., & Kang, S. H. (2018). Analyzing time–frequency co-movements across gold and oil prices with BRICS stock markets: A VaR based on wavelet approach. International Review of Economics and Finance, 54, 74–102. https://doi.org/10.1016/j.iref.2017.07.032
- Mensi, W., Rehman, M. U., Maitra, D., Al-Yahyaee, K. H., & Sensoy, A. (2020). Does bitcoin co-move and share risk with Sukuk and world and regional Islamic stock markets? Evidence using a time-frequency approach. Research in International Business and Finance, 53, 101230. https://doi.org/10.1016/j.ribaf.2020.101230
- Miah, M. D., Suzuki, Y., & Uddin, S. M. S. (2021). The impact of COVID-19 on islamic banks in Bangladesh: A perspective of Marxian “circuit of merchant’s capital. Journal of Islamic Accounting and Business Research, 12(7), 1036–1054. https://doi.org/10.1108/JIABR-11-2020-0345
- Mollick, A. V., & Assefa, T. A. (2013). U.S. stock returns and oil prices: The tale from daily data and the 2008-2009 financial crisis. Energy Economics, 36, 1–18. https://doi.org/10.1016/j.eneco.2012.11.021
- Morales, L., & Andreosso O’callaghan, B. (2014). Volatility analysis of precious metals returns and oil returns: An ICSS approach. Journal of Economics and Finance, 38(3), 492–517. https://doi.org/10.1007/s12197-012-9229-8
- Naeem, M. A., Rabbani, M. R., Karim, S., & Billah, S. M. (2021). Religion vs ethics: Hedge and safe haven properties of Sukuk and green bonds for stock markets pre-and during COVID-19. International Journal of Islamic and Middle Eastern Finance and Management.
- Naeem, M. A., Sehrish, S., & Costa, M. D. (2021). COVID-19 pandemic and connectedness across financial markets. Pacific Accounting Review, 16(2), 165–178. https://doi.org/10.1108/PAR-08-2020-0114
- Nalban, V., & Smădu, A. (2021). Asymmetric effects of uncertainty shocks: Normal times and financial disruptions are different. Journal of Macroeconomics, 69, 103331. https://doi.org/10.1016/j.jmacro.2021.103331
- Ourir, A., Bouri, E., & Essaadi, E. (2021). Hedging the risks of MENA stock markets with gold: Evidence from the spectral approach. Computational Economics, 61(1), 1–35. https://doi.org/10.1007/s10614-021-10204-8
- Owusu Junior, P., Adam, A. M., & Tweneboah, G. (2017). Co-movement of real exchange rates in the West African Monetary Zone. Cogent Economics & Finance, 5(1), 1351807. https://doi.org/10.1080/23322039.2017.1351807
- Qadan, M. (2019). Risk appetite, idiosyncratic volatility and expected returns. International Review of Financial Analysis, 65, 101372.. https://doi.org/10.1016/j.irfa.2019.101372
- Qadan, M., & Idilbi-Bayaa, Y. (2020). Risk appetite and oil prices. Energy Economics, 85, 104595. https://doi.org/10.1016/j.eneco.2019.104595
- Qadan, M., & Nama, H. (2018). Investor sentiment and the price of oil. Energy Economics, 69, 42–58. https://doi.org/10.1016/j.eneco.2017.10.035
- Qian, L., Zeng, Q., & Li, T. (2022). Geopolitical risk and oil price volatility: Evidence from markv-switching model. International Review of Economics & Finance, 81, 29–38. https://doi.org/10.1016/j.iref.2022.05.002
- Qiao, X., Zhu, H., & Hau, L. (2020). Time-frequency co-movement of cryptocurrency return and volatility: Evidence from wavelet coherence analysis. International Review of Financial Analysis, 71, 101541. https://doi.org/10.1016/j.irfa.2020.101541
- Rabbani, M. R., Kayani, U., Bawazir, H. S., & Hawaldar, I. T. (2022). A commentary on emerging markets banking sector spillovers: Covid-19 vs GFC pattern analysis. Heliyon, 8(3), e09074. https://doi.org/10.1016/j.heliyon.2022.e09074
- Rabbani, M. R., Mohd, A., Ali, M., Rahiman, H. U., Atif, M., Zulfikar, Z., & Naseem, Y. (2021). The response of islamic financial service to the COVID-19 pandemic: The open social innovation of the financial system. Journal of Open Innovation, Technology, Market, and Complexity, 7(1), 85. https://doi.org/10.3390/joitmc7010085
- Reboredo, J. C., Rivera-Castro, M. A., & Ugolini, A. (2017). Wavelet-based test of co-movement and causality between oil and renewable energy stock prices. Energy Economics, 61, 241–252. https://doi.org/10.1016/j.eneco.2016.10.015
- Sahabuddin, M., Islam, M. A., Tabash, M. I., Anagreh, S., Akter, R., & Rahman, M. M. (2022). Co-movement, portfolio diversification, investors’ behavior and psychology: Evidence from developed and emerging countries’ stock markets. Journal of Risk and Financial Management, 15(8), 319. https://doi.org/10.3390/jrfm15080319
- Saiz, A., & Simonsohn, U. (2013). Proxying for unobservable variables with internet document-frequency. Journal of the European Economic Association, 11(1), 137–165. https://doi.org/10.1111/j.1542-4774.2012.01110.x
- Salisu, A. A., & Shaik, M. (2022). Islamic stock indices and COVID-19 pandemic. International Review of Economics and Finance, 80, 282–293. https://doi.org/10.1016/j.iref.2022.02.073
- Salisu, A. A., & Sikiru, A. A. (2020). Pandemics and the asia-pacific islamic stocks. Asian Economics Letters, 1(1), Article 17413. https://doi.org/10.46557/001c.17413
- Salisu, A. A., Vo, X. V., & Lucey, B. (2021). Gold and US sectoral stocks during COVID-19 pandemic. Research in International Business and Finance, 57, 101424. https://doi.org/10.1016/j.ribaf.2021.101424
- Shahzad, S. J. H., Bouri, E., Roubaud, D., & Kristoufek, L. (2020). Safe haven, hedge and diversification for G7 stock markets: Gold versus bitcoin. Economic Modelling, 87, 212–224. https://doi.org/10.1016/j.econmod.2019.07.023
- Shaik, M. (2022). The empirical study of the relationship between stock indices, crypto assets, and COVID-19 using wavelet coherence analysis. Journal of Quantitative Finance and Economics, 4(1), 1–16.
- Sharif, A., Aloui, C., & Yarovaya, L. (2020). COVID-19 pandemic, oil prices, stock market, geopolitical risk and policy uncertainty nexus in the US economy: Fresh evidence from the wavelet-based approach. International Review of Financial Analysis, 70, 101496. https://doi.org/10.1016/j.irfa.2020.101496
- Singh, G., & Shaik, M. (2021). The short-term impact of COVID-19 on global stock market indices. Contemporary Economics, 15(1), 1–19. https://doi.org/10.5709/ce.1897-9254.432
- Sinlapates, P., Romklang, N., & Chancharat, S. (2021). Volatility linkages among the returns of oil, gold, and stock market: Evidence from Thailand. Asia-Pacific Journal of Science and Technology, 26(4). https://www.scopus.com/inward/record.uri?eid=2-s2.0-85114367626&partnerID=40&md5=1f227e3faa7a5dd7baee122087caa861
- Smales, L. A. (2021). Geopolitical risk and volatility spillovers in oil and stock markets. The Quarterly Review of Economics and Finance, 80, 358–366. https://doi.org/10.1016/j.qref.2021.03.008
- Sun, Q., & Xu, W. (2018). Wavelet analysis of the co-movement and lead–lag effect among multi-markets. Physica A: Statistical Mechanics and Its Applications, 512, 489–499. https://doi.org/10.1016/j.physa.2018.08.102
- Uddin, M., Chowdhury, A., Anderson, K., & Chaudhuri, K. (2021). The effect of COVID–19 pandemic on global stock market volatility: Can economic strength help to manage the uncertainty? Journal of Business Research, 128, 31–44. https://doi.org/10.1016/j.jbusres.2021.01.061
- Umar, Z., Bossman, A., Choi, S., & Teplova, T. (2022). Does geopolitical risk matter for global asset returns? Evidence from quantile-on-quantile regression. Finance Research Letters, 48, 102991. https://doi.org/10.1016/j.frl.2022.102991
- Vukovic, D. B., Lapshina, K. A., & Maiti, M. (2021). Wavelet coherence analysis of returns, volatility and interdependence of the US and the EU money markets: Pre & post crisis. The North American Journal of Economics and Finance, 58, 101457. https://doi.org/10.1016/j.najef.2021.101457
- Youssef, M., Mokni, K., & Ajmi, A. N. (2021). Dynamic connectedness between stock markets in the presence of the COVID-19 pandemic: Does economic policy uncertainty matter? Financial Innovation, 7(1), 1–27. https://doi.org/10.1186/s40854-021-00227-3
- Zhou, M. -J., Huang, J. -B., & Chen, J. -Y. (2022). Time and frequency spillovers between political risk and the stock returns of China’s rare earths. Resources Policy, 75.
