?Mathematical formulae have been encoded as MathML and are displayed in this HTML version using MathJax in order to improve their display. Uncheck the box to turn MathJax off. This feature requires Javascript. Click on a formula to zoom.
Abstract
This paper, using the most recent dataset, examines the government expenditure’s effects on the economic growth of Nepal. In doing so, a particular focus is made on disaggregated government expenditures to identify the importance of sector-specific public expenditure. The methodology adopted in this paper considers the scenario of government budget constraints while allocating resources in specific sectors and attempts to find the elasticity of those expenditures in the country’s economic growth. The results from the estimation employing Auto-regressive distributed lag (ARDL) approach to cointegration for the data from 1981 to 2020 are threefold. First, both capital and current expenditures in aggregate forms are not the contributors to economic growth unlike our assumption that capital expenditure is more important than current expendtirue for economic grwoth. Second, spending more on education, either in the form of capital or current expenditure, would make a meaningful contribution to accelerating economic growth. Third, the public expenditure in the health sector should be very rational, focusing more on capital health expenditure rather than spending current health expenditure. Therefore, the primary policy recommendation from this study is that Nepal should invest more in education and health. Moreover, spending on education to expand the area with wider coverage and quality logistics and infrastructure are both important, while such expenditure in health is to be focused on solid health logistics and infrastructures.
Keywords:
1. Introduction
The widening gap between current and capital expenditure with an increasing trend of current expenditure and a declining trend of capital expenditure plus the poor efficiency of capital expenditure have become serious issues of the development administration of Nepal for more than two decades now. The increasing trend of current expenditure and declining trend of capital expenditure have resulted a slower economic growth than the expectation of the policymakers and stakeholders in Nepal, where even the financial development has not contributed positively to meeting expectations, such as expanding the economic activities and promoting the trade performance in the country (Paudel et al., Citation2021). This scenario has created abnormal pressure for fiscal administration (Ministry of Finance, Citation2021). This pressure is created based on the assumption that the capital expenditure, rather than the current expenditure, in both the health and education sector contributes to economic growth.
The problem is that these trends have resulted in slow progress on quality infrastructure-building tasks that Nepal needs densely for a faster pace of economic growth and overall development of the nation. Poor capital expenditure is one aspect of the economy. and on the other side, we do not know how qualitatively this capital expenditure has contributed to the economic growth of the country. Therefore, for the proper justification of the role of public expenditure in Nepal, it is better to review the role of government expenditure in economic growth globally. The role of government expenditure in economic development is widely discussed in the literature on development economics. For example, Bose et al. (Citation2007) have stated that since the 1990s, this topic gained the attention of researchers and more concerns about public policies.
However, the association of public expenditure and economic growth is different in the country-to-country context. If we synthesise the literature, we find the association of public expenditure with economic growth has threefold; such as positive association, negative association and neutral association of public expenditure with economic growth. Even with public expenditure, a level of disaggregation is found classifying into current and capital expenditure. Further, current and capital expenditures also are divided into expenditure heading-wise. For instance, it can be disagrregated into current education expenditure, capital education expenditure, current health expenditure and capital health expenditure and many other subheadings. These subheadings go with the further disagreegation of the expenditure, such as school buildings, road to school, educational labs, salary, hospital buildings and so on. However, these subheadings are not directly relevant to this paper as the disaggregation of the data used in this paper is limited to current and capital expenditure of education and health sector.
Many studies suggested the positive association of government expenditure with economic development. Devarajan et al. (Citation1996) found a positive relationship between public expenditure and economic growth using data from 43 developing countries. Similarly, Usman et al. (Citation2011) detected a positive association of capital expenditure with economic growth in the case of Nigeria. Recently, Nyarko-Asomani et al. (Citation2019) has found that capital expenditure played an important role in the economic growth in Ghana.
However, there is a string of literature that shows this effect of capital expenditure to be negative. For example, Barro (Citation1991) pointed out that government consumption adversely impacts economic growth in a panel study of 98 countries from 1960 to 1985. Giving a sort of contrasting results, Devarajan et al. (Citation1996) suggested a negative impact of capital expenditure and a positive impact of current expenditure on economic growth using a panel data set for 43 developing countries. Again, in contrast to Devarajan et al. (Citation1996), Vu Le and Suruga (Citation2005) found the positive impact of capital expenditure and non-capital expenditure’s negative role in economic growth. Also, a few studies, such as Levine and Renelt (Citation1992) confirmed the association of capital expenditure with economic growth is neutral or ambiguous.
For quality human development, a country needs to focus on education and health expenditure wisely so that the country can become a better living place for its citizens. Another issue is that Nepal, at present, has a demographic dividend and may not be in such a favourable situation for a long time again in the future. With the increment of the ageing population, public expenditure will increase immensely as discussed in Lopreite and Mauro (Citation2017) and Lopreite and Zhu (Citation2020) respectively in the context of Italy and China, respectively.
Therefore, this is the right time, Nepal must make some substantial efforts to grab the opportunity from the situation for economic development. For this to happen, Eggoh et al. (Citation2015) suggested a joint effort on improving health and education so that public expenditure provides better results for economic development.
Despite having serious concerns about Nepal’s public expenditure trend for more than two decades, the issue of public expenditure and its disaggregated framework has not yet been systematically analyzed to detect the association of public expenditure and economic growth empirically, for which this paper is motivated to attempt.
The major findings from this paper are as follows: the focus of the nation should be spending more on the education sector, either in the form of current or capital expenditure, to enhance the quality and coverage of education in the country. Also, the country should focus to develop the health sector by focusing on capital expenditure referring for a more careful spending strategy in the health sector compared to the education sector. Both of these sectors’ expenditures would explore economic growth. In the meantime, the country should make a better plan to increase capital formation rapidly by adopting several macroeconomic policies so that sufficient allocation for the public spending is possible to accelerate economic growth in the country.
This paper is structured as follows. The trend and patterns of public expenditure and economic growth are presented in Section 2. A brief literature review is presented in Section 3. Research methodology is discussed in Section 4 followed by results and discussion in Section 5 before concluding with some recommendations in the final section.
2. Capital expenditure trends in Nepal
As stated earlier in Section 1, always the concerns of the policymakers and stakeholders are on poor capital expenditure in Nepal. Every year, around the budget speech time-poor capital expenditure of the government has become a hot topic among the stakeholders, medias, and even among ordinary people in some cases. The general administrative expenditure (now known as recurrent expenditure) just adds a burden without meaningful contribution to the national economy. This trend with the dominancy of general administrative expenditure is more visible since the early 1990s when democracy was restored in the country.
Figure presents the trends of capital expenditure for the period between 1974/75 and 2019/20. This has been expressed in terms of the capital expenditure percent of total expenditure and capital expenditure percent of gross domestic product (GDP). As seen in the figure, in 1982/83, the share of capital expenditure of the government’s total expenditure was the highest one, that is 71%, then started declining gradually until 1993/94. In the same year, the period of political turmoil caused by the Nepal Communist Party (Maoist)’s armed struggle started and probably this caused to accelerate the current expenditure and sped declination of the ratio of the capital expenditure. With some fluctuations, it declined to just 15% of total expenditure in the fiscal year 2016/17.
Figure 1. Trends of capital expenditure 1974/75–2019/20.
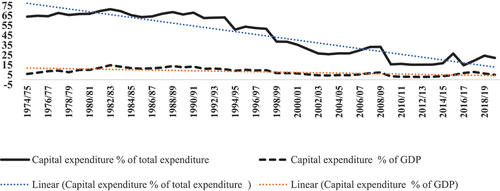
For the recent year, that is 2019/20, it stands at only 22%. The same figure shows a more frustrating scenario for the policymakers as the share of capital expenditure was recorded at only 6% of GDP for the fiscal year 2019/20. Again, this was the highest in 1982/83 with a record of about 15% of GDP and it had a minimum of about 3% in the early second decade of the new millennium. A sharp decline in both variables was noted from 2008/09 to 2009/10 when the country was tensely in the phase of political transition, and due to the unstable political glitch caused by the failure of the first constituent assembly.
The data as shown in Figure show the value of recurrent expenditure and capital expenditure for the period from the fiscal year 1974/75 to the fiscal year 2019/20. The current expenditure has overtaken capital expenditure visibly since 2000/01 when the political turmoil caused by armed struggle became more city-focused. The volume of current expenditure is increasing quite faster than capital expenditure and it has resulted in the widening gap between these two public expenditures. From 2015/16 to 2017/18, both expenditures increased substantially at a faster rate but the speed of current expenditure is quite faster because of elections and the implementation of federalism in the country during this period.
Figure 2. Capital and current expenditure (Rs. million).
The direct impact of this widening gap between these two types of expenditure would cause a serious negative impact on the economic development of the country. Therefore, a corrective measure is required. For this, capital expenditure needs to be increased and it may be possible by allocating capital expenditure in more mature ways. These ways may be to improve the program design mechanism before allocating the budgets. Before allocating the budget to such a program, the concerned authorities seek a kind of guarantee in different areas of need to complete the projects. For example, source of the budget for the given program, required human resources, period, land, costs and benefits from the projects, spending mechanism and technologies are crucial aspects to consider before setting up the program.
The poor performance on implementing the capital expenditure is explained by Figure , which presents the capital expenditure month-to-month every year (Bikram Sambat as the official calendar year of Nepal government) for 3 fiscal years: 2073/74, 2075/76 and 2077/78. Nepal provisioned to make budget speech pooling one and a half months earlier than our practised date (end of Ashadh-closing date of the fiscal year) to maintain consistency in the expenditures, which was considered as one of the ways to accelerate capital expenditure in the country. Even since then, the trend did not improve. The critics of governments say “Ashare bikash” (translates as “the capital expenditures in rush at the last month of the fiscal year”) is replicated in the expenditure pattern of capital expenditure again after the new provision of budget in the country’s constitution. The lack of proportionate budget executing capacity in our system has caused us to spend the budget at the end of the fiscal year. This has caused the poor quality of construction work during the time of monsoon season. About 40% of capital expenditure occurs in the last month of the fiscal year is the main challenge of development tasks.
Figure 3. Capital expenditure by month for three fiscal years (%).
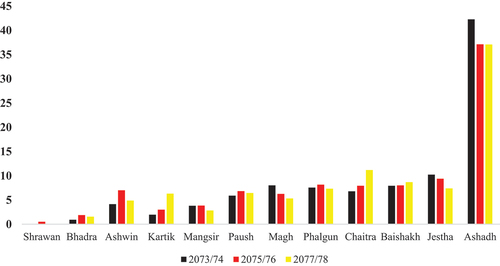
Therefore, one way of improving the capital expenditure spending capacity of the system would be maintaining the compulsory provision of around 8% of capital expenditure each month. This would ease monitoring of the budget execution process and also improve the quality of the construction works. But again, just making the provision of 8% expenditure per month would not make a significant impact on the expenditure capacity of the mechanism. For that to happen, various policy measures to be made along with the set provisions. Not only the Ministry of Finance that plays a monitoring role in the budget but also the ministries for which capital expenditures are allocated must be responsible to improve the capital expenditure scenario and their effectiveness on economic development. Mainly these ministries are the Ministry of Energy, Water Resources and Irrigation, Ministry of Urban Development, Ministry of Physical Infrastructure and Transportation, Ministry of Communications and Information Technology and others. They should work in close collaboration to improve both the volume and effectiveness of the capital expenditure.
3. Literature review
3.1. Theoretical foundation
The theoretical foundation of the role of education and health expenditure on economic growth is linked to the role of education and health in economic growth. It is because education and health are the part of respective expenditure for the human development that contribute to economic growth. In this regard, there are three strings of literature that show the effect of public expenditure (current and capital expenditure) in economic growth. These three strings are limited with the positive role of such expenditure on economics growth, negative role of such expenditure on economic growth a the neutral role of such expenditure in economic growth. For example, Barro (Citation1991) pointed out that public expendtirue adversely (negatively) impacts economic growth in a panel study of 98 countries from 1960 to 1985. Giving a sort of contrasting results, Devarajan et al. (Citation1996) suggested a negative impact of capital expenditure and a positive impact of current expenditure on economic growth in the context of developing countries. This study shows the mixed impact of public expenditure on economic growth.
Again, in contrast to Devarajan et al. (Citation1996), Vu Le and Suruga (Citation2005) found the positive impact of capital expenditure and non-capital expenditure’s negative role in economic growth. Usman et al. (Citation2011) detected a positive association of capital expenditure with economic growth. Recently, Nyarko-Asomani et al. (Citation2019) stated that the capital expenditure played an important role in the economic growth in Ghana.
Also, a few studies, such as Levine and Renelt (Citation1992) confirmed the association of capital expenditure with economic growth is neutral or ambiguous.
3.2. International context
Most of the literature on capital expenditure and economic growth is concerned with the direction of the impact of capital expenditure on economic growth. Generally, it is expected that capital expenditure contributes positively to economic growth as the expenditure includes the construction of infrastructure, such as roads, bridges, parks, stadiums, industrial and commercial zones, and so on which contribute directly to increasing the national output directly. But the literature provides a mixed feeling that in some countries’ cases, capital expenditure also has played a negative impact on growth, and unlike the normal expectation, the current expenditure has a positive impact on economic growth, and vice versa. The literature suggests that there is no straightforward answer to detect the positive and negative association of these expenditures with economic growth. Even, this association can be insignificant in some cases. Nyasha and Odhiambo (Citation2019) reviewed the theoretical and empirical literature on the relationship between government expenditure and economic growth and found that the impact of government spending on economic growth is ambiguous, and varies from positive to negative. Further, some of the cases can have neutral effects too.
For example, Devarajan et al. (Citation1996), using data from 43 developing countries for 20 years, found that the current expenditure has a statistically significant association with economic growth while such relation of capital expenditure is negative. This implies that the developing countries governments have been misallocating public expenditure so that it could not play a significant positive role in economic growth.
Contrary to Devarajan et al. (Citation1996), Bose et al. (Citation2007) using the data for 30 developing countries, found that the share of capital expenditure in GDP is positively associated with economic growth and the share of current expenditure does not have a strong association with economic growth.
Nurudeen and Usman (Citation2010) studied the role of government expenditure in economic growth in the case of Nigeria using the annual data from 1970 to 2008 in a disaggregated framework and found that total capital expenditure and total current expenditure both hurt economic growth. However, in the disaggregated framework, transportation and communication and health expenditure have a strong positive effect on economic growth.
Odo et al. (Citation2016) examined the long-run and causal relationship between public expenditure and economic growth employing annual data from 1980 to 2014 in the case of South Africa and found a stable long-run relationship between the variables following Wagner’s hypothesis. In another study using the panel data for 59 countries covering the period from 1990 to 2019, Ahuja and Pandit (Citation2020) found a positive relationship between public expenditure and economic growth. Also, this study suggested that investment is crucial in the acceleration of economic growth in developing countries.
Not only in the context of developing countries, the issues of public expenditure and economic growth are well discussed also in the context of developed countries. For example, Ertekin and Bulut (Citation2021) studied in the context of OECD countries and found that public expenditure positively affects economic growth in the short-run, but in the long-run no such association is detected.
3.3. Nepalese context
There are few studies in the Nepalese context too. Kunwar (Citation2019) and Chaudhary (Citation2010) both studied the impact of public expenditure on economic growth in the case of Nepal covering different periods. These two papers have found contradictory results on the relationship between public expenditure and economic growth. For example, Kunwar (Citation2019) states the lag of government expenditure has a positive impact on economic growth, while Chaudhary (Citation2010) states no impact of government expenditure on economic growth.
Mainali (Citation2013) stated that government expenditure is growth-promoting; however, there is not a significant impact of government expenditure on the economic growth of Nepal. Rasaily and Paudel (Citation2019), using the data from the fiscal year 1974/75 to 2017/18, found that there is a long-run relationship between government expenditure and economic growth. The paper suggested that both current and capital expenditures need to be mobilized for better results for economic growth.
3.4. Research gap
These representative studies in the public expenditure context suggest the literature gap in two main aspects. The first is that the disaggregated analysis of capital expenditure has not been in the context of Nepal yet. The second is that there are no such studies yet relating a detailed analysis of capital and current expenditure using up-to-date data to investigate the impact on economic growth despite the weak performance of public expenditure in Nepal for a long time now. Therefore, the major objective of this research paper is to investigate the association of public expenditure with economic growth disaggregating the current health and education and capital public expenditure covering the longest possible period. Doing so, this analysis will help for better policy inferences on the issue of government expenditure and its disaggregated public expenditure framework.
4. Research methodology
Economic growth is a long-term phenomenon and it is the combined result of the production factors, which include, but are not limited to, capital, labour force, and technology (Paudel, Citation2020). The issue of economic growth is a complex matter as several factors might be contributing. If we observe the development path of the countries, their path of development is not the same, but different in many respects. Therefore, the variables used for modelling economic growth are not unique and are diverse.
This paper adopts the approach of the Solow–Swan growth model as described in Solow (Citation1956), which has been augmented to include the main variables of the interest of the researchers and contexts. The Solow–Swan growth model correctly identifies the contribution of the production factors, such as labour force, technology and capital, in economic growth. The key message from the model is that the stage of technology, the amount of capital and the quality of the human resources are the key factors of economic growth. Considering the original model, this paper uses the variables based on growth literature including capital expenditure, current expenditure, working-age population, capital formation, and disaggregation of capital and current expenditure. Here, the public expenditure is used as the proxy of technology in the Solow–Swan growth model. The robustness check of the results is made by employing alternative specifications of the model.
As the mandatory steps in the time-series analysis, first, the structural break is tested using the Gregory–Hanson test; however, the break is not detected (Appendix A). Then, the unit root test is conducted. For this purpose, a unit root test is conducted before determining the econometric methodology. Once the time-series properties are identified, the model estimation method is selected.
4.1. Model, variables, and data source
This paper employs the Solow–Swan growth model, which has widely been used in the economic growth literature. This paper is inspired by the theoretical background of Solow–Swan growth model for the variable selection. Technology, capital and labour forces are the main variables but are amended following Bose et al. (Citation2007). In the mean time, I feel my obligation to explain few contextual differences of this paper with Bose et al. (Citation2007). First, this paper is a time-series analysis based on Nepal’s data, while the cited one is for panel studies for many countries that lead to methodological differences, but the variables for the baseline models are as stated in EquationEquation (1)(1)
(1) . Second, the data for a few variables such as initial income and initial education are dropped due to methodological differences. The main methodological difference is that Bose et al. (Citation2007) used the seemingly unrelated regression method for a panel dataset, while this paper, looking at the time-series properties of the dataset, uses the autoregressive distributed lag (ARDL) approach of cointegration, which cannot incorporate the time-invariant variables such as initial income and initial education level.
In this model, the per capita GDP growth (GDPPCG) is the dependent variable and is employed as the proxy of economic growth following the literature in the context.
The independent variables are capital expenditure as percent of GDP (CAPEXP), current expenditure as percent of GDP (CUREXP), gross capital formation as percent of GDP (GCFORM), and primary school enrolment gross percent (PRIMEN) in the baseline model. The model has many alternative specifications and at that time the other variables are employed to make a disaggregated analysis of the public expenditure. For this purpose, the government expenditure is disaggregated into total education expenditure measured as percent of GDP, total health expenditure as percent of GDP, and total military expenditure measured in percent of GDP. Also, instead of school enrolments for the labour force, the working-aged population is included to look in different perspectives too. The total military expenditure as percent of GDP is dropped whether this would change the results for other variables. Then, in the final stage for the long-run relationship analysis, the education expenditure and health expenditure are further disaggregated into capital and current expenditure. The benchmark EquationEquation (1)(1)
(1) is presented as follows:
where is a constant term,
are the coefficients of the independent variables,
is the error term, and the subscript t refers to the period-year as we are using the annual data from 1981 to 2020. Based on the literature, we expect
,
and
to be positive, and the coefficients of
can be both negative and positive, as shown in various cases in different countries’ contexts, but most likely to be negative. The list of variables, postulated signs of their coefficients and data sources are given in Appendix B. The table has also included the details of the variables that define both dependent and independent variables.
Before starting the econometric estimation, the unit root tests of Dickey–Fuller (DF), augmented Dickey–Fuller (ADF), Phillips and Perron (PP) and Kwiatkowski–Phillips–Schmidt–Shin (KPSS) are conducted using the model in EquationEquation (2)(2)
(2) , and the results are presented in Tables .
Table 1. Unit root test results at the level
Table 2. Unit root test results at the first difference
The test results are achieved assuming the presence of a unit root (non-stationary variable) in the null hypothesis (H0) and no unit root (stationary variable) in the alternative hypothesis (Ha) of EquationEquation (2)(2)
(2) .
where is the first difference operator, Z is the variable of interest,
is the intercept, t is the time, ∆Z is the augmented terms, k is the appropriate lag length of the augmented terms and ε is the white noise error term. The ADF test is essentially the test of the significance of the coefficient
in the above equation. The DF test is performed without the augmented term. To select the lag length k, we start with a maximum lag of 4 and pare it down to the appropriate lag by examining the Schwarz Criterion (SC).
The unit root test results suggest that we have both I(0) and I(1) variables, such as GDPPCG is detected as I(0) and the rest in the baseline model as I(1). We largely consider the results from DF, ADF and PP as they are consistent in all methods. In some cases, the results suggested by KPSS are slightly different, but they do not force to alter the results. Similarly, other specifications also would have a mixed set of I(0) and I(1) variables as seen in Tables . If the variables in Table are significant, noted as I(0) and if they are not significant, then tested with the first difference and results are presented in Table , and are declared as I(1) as they are estimated in the first difference.
4.2. Econometrics
As stated earlier, we detect the time-series properties by detecting the mixed set of variables I(0) and I(1). Now, the standard procedure is to conduct the cointegration test to find out the coefficients to explain the relationship between the dependent and independent variables. As we have the time-series data without a structural break but with different order of integration, the variables included in EquationEquation (1)(1)
(1) will be analyzed using a co-integration test based on autoregressive distributed lag (ARDL) approach to identify the long-run and short-run relationship among the dependent and independent variables, irrelevance of the order of their integration (Paudel & Jayanthakumaran, Citation2009; Pesaran et al., Citation2001). The advantage of using ARDL is that this fits well with the combination of I(0) and I(1) variables and predicts both long-run and short-run cointegration. As the model regressed with the lag of dependent variables, it adopts a dynamic modelling approach that captures the lag effects too.
Therefore, EquationEquation (1)(1)
(1) will be modified as in EquationEquation (3)
(3)
(3) to represent the ARDL version of the specification.
EquationEquation (3)(3)
(3) shows the dynamic impact in the form of the Auto-Regressive Distributed Lag Model. In the model,
stands for the first-order lagged variable,
are the coefficients of first-order variables. Similarly,
,
are the parameters of the error correction model, and
is a vector of random error.
5. Results and discussion
First, the baseline model as specified in EquationEquation (1)(1)
(1) is tested and the results are presented in Column (1) of Table . Then, in the next step, the primary school enrolment is replaced by the secondary school enrolment, and the results are presented in column (2) of the same table. Further tests are conducted for a deeper analysis, on which the baseline model is specified with different alternative specifications, and the results are presented in columns (3) and (4) of Table . Here, the government expenditure is disaggregated into total education expenditure measured as percent of GDP, total health expenditure as percent of GDP, and total military expenditure measured in percent of GDP. Also, instead of school enrolments for the labour force, the working-aged population is included to look in different perspectives too. In column 4, the total military expenditure as percent of GDP is dropped whether this would change the results for other variables. Then, in the final stage for the long-run relationship analysis, the education expenditure and health expenditure are further disaggregated into capital education and current education expenditure, and a similar fashion is adopted for health expenditure. These results are presented in column (5) of Table .
Table 3. Long-run coefficients of ARDL model, expenditure at an aggregate level
Table 4. Long-run coefficients of ARDL model, expenditure at disaggregate level-I
Table 5. Long-run coefficients of ARDL model, expenditure at disaggregate level-II
These three tables present the long-run relationship results for the model. Similarly, Table presents the results for the ECM model in those different specifications of the model. The variables in Table are the same as –5 but presented in short form and their lagged formed too. Combinedly, these tables show the long-run and short-run coefficients of ARDL with different lags as shown in the table for the given model. Schwartz–Bayesian Criteria (SBC) is selected due to the relatively small size of the series; however, we cover 40 years, from 1981 to 2020, in this study. In all the specifications for the long-run relationship, the F-statics (Bound) results show that the values are higher than that of the upper bound of the critical value indicating that the long-run relationships exist in all these specifications of the model (these values are reported at the lower segment of the Tables . For example, the bound test F-statistics for the base model is 6.77 which is higher than 5.27 at a 5% level of significance indicating the existence of a long-run relationship among the variables.
Table 6. Short-run ECM coefficients of ARDL models
The estimated results, which are for aggregate capital and current expenditure, in column (1) of Table show that capital expenditure (CAPEXP) does not have a strong long-run relationship with economic growth. Yes, this indicates some of the issues with the way we spent the capital budget as discussed and reflected in Figure . The coefficient for current expenditure (CUREXP) is negative at a 10% level of significance. The results for this variable show that a 1% increase in current expenditure as percent of GDP cause a decline in economic growth, on average by about 0.20%, holding other variables in the model constant. However, the result of column (1) is not consistent in column (2), where the negative sign remains consistent but it loses statistical significance.
The results for gross capital formation’s share of GDP (GCFORM) measured in percent is significant consistently in all specifications of the model indicating a crucial role for much-needed capital in the country. The role of primary school enrollment (PRIMEN) measured in gross enrollment percent is found negative against our expectation; however, this is not our main variable of interest in the paper. Also, the coefficient for secondary school enrolment (SECEN) in column (2) is positive but not statistically significant. The value for R-squared indicates the model is a good fit in column (1) as the value stands at 0.75. This value has declined to 0.52 in column (2), where the PRIMEN has been replaced by SECEN. This indicates the model specification in (1) is much more fitted than the model specification in (2).
Table presents long-run coefficients for alternative specifications, where expenditure is disaggregated into total education expenditure (TEDUEX), total health expenditure (THLTHEX), and total military expenditure (MILTEXP) all measured as the share of GDP percent, and new variable to represent the labour force (LFORCE) introduced. The LFORCE is measured as the percent of the working-age population in the total population. In this table, the total education expenditure is statistically significant with high elasticity. This is as expected and supported by literature, investing in education provides a good return to the nation. Total health expenditure (THLTHEX) has a positive impact as expected, but statistically, the results are not significant. The military expense (MILTEXP) is not statistically significant, and we also notice that the model fit is not different even it is dropped from the model. Therefore, military expense (MILTEXP) has been dropped for further analysis as it is not our major variable of interest in this study.
Table presents the long-run coefficients for the variables on which education and health expenditures are further disaggregated into capital education expenditure (CAPEDUEX), current education expenditure (CUREDEX), capital health expenditure (CAPHLTHEX), and current health expenditure (CURHLTHEX), all measured as the share of GDP percent. The results for CAPEDUEX are statistically significant with high elasticity, indicating a 1% increase in capital education expenditure causes to grow the economy by on average almost 5.60%, holding other variables in the model constant.
The results for CAPHLTHEX are also statistically significant, and the effect is more than 0.60%, but other things remain the same. Probably, the most interesting result is that the education expenditure, even the current expenditure in education has a strong significance in economic growth. A point to note is that these findings are in line with the findings of Idrees and Siddiqi (Citation2013) and Mercan and Sezer (Citation2014). Here, the assumption of capital expenditure—both in the case of education and health—contributes positively in economic growth is as expected. Also, these results show the urgency of spending more in the education sector which can produce more skilled human resources much needed for promoting economic growth. The current health expenditure is not found encouraging, but rather discouraging to some extent.
Against normal expectation, it can be summarized that the working-age population (LFORCE)—the proxy of the labour force does not have a statistically significant impact on growth performance. Probably, a significant number of the migrated working-aged population would have a direct contribution to the country.
Table presents the short-run results for all specifications of the model. In all five specifications, the results for ECM (−1) are statistically significant with an expected negative sign indicating the disequilibrium that occurred in the previous period is corrected in the present period following a short-run shock at a relatively slow pace as the coefficients are higher. As seen in the results of all columns (1)–(5), the immediate past growth rate of per capita income, gross capital formation, capital education and health expenditure, have a strong positive impact on economic growth in the short run, while some of these variables have a negative impact if the variables are measured in further lagged form.
Interestingly, the short-run impact of total education expenditure seems to be negative. The first lag value is negative but not significant statistically, and the second lag of this variable is negative and statistically significant. These results seem reliable to replicate the investment costs in education during the school period that pays back in the later stage as the economic growth is measured more accurately in the long run.
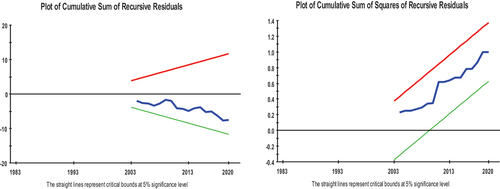
Now let’s consider the stability test of the model. In the test, as reported in the results tables, the moderately high value of R-square (ranged from 0.52 to 0.85) in the different specifications show that the overall goodness-of-fit of the model is moderately high, that is on average all specification-about 68% of the variation observed in the target variable is explained by the model. The diagnostic test results show that the model passes the tests for serial correlation, functional form, normality, and heteroscedasticity. Further, the stability test results (CUSUM and CUSUMSQ) plotted against the critical bounds of a 5% level of significance are within the range, indicating that the model is structurally stable (Figures in Appendix; Figures –).
6. Conclusions and recommendations
The main objective of the paper is to examine the role of public expenditure in economic growth noting the concerns raised by various stakeholders on the ground of poor capital expenditure in the country for more than two decades. For this purpose, a thorough analysis of public expenditure using its disaggregated form has been made in this paper using an advanced econometric methodology based on time-series data.
The results for aggregate capital and current expenditure suggest that capital expenditure, against our expectations, has not contributed significantly to enhance the economic growth performance of the country. This result indicates that some of the issues on the way we spent the capital budget as discussed and reflected by data and public concerns are genuinely valid. The results for capital expenditure suggest it be controlled as the indicated results are negative though not strong and consistent. Being with poor efficiency of capital spending is one issue and the spending has not contributed positively in economic growth is another issue of development management. In the case of overall capital expenditure, the policy aspects must address a few concerns.
First, the allocation needs to be sufficient as per the development needs of the country so that economic growth can be enhanced. Second, the allocated budget needs to be spent within the time frame so that the goal of the desired policy is achieved. Just allocating resources merely would not contribute to the growth of the economy. Third, not only capital expenditure spending but also efficient spending in the major disaggregated scope should be a major concern. For example, finishing the mega projects after many years of scheduled time frame would increase the direct costs and opportunity costs of the country and it hurts the economic growth.
The major determinant of growth performance in this context seems to be gross capital formation, which should be the major concern of the fiscal administration in the country. The education policy should work hard to get the results as supported by the literature making more vocational and technical education from the base level.
The results from the disaggregated capital and current expenditure suggest that total education expenditure is crucial for economic growth. The results also suggest investing more in education; however, total health expenditure also has a positive impact but should be more rational allocating more to capital health expenditure rather than current health expenditure.
Investing more in capital health expenditure would support our ageing population in the future, unlike the current health expenditure at present. Because of the demographic dividend factor, Nepal would need a solid foundation of health services for the future. This fact is to be considered while allocating health expenditures in the country. It refers that these expenditures have a positive impact but have not contributed enough to be significant at present. It might be due to the poor monitoring mechanism while implementing the budgeted expenditure and the poor spending capacity of the mechanism.
Therefore, a strong recommendation from this study is to invest more in the education sector and more rational expenditure in the health sector so that the results become statistically significant in the days to come. Doing this will help to produce more skilled and required human resources in the country for the expected acceleration of economic growth, which has not been materialized due to the poor expenditure capacity of the current mechanism in terms of capital expenditure to the respective sectors.
Description of the paper
Time-series data of Nepal’s public expenditure in the most possible disaggregated framework
Properly taken care of time-series properties of data
Disaggregated analysis of public expenditure on health and education
Disaggregated analysis of capital and current expenditure spent on health and education sector
A concrete policy recommendation
Acknowledgment
The author is grateful for the comments given by Professor Dr Pushpa Raj Kandel, Professor Dr Govinda Raj Pokharel, Professor Dr Bishwambhar Pyakurel and Mr Krishna Hari Banskota as the discussant in the seminar organized by the Central Department of Economics, Tribhuvan University. Also, the author is thankful to all the participants of the seminar for their valuable comments and suggestion on the earlier version of this paper. The standard caveat applies if any mistakes and errors are left in the paper, are sole of the author’s. The seminar was organized with financial support from the University Grant Commission of Nepal and Confederations of Banking and Financial Institutions Nepal. Also, the author is grateful to Robert Read (Senior Editor of this journal) and two anonymous reviewers for their helpful comments and suggestions.
Disclosure statement
No potential conflict of interest was reported by the author(s).
Additional information
Notes on contributors

Ramesh C. Paudel
Ramesh C. Paudel is Associate Professor of Economics at the Central Department of Economics of Tribhuvan University, Kathmandu, Nepal. Currently, he is also serving as a member of the Board of Trade, Government of Nepal. He holds a PhD from ANU, and Master’s in economics (Research) from the Wollongong University, Australia. Ramesh has an intensive experience in the academia in Nepal and Australia. Also, he has worked as a consultant at the World Bank, Asian Development Bank, different ministries of the government of Nepal. His research interests include but not limited to economic growth, tourism economics, fiscal policy, international trade, liberalization and reforms, development financing, foreign direct investment, landlocked economies, structural transformation, and macroeconomic issues of development economics. Ramesh has published several academic papers in peer-reviewed journals, book chapters and books.
References
- Ahuja, D., & Pandit, D. (2020). Public expenditure and economic growth: Evidence from the developing countries. FIIB Business Review, 9(3), 228–21. https://doi.org/10.1177/2319714520938901
- Barro, R. J. (1991). Economic growth in a cross section of countries. The Quarterly Journal of Economics, 106(2), 407–443. https://doi.org/10.2307/2937943
- Bose, N., Haque, M. E., & Osborn, D. R. (2007). Public expenditure and economic growth: A disaggregated analysis for developing countries. The Manchester School, 75(5), 533–556. https://doi.org/10.1111/j.1467-9957.2007.01028.x
- Chaudhary, S. K. (2010). Public expenditure and economic growth in Nepal. Economic Literature, IX, 96–104. https://www.researchgate.net/profile/Shashi-Chaudhary/publication/347933484_Public_Expenditure_and_Economic_Growth_in_Nepal/links/5fe844eaa6fdccdcb80765db/Public-Expenditure-and-Economic-Growth-in-Nepal.pdf
- Devarajan, S., Swaroop, V., & Zou, H. -F. (1996). The composition of public expenditure and economic growth. Journal of Monetary Economics, 37(2), 313–344. https://doi.org/10.1016/0304-3932(96)01249-4
- Eggoh, J., Houeninvo, H., & Sossou, G. -A. (2015). Education, health and economic growth in African countries. Journal of Economic Development, 40(1), 93–111. https://doi.org/10.35866/caujed.2015.40.1.004
- Ertekin, Ş., & Bulut, Ş. (2021). The relation of public expenditures with economic growth in OECD Countries. Yönetim ve Ekonomi Dergisi, 28(1), 187–203. https://doi.org/10.18657/yonveek.838461
- Idrees, A. S., & Siddiqi, M. W. (2013). Does public education expenditure cause economic growth? Comparison of developed and developing countries. Pakistan Journal of Commerce and Social Sciences (PJCSS), 7(1), 174–183.
- Kunwar, K. B. (2019). Impact of government expenditure in economic growth of Nepal: ARDL approach. Contemporary Research: An Interdisciplinary Academic Journal, 3(1), 33–40. https://doi.org/10.3126/craiaj.v3i1.27488
- Levine, R., & Renelt, D. (1992). A sensitivity analysis of cross-country growth regressions. The American Economic Review, 82(4), 942–963.
- Lopreite, M., & Mauro, M. (2017). The effects of population ageing on health care expenditure: A Bayesian VAR analysis using data from Italy. Health Policy, 121(6), 663–674. https://doi.org/10.1016/j.healthpol.2017.03.015
- Lopreite, M., & Zhu, Z. (2020). The effects of ageing population on health expenditure and economic growth in China: A Bayesian-VAR approach. Social Science and Medicine, 265, 113513. https://doi.org/10.1016/j.socscimed.2020.113513
- Mainali, P. K. (2013). Government expenditure and economic growth in Nepal. Tribhuvan University.
- Mercan, M., & Sezer, S. (2014). The effect of education expenditure on economic growth: The case of Turkey. Procedia-Social and Behavioral Sciences, 109, 925–930. https://doi.org/10.1016/j.sbspro.2013.12.565
- Ministry of Finance. (2021). Economic survey (Nepali version). G. o. N. Ministry of Finance.
- Nepal Rastra Bank. (2017). A handbook of government finance statistics. Nepal Rastra Bank, Baluwatar, Kathmandu, Nepal.
- Nepal Rastra Bank. (2020). Current macroeconomic and financial situation. Baluwatar.
- Nurudeen, A., & Usman, A. (2010). Government expenditure and economic growth in Nigeria, 1970-2008: A disaggregated analysis. Business and Economics Journal, 4(1), 1–11.
- Nyarko-Asomani, A., Bhasin, V. K., & Aglobitse, P. B. (2019). Government capital expenditure, recurrent expenditure and economic growth in Ghana. Ghanaian Journal of Economics, 7(1), 44–70.
- Nyasha, S., & Odhiambo, N. M. (2019). The impact of public expenditure on economic growth: A review of international literature. Folia Oeconomica Stetinensia, 19(2), 81–101. https://doi.org/10.2478/foli-2019-0015
- Odo, S. I., Igberi, C. O., Udude, C. C., & Chukwu, B. C. (2016). Public expenditure and economic growth in South Africa: Long run and causality approach. Asian Journal of Economics, Business and Accounting, 1(2), 1–17. https://doi.org/10.9734/AJEBA/2016/29677
- Paudel, R. C. (2020). The role of financial development in economic growth of Nepal: ARDL approach of cointegration with structural break analysis. Journal of Economics and Business, 3(4), 1372–1386. https://doi.org/10.31014/aior.1992.03.04.287
- Paudel, R. C., Alharthi, M., & Read, R. (2021). Role of financial development in the export performance of a landlocked developing country: The case of Nepal. Cogent Economics and Finance, 9(1), 1–18. https://doi.org/10.1080/23322039.2021.1973653
- Paudel, R. C., & Jayanthakumaran, K. (2009). Financial liberalization and performance in Sri Lanka: The ARDL approach. South Asia Economic Journal, 10(1), 127–156. https://doi.org/10.1177/139156140901000106
- Pesaran, M. H., Shin, Y., & Smith, R. J. (2001). Bounds testing approaches to the analysis of level relationships. Journal of Applied Econometrics, 16(3), 289–326. https://doi.org/10.1002/jae.616
- Rasaily, A., & Paudel, S. (2019). Impact of government expenditures on economic growth: Case of Nepal. International European Extended Enablement in Science, Engineering & Management, 10(6), 167–174.
- Solow, R. M. (1956). A contribution to the theory of economic growth. The Quarterly Journal of Economics, 70(1), 65–94. https://doi.org/10.2307/1884513
- Usman, A., Mobolaji, H. I., Kilishi, A., Yaru, M., & Yakubu, T. (2011). Public expenditure and economic growth in Nigeria. Asian Economic and Financial Review, 1(3), 104–113.
- Vu Le, M., & Suruga, T. (2005). Foreign direct investment, public expenditure and economic growth: The empirical evidence for the period 1970–2001. Applied Economics Letters, 12(1), 45–49. https://doi.org/10.1080/1350485042000293130
- World Bank. (2023). “World development indicators.” Retrieved 16 February, 2023 from https://data.worldbank.org/
Appendix A.
Structural break tests results
Appendix B.
Details of variables used in different specifications of the model
Appendix C
Figure C1. Plot of CUSUM and CUSUMQ plots for model specification (1).
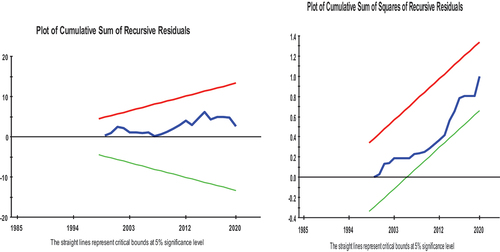
Figure C2. Plot of CUSUM and CUSUMQ plots for model specification (2).
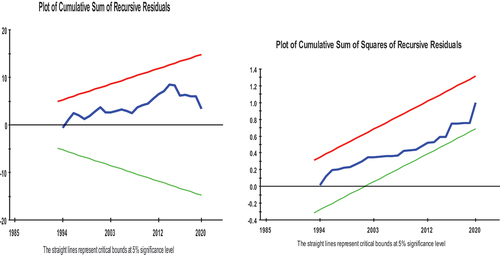
Figure C3. Plot of CUSUM and CUSUMQ plots for model specification (3).
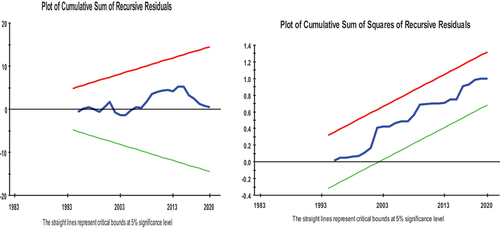
Figure C4. Plot of CUSUM and CUSUMQ plots for model specification (4).
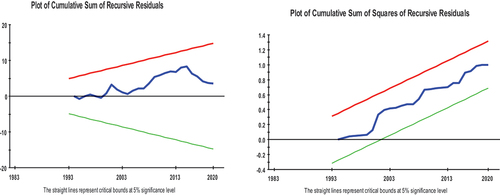
Figure C5. Plot of CUSUM and CUSUMQ plots for model specification (5).