
 ?Mathematical formulae have been encoded as MathML and are displayed in this HTML version using MathJax in order to improve their display. Uncheck the box to turn MathJax off. This feature requires Javascript. Click on a formula to zoom.
Abstract
Risk premium plays an important role in stock investing. Experiments have shown that value stocks typically have a higher average return than growth stocks; however, this effect persists indefinitely, even disappearing in some stages. Some studies suggested high volatility in the series of returns, broken structures, market volatility, or the impact of financial crises. This study aimed to build the uncertainty index and control it in the regression analysis model to solve the limitations above. The empirical analysis in Ho Chi Minh Stock Exchange (HOSE) showed that a value premium exists, and value stocks have a higher average return than growth stocks due to the higher overall risk. Furthermore, this study combined the Support Vector Regression (SVR) algorithm with the risk premium theoretical framework for the forecasting model; consequently, it is the most efficient model.
Public interest statement
Value premiums are one of the most controversial topics in the financial sector. Some experiments involving value complements have had mixed results. There are two interpretations of value premium: related to behavioral finance and risk premium. This study found that the value premium’s cause comes from risk arbitrage. Specifically, value portfolios have a higher overall risk. As a result, the rate of return is offset by a corresponding premium.
1. Introduction
Researchers and investors often use the Book to market ratio (BM) to sort stocks into growth and value categories. Using data from the United States of America m (US market), E. Fama and French (Citation1992); E. F. Fama and French (Citation1993) documented that high BM earned higher average returns than low BM over the 28 years from July 1963 to June 1991. Some results are similar to Chan et al. (Citation1991); Rosenberg et al. (Citation1985); Stattman (Citation1980). E. F. Fama and French (Citation1993) also found that the value premium is not explained by the Capital Asset Pricing Model (CAPM). With the evidence from previous studies, Fama & French proposed a 3-factor model: market factor, size premium, and value premium. Research by Loughran (Citation1997) showed that there is no value premium in large stocks, only in small stocks; however, this study only considers stocks in the US after 1963. E. F. Fama and French (Citation1998) đconfirms the absence of a value premium in the US and some other markets.
There is still debate about the interpretation of the value complement. Some researchers rely on behavioral finance, others on risk. Behavioral finance researchers argue that the overreaction of naive investors creates disparities in returns between portfolios. Specifically, they rely on the business’s past performance; for growth firms they overestimate the price level but underestimate the value business (Neves et al., Citation2021). Furthermore, these studies found that the performance of growth and value stocks varied between different periods around the global financial crisis. Furthermore, investor sentiment is important in growth and value stock returns.
Some researchers interpreted risk premiums as risk compensation. Value stocks are riskier than growth stocks, which a higher expected return should offset—case studies such as E. F. Fama and French (Citation1993); Qadan and Jacob (Citation2022). N. F. Chen and Zhang (Citation1998) used several risk characteristics related to firm characteristics, such as firm distress, financial risk, and the riskiness of future cash flows, to support the risk premium argument.
Studies in non-US markets such as China also have conflicting results. Gang et al. (Citation2019) did not find a valuable complement in the Fama-French 3-factor model. Clark and Qiao (Citation2020) also gave similar results; however, they found that value premiums are related to macro policies. Meanwhile, Liu et al. (Citation2019) proved that the value factor is important in the Fama-French 3-factor model.
In Vietnam, Anh (Citation2017) used data from 313 companies listed on the Ho Chi Minh Stock Exchange (HOSE) from October 2011 to October 2016 to evaluate the 3-factor model. The results showed that 6 out of 7 categories have a value effect for the linear regression method. However, the percentile regression results indicated that all categories have a value effect. The study also found that the value complements in the periphery percentiles are stronger than those in the central percentiles. The limitation of the study is that it has not considered the uncertainty affecting the model and has not evaluated the error in the forecasting model. Estimating the value premium by determining the difference in fertility rates of the value portfolio and the growth portfolio, according to E. F. Fama and French (Citation2021), has many limitations; instead, they determine the value premium by comparing a portfolio against the market portfolio. This method works for several reasons: the market portfolio has always been the focus of pricing models; it indicates whether a category is in the growth or value category.
E. F. Fama and French (Citation2021) tested the US market and showed a diminishing value-compensation effect. However, high volatility in monthly value premiums is an irrefutable cause of different hypotheses of the value premium at two periods. Several previous and subsequent studies have also demonstrated the effect of the uncertainty principle, such as Freyberger et al. (Citation2020); Gagliardini et al. (Citation2016); Smith and Timmermann (Citation2022). Therefore, this study constructed an uncertainty principle similar to the study of Ismailov and Rossi (Citation2018); Rossi and Sekhposyan (Citation2015). The advantage of this index is that when macroeconomic instability occurs, such as a financial crisis, oil price shock, etc., the uncertainty index will be high.
Finally, this study considers the predictive model under the machine learning approach. Specifically, the value premium and the uncertainty index were applied to forecast portfolio returns. The algorithm is Support Vector Regression (SVR). The SVR is one of the most powerful algorithms widely applied in continuous output variable prediction. Many studies have shown its effectiveness in finance compared to traditional econometric models. Specifically, Zheng et al. (Citation2021) used the SVR to forecast stock indexes in China from 1/2016 to 12/2020. The results show that, in general, SVR is more efficient than ANN (Artificial Neural Network) and RF (Random Forest) algorithms. Khoa and Huynh (Citation2022a) have used SVR under the CAPM framework and obtained positive HOSE market results. Khoa and Huynh (Citation2022b) used SVR in forecasting the movement of securities in the VN30 portfolio in the HOSE market, from which this study proposes a short-term trading method to obtain outstanding profits (Henrique et al., (Citation2018); Huang et al., (Citation2016); Pan et al., (Citation2017); Y. Chen & Hao, (Citation2017); Zhang et al., (Citation2021)).
The limited empirical study of value premiums and uncertainty is the main motivation for this research. This study focuses on three main objectives:
To test the existence of value premium in the HOSE market according to the method of E. F. Fama and French (Citation2021).
To analyze the impact of uncertainty on the value premium.
To use value premium and SVR algorithm to forecast portfolio return.
2. Theoretical framework
2.1. Value premium
Early studies showed a gap between value stocks and growth stocks (Capaul et al., (Citation1993); E. F. Fama & French, (Citation1993); E. Fama & French, (Citation1992)). In particular, value stocks appear to have higher average returns than growth stocks. This difference is called the value premium. There are two possible explanations for the value premium: behavioral finance and risk premium. Studies using behavioral finance suggested that market underperformance stems from the overwhelming majority of investors being too excited about growth companies. As a result, they overvalue growth firms and undervalue value firms (Lakonishok et al., (Citation1994); Skinner & Sloan, (Citation2002)). Jaffe et al. (Citation2020) split the BM ratio into mispricing and growth option. This study identified that the mispricing component is stronger in explaining the value premium. Qadan and Jacob (Citation2022) used data from 1965 to 2019 to show that value premiums are correlated and can be predicted by investors’ risk appetite. Specifically, investors’ appetite for risk translates into increased demand for value stocks over growth stocks.
The other explanatory branch supports the efficient market hypothesis and arbitrage returns caused by risk arbitrage (Avramov & Chordia, (Citation2006); E. F. Fama & French, (Citation1998)). These studies suggested that higher-risk value stocks should be offset with a high expected return. The value premium is, therefore, the compensation for taking on more risk that the CAPM model has passed. Furthermore, this line of research also finds that value premiums are positively correlated with some forms of systematic risks, such as aggregate labor income (Jagannathan & Wang, (Citation1996)), economic growth (Kirby, (Citation2019); Koijen et al., (Citation2017)), cash flow risk (Campbell & Vuolteenaho, (Citation2004)), technological shocks (Berk et al., (Citation1999)). Value premium relates to the firm’s characteristics, such as leverage (Doshi et al., (Citation2019)) and growth firms (Ebrahim et al., (Citation2014)). Angelidis et al. (Citation2015) provided evidence that the dispersion of returns can serve as a variable indicative of the state of the economy since it is a reliable predictor of the value premium. Specifically, high volatility predicts a worsening economic situation and higher expected value premiums.
Most studies focus on the difference between the value portfolio and the growth portfolio to account for the value premium. The Fama-French 3-factor model used three factors in the pricing model, including the market factor, the factor related to the size and value premium (E. Fama & French, (Citation1992)). Some empirical evidence revealed that the 3-factor model needs to be completed; E. F. Fama and French (Citation2015) proposed a 5-factor model by adding two factors related to investment and profit. Following this line of research, E. F. Fama and French (Citation2021) used the market portfolio as the basis because the author argues that the market portfolio is always central in most pricing models. Furthermore, for a particular portfolio, a comparison with the market portfolio indicated whether it is in the value or growth category; they defined it as the excess return value to the market portfolio (BM—BMM), in which they used US data from June 1963 to June 2019 and did not include two samples. Research has found that the value premium tends to decrease from the early stage to the later period. Furthermore, the high volatility of the value premium is an irrefutable cause of the difference between the two periods.
Subsequent work by Smith and Timmermann (Citation2022) suggested that there exists a plucking structure that E. F. Fama and French (Citation2021) have not considered. This study showed four breaks from 1950 to 2018 in the 6-factor model; these breaks occurred at some special events, such as the oil price shocks of the early 1970s, the change in the US Federal Reserve (FED) monetary policy regime, the collapse of the dot-com bubble, and the Global Financial Crisis (GFC). Previous studies have also noted a significant impact of variation in typically expected returns, such as Freyberger et al. (Citation2020) or the effect of crises on traditional econometric models (Gagliardini et al., (Citation2016)).
Thus, the empirical evidence that the value complement remains a challenging problem for researchers. There exist two streams of explanation around the value premium, the behavioral asset and the risk premium. In some studies, the existence/disappearance of value premiums has been explained by causes of uncertainty principles such as economic fluctuations, crises, and even broken structures in the valuation models
2.2. Linear ε- support vector regression (linear ε-SVR)
Support vector regression (SVR) is an algorithm to predict the continuous output. SVR is built on the idea of a Support Vector Machine (SVM) algorithm developed by Cortes and Vapnik (Citation1995). SVM is a classification algorithm (supervised learning) in statistics. Assume a layered hyperplane perfectly separates the data. Each point in space will be assigned by −1 or 1. The SVM problem is finding a subclass H so that the margin between the two classes is maximum.
If the subclass H hyperplane has the equation: and without loss of generality, this result can assume that for the points closest to H, and have:
for the point to be subclassed one, and
for the point to be subclassed −1. Then, the distance between the two classes is:
. The SVM problem becomes:
In some cases of complex distributed data, the method works poorly; the original data set is mapped to a more dimensional space where the classification is obvious, and the kernel function defines the mapping (Benkraiem & Zopounidis, (Citation2021)). The technique used after the transformation is similar to the case where a perfectly classed hyperplane or the soft margin case exists. With the same idea as SVM, instead of locating an optimal classifier hyperplane, the SVR problem is to find a regression function such that most of the observed points lie in the interval
. This problem is called linear ε-SVR (Thomas et al., (Citation2017)).
However, linear ε-SVR is very sensitive to outliers. Specifically, when outliers are present, ε will be larger, making the error based on the report higher. To overcome this, an offset parameter is added to limit the effect from outliers, allowing these outliers’ values to lie outside the boundary (Dhiman et al., (Citation2019)). The ε-SVR problem becomes:
Where C > 0 is a regularization parameter, defining the trade-off relationship between the flatness of function f and the prediction errors.
3. Methodology
3.1. Data description
The data are all stocks listed on Ho Chi Minh City Stock Exchange, period January 2012 to June 2022. At the end of 30 June 2022, there were 546 listed securities codes, including 403 stocks, two closed-end fund certificates, 9 ETF certificates, 128 covered warrants, and four bonds. The total volume of listed shares reached over 130 billion shares. This study kept only 403 stocks and grouped them into six categories by BM. Stocks with high BM are called value stocks (30%) and are grouped into two categories; stocks with low BM are called growth stocks access (30%). 2 portfolios, the remaining stocks (accounting for 40%) are grouped into two categories. The categories are sorted each year after the end of June (E. F. Fama & French, (Citation2015)). The VN-index was analyzed to represent the market portfolio.
This research built the uncertainty index Iit based on the CAPM model; the idea is based on the previous studies of Ismailov and Rossi (Citation2018); Rossi and Sekhposyan (Citation2015). Accordingly, this study forecast error , in which
(the expected rate of return is calculated by the CAPM model with a beta coefficient estimated from over 36 months of data). Next, the error to [0,1] is normalized by using the formula:
A large value of Eit implies that the observed rate of return is very different from the expected value. Specifically, the uncertainty index was constructed as follows:
Some of the variables in the study are summarized in Table .
Table 1. Variable description
3.2. Data processing
3.2.1. Testing the relationship between the value premium and book-to-market ratios in excess of market
The portfolio’s expected return always fluctuates due to different impacts from company-specific factors and macroeconomic variables (Khoa & Huynh, (Citation2022c)). Measuring volatility (risk) is a challenge. Previous studies used lagged dividend-to-price (DP ratio) to predict and report the stock’s rate of return (Lettau & Ludvigson, Citation2005; Yin & Nie, (Citation2021)). The logic of this argument is that the value of the stock is the present value of the expected stream of future dividends by the Gordon model (Gordon, (Citation1959)). Fluctuations in expected return negatively impact the stock price. Because the present value of a stock is the present value of the expected future stream of dividends, the use of a dividend lag would be a poor proxy for the expected dividend. This can be seen in startups, always prioritizing growth overpaying dividends, or dividends are always negative. Furthermore, dividends can be affected by financial decisions more than the stock’s book value.
For the above reasons, this study uses the lag of the BM outperforming the market ratio, BM—BMM, to forecast the outperforming market rate, R-RM. The regression Eq.1 has the form:
Where: : the intercept coefficients;
: the slopes;
: error terms
The hypothesis was performed to test H0: “The value complement does not exist”; the assumption is that the regression coefficients are constants over time.
3.2.2. The value premium and uncertainty index
Assuming constant regression coefficients is a challenge. There are many reasons to reject this assumption, such as an increase in the supply of stocks, even shocks in the economy, such as the financial crisis, the oil price crisis, and the COVID-19 pandemic, can create a broken structure (E. F. Fama & French, (Citation2021)). The regression equation with dummy variable It as Eq.2 was established:
Where Iit = 1 if volatility in the portfolio’s return to the market is high and I it = 0 otherwise.
3.2.3. The value premium and support vector regression
The SVR algorithm is one of the most powerful output prediction algorithms in machine learning and is widely used in finance (Ma et al., (Citation2021)). The greatest difficulty in using these algorithms is using the appropriate inputs. Fortunately, the theoretical framework of value complements helps in this regard. A useful theoretical framework combined with a powerful prediction algorithm is expected to bring positive results. Model 3 used the SVR algorithm based on Eq.2, and the parameters include the radial kernel function, cost = 1, and gamma = 0.5.
This study divided the research data into two sets: training and testing at the ratio of 7:3 to evaluate the model. Specifically, the period from January 2012 to December 2017 is used for training, and the remaining period is used for testing. The evaluation criterion is a deviation (Ouerhani et al., (Citation2022)).
Where: Y: observed values, predicted values
3.2.4. F test for predictive models
Statistically, the mean of deviation cannot conclude whether one model is more efficient. In other words, this study needs a formal test to increase the reliability of the conclusion. This research uses the null hypothesis H0: “The forecast deviation in the models is the same,” and analysis of variance (ANOVA) was used for this test. The following assumptions are (1) normal distribution, (2) homogeneous variance, and (3) independent observations.
4. Results
In Figure , at the end of the last trading session of June 2022, the VN-Index reached more than 1,197 points, down 7.36% compared to May 2022, equivalent to a decrease of more than 20% compared to the end of 2021. Stock market liquidity in June, compared to May, the average trading volume and value reached over VND 14,529 billion and 547.70 million shares, respectively, down 2.8% in value and up 1.38% in average volume. In the second quarter of 2022, the average trading value of shares reached more than 17,113 billion VND, with the average trading volume reaching more than 589.15 million shares; respectively, down 20.02% in value and 18.33% in average volume over the same period in 2021. By the end of June 2022, on HOSE, there are 42 enterprises with a market capitalization of more than 1 billion USD, of which three enterprises have a capitalization of over 10 billion USD, including Joint Stock Commercial Bank for Foreign Trade of Vietnam (VCB), Vinhomes Joint Stock Company (VHM) and Vingroup Corporation (VIC).
Figure 1. The VN-index point (divided by 1000) and the BMM ratio for the market portfolio.
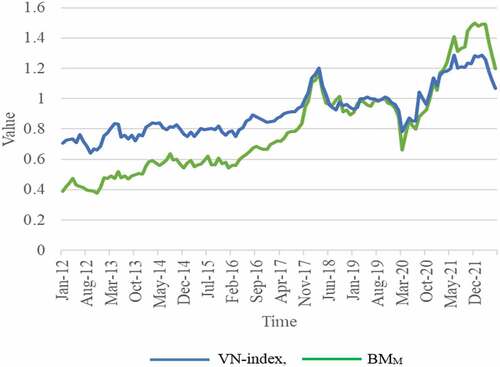
From 1/2012 to 6/2022, the VN-index and BMM tend to increase, as shown in Figure . However, at the beginning of 2018, end of 2019, and end of 2022, the market volatility in these periods is very large. The HOSE market increased by 48% in 2017. The VN-index is ranked among the indexes with the most impressive gains globally. The “miracle story” of securities is expected by market participants to be continued in 2018. Therefore, assessment reports on the market outlook also lean towards possible VN-index, which continued double-digit growth to reach 1,120 and then even 1,250 points. Vietnam has become the stock market with the strongest increase in the world, ahead of Brazil, Russia, and Argentina, and nearly three times the increase of the NASDAQ index (National Association of Securities Dealers Automated Quotation System). However, the “hot rise” of the index and the price of stocks becoming expensive are visible cracks in the seemingly stable shape of the market. In addition to uncertainties from the international market, such as the escalating trade war, FED raised interest rates, causing capital flows to reverse and the greenback to appreciate uncertainties in the commodity markets, especially crude oil, which reversed all previous forecasts. From the best index in Asia—Pacific in the first three months of the year, all efforts of Vietnamese stocks were wiped out only three months later. VN-index became the index with the deepest drop from the peak compared to other regional markets. The nearly 18 percent drop in the three months of the second quarter also marked the market’s worst period since the fourth quarter of 2008.
At the end of 2019 and the beginning of 2020, the Vietnamese stock market faced the COVID-19 pandemic that originated in China. Due to the heavy impact of the pandemic, especially companies related to import and export and services. Domestic production stagnated, most services stopped providing, import and export were blocked, … the stock market began to plunge. Investors preferred to hold cash, thus contributing to an increase in the supply of securities. Finally, in late 2022, many scandals involved some large corporations. The Government has taken many measures to purify the market, such as tightening credit for the real estate sector, comprehensive inspection of enterprises that issue bonds themselves, etc. The risk of securities investment in this period is relatively high, so investors tend to move cash flow out of the stock market. As a result, VN-index tends to decrease.
Table describes the basic statistics of the returns in excess of Market, R—RM, from January 2012 to June 2012 (126 months). Categories are grouped by decreasing BM ratio and reordered every year (E. F. Fama & French, (Citation2015)). P1, P2, and P3 are value portfolios, whereas P4, P5, and P6 are growth portfolios.
Table 2. Descriptive statistics returns in excess of the market
Overall, the average returns excess of value portfolios are higher than growth portfolios, and the overall risk of value portfolios is also higher than that of growth portfolios. Specifically, portfolio P1 has a mean of 0.54 and a standard deviation of 2.791; P1 has the highest mean and standard deviation of the six portfolios. The lowest is portfolio P6, with the lowest mean and standard deviation of −0.32 and 1.351, respectively. This result is consistent with previous studies by E. F. Fama and French (Citation1993); E. F. Fama and French (Citation2021) that value portfolios have higher expected returns than growth portfolios due to the portfolio’s risk characteristics.
Shape-specific, all six categories tend to skew left due to negative Skewness. Furthermore, these categories all have a more pointed shape than the normal distribution due to positive Kurtosis, except for the P3 category. Among the six categories, P3 has the closest confirmation to the standard lung segment with Kurtosis and Skewness of approximately 0. This result demonstrates the existence of a risk associated with the higher-order moments of the portfolios.
The correlation between portfolios and markets is very high, the lowest is 0.751 in portfolio P1, and the highest is 0.896 in portfolio P4. Therefore, P4 can be considered a representative of the market portfolio. Portfolios P1 and P6 have a lower market correlation than the rest because of the value premium involved. The value premium difference is responsible for the portfolio and the market correlation. In Table , the P1, P2, and P3 value portfolios are strongly correlated and weakly correlated with growth portfolios. Specifically, P1 has a strong positive correlation with P2 and P3 with values of 0.925 and 0.785, respectively, and a weak negative correlation with portfolios P4, P5, and P6 with values of −0.32, −0.242, respectively. −0.318. The strong correlation between the portfolio and the market is expected to yield positive results in the forecast model.
Table 3. Correlation between portfolios
4.1. Regression analysis
Stationarity in a time series is very important in forecasting; analysis and prediction problems are more difficult for nonstationary series. A commonly used unit root test is the basic Augmented Dickey-Fuller test. Accordingly, the regression model: . Under hypothesis H0:
(in favor of the string
as a nonstationary), the corresponding p-value was computed. The forecast series P1, P2, P3, P4, P5, and P6 all have very small p-values, less than 0.01, which is enough to conclude that the series is stationary at a 1% significance level. The results of regression analysis Eq.1 are summarized in Table .
Table 4. Regression of return premium on market excess BM ratio
Regression results in Table showed that the slopes of portfolios from P1 to P5 are all statistically significant at the 10% level, but portfolio P6‘s slope is not statistically significant. Otherwise, all slopes are positive; however, signed intercepts vary by category. Specifically, the value portfolio has a negative intercept, but the growth portfolio has the opposite sign. Furthermore, the intercepts in the non-zero categories are statistically significant (5% level), and the intercepts in the unproven growth categories are non-zero (with p-values greater than 10%).
The coefficients R2 in the regression models range from 0.175 to 0.532, which is relatively low. Value portfolios have a higher R2 than growth portfolios; the model explains better for the value portfolio. Finally, the Durbin—Watson is far from 2, showing that the models show autocorrelation. This result could be due to the uncertainty’s effect, so this study included a measure of uncertainty in model 1 to control for this effect. The regression results of model 2 are summarized in Table .
Table 5. Regression results of model 2
Overall, the Durbin—Watson statistics for all categories are close to 2, indicating a controlled series correlation problem. The coefficients R2 và Adjusted R2 are higher than model 1. Therefore, model 2 explains better than model 1. Specifically, the intercept coefficients P1 to P5 are statistically significant at the 10% significant level, but the intercept coefficient of P6 is not statistically significant. All slopes of β2 are statistically significant at the 10% level, demonstrating that the outperforming BM ratios of the portfolios to the market impact the risk premium. Furthermore, this effect is largely positive, with only portfolio P6 being the opposite. The Interaction Effects between uncertainty and the dominant BM ratio are mostly statistically significant at the 10% level, except for category P6, which demonstrates that uncertainty affects the value premium.
4.2. Forecast error
Data were collected from January 2012 to December 2017 for the training set and from January 2018 to June 2022 for the testing set (there are 54 observations/portfolio). Each model forecasts 6 portfolios; after that, the deviation was calculated from the difference between the predicted value and observed value; hence, there are 324 deviations for each model. The deviation is the criteria to evaluate the error of all three models. The deviation results are summarized in Table .
Table 6. The deviations of 3 models
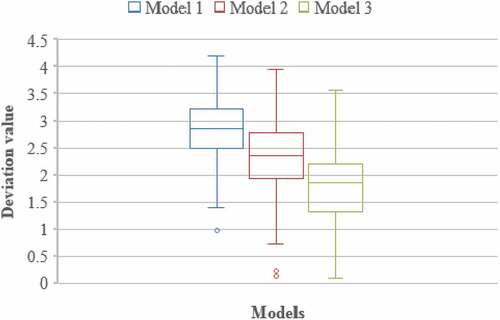
Model 3 predicts the best with an average of 1.8, and model 1 is the worst predictor, with an average of 2.83. Forecast errors in the volatility models are relatively low, ranging from 0.23 to 0.43. The F-test results in the ANOVA analysis in Table are sufficient to prove that there is no equality in the deviation expectations of the models (p-value = 0.0001, which is less than 0.05). Consequently, the null hypothesis was rejected; in other words, the three models’ effectiveness is different.
Table 7. ANOVA result
For more clarity, the boxplot chart in Figure pointed out that model 3 is more effective than the other models (model 1, model 2). The deviation distribution of model 3 is relatively lower than that of models 1 and model 2. Furthermore, the boxes are approximately symmetric, and the box lengths are relatively equal, so the distribution is very close to the normal distribution with equal variances, but the distribution centers differ.
Figure 2. Deviation distribution in three models.
5. Discussion
The expected rate of return of a portfolio fluctuates over time. One challenge is measuring this volatility. Previous studies often use lagged DP ratio to forecast return. This argument is based on the current stock price as the expectation of the future dividend stream and discounted to present value (E. F. Fama & French, (Citation2015); Gordon, (Citation1959); Kudar & Sayılgan, (Citation2021)). However, the volatility of the return series has the opposite effect on the stock price since the volatility in the return series reflects the overall risk of the security. Risk-averse investors tend to choose lower-risk stocks with the same expected rate of return. As a result, the stock price will fall if the stock fluctuates a lot. Furthermore, dividends can be affected by the firm’s financial decisions (Varela, (Citation2022)).
Here, this study chose the lag of the BM in excess of the market, BM—BMM, to forecast the portfolio’s excess return, R—RM. Like stock prices in the DP ratio, the market cap in BM reacts to fluctuations in dividend expectations similarly to changes in expected returns. However, financial decisions affect the book value less than the dividend. Therefore, the choice of the BM ratio for the forecasting model is completely justified. This choice of ours is also consistent with the argument of E. F. Fama and French (Citation2021).
The model 1 results prove that a value premium exists in the HOSE market during this research period. However, the phenomenon of serial correlation exists, making the problem of statistical inference unreliable. This result is consistent with the previous study by Stambaugh (Citation1999). Moreover, the coefficient R2 in the regression results is also relatively low; the highest value is only 0.532. This result suggests that the model is missing another important explanatory factor, specifically, it is uncertainty.
The returns of value portfolios were higher than growth portfolios over the entire study period in Table . This result is consistent with some previous studies such as E. F. Fama and French (Citation1993); E. F. Fama and French (Citation2015, 2021); Smith and Timmermann (Citation2022). E. F. Fama and French (Citation1993) argue that because value stocks have a higher risk, they should be offset by a corresponding rate of return, and the value premium is affected by the high variation of monthly rates of return. Meanwhile, Smith and Timmermann (Citation2022) argued that the partial effect is vanished due to a plucked structure. This study went in the other direction, adding the uncertainty index. The advantage of this approach is that the high-return months mean the uncertainty is high. More possible tumbling points, which are high uncertainty points. An even more effective uncertainty index covers periods of high economic instability, such as the COVID-19 pandemic, the Russia-Ukraine war, etc.
When controlling for uncertainty, the phenomenon of series correlation is no longer serious; statistical inferences become reliable. Specifically, the interaction variable is statistically significant, showing that controlling the uncertainty factor is effective. The coefficient of determination R2 and the adjusted coefficient of determination increased significantly compared to model 1. Model 2’s regression result implies a value premium in the HOSE market during this period, and uncertainty can cause different outcomes if we do not control them. Our proposed methods of measuring uncertainty have effectively explained the value complement. This result is also consistent with previous studies such as Ismailov and Rossi (Citation2018); Rossi and Sekhposyan (Citation2015). However, these studies only measure the uncertainty associated with bilateral exchange rates.
Previous studies have found that value portfolios have a higher average return than growth portfolios. To explain this, there are two lines of argument: related to risk premium and behavioral finance. The study found that the overall risk of the value portfolio is higher than the overall risk of the growth portfolio. It makes perfect sense to offset a corresponding rate of return. The research results agree with previous studies, such as Avramov and Chordia (Citation2006); E. F. Fama and French (Citation1998).
A fundamental limitation of our study is that it has not considered value premiums from a financial behavior perspective. It is a fact that the HOSE stock market is relatively small and young, especially in the weak form (Khoa et al., Citation2021). Recently, algorithms in machine learning have emerged thanks to the powerful computing power of computers. An inherent disadvantage of these algorithms is the tendency towards data mining if we do not have a corresponding supporting theoretical framework. For the SVR algorithm, the input parameter selection is very important. This research inherited some previous studies to choose the appropriate input parameters. Furthermore, model 3 is used the theoretical framework with the input variables in model 2. With the combination of the explanatory theory framework and the robustness in predicting the SVR algorithm, model 3 is the most effective.
6. Conclusion
Value premiums are one of the most controversial topics in the financial sector. Some experiments involving value complements have had mixed results. There are two interpretations of value premium: related to behavioral finance and risk premium. This study found that the value premium’s cause comes from risk arbitrage. Specifically, value portfolios have a higher overall risk. As a result, the rate of return is offset by a corresponding premium.
Some prior studies have no supporting financial theory, so the reproducibility is very low. This research is the pioneer in combining the theory of value complement with the SVR algorithm for predictive modeling. The main contribution consists of three parts: proving the existence of an empirical value premium, constructing an uncertainty index to explain the value premium, and combining a theoretical framework and SVR algorithm in the forecasting model. Several researchers have explained the risk-compensation puzzle’s difficulty for several reasons. By building an uncertainty index and controlling for this variable in the model, this research result showed that the model is significantly improved. Finally, this study combined the theoretical risk premium model with the SVR algorithm to obtain the predictive model with the lowest deviation. With this result, we suggest that further studies consider using SVR in the forecasting model as an alternative to the classical econometric model.
Model 2 is incomplete because the coefficient of determination is still low, so it is necessary to add some explanatory factors to improve the model. On the other hand, this study has not considered explaining the risk premium from a behavioral finance perspective because the HOSE market has not yet achieved weak form efficiency; hence, further studies can approach behavioral finance in the HOSE market to further clarify the issue.
Disclosure statement
No potential conflict of interest was reported by the authors
Additional information
Funding
Notes on contributors

Bui Thanh Khoa
Bui Thanh Khoa earned his Master’s degree in Business Economics from the Université Toulouse 1 Capitole in France in 2012, and he will acquire his doctorate in Business Administration from the Ho Chi Minh City Open University in Vietnam in 2020. His works may be found in the SCOPUS and ISI databases. He is a member of the Advisory International Editorial Board of Jurnal the Messenger, an ISI system journal, as well as the editorial boards of Scopus-indexed journals such as Journal of System and Management Sciences; Advances in Operations Research; Journal of Logistics, Informatics and Service Science, as well as the International Journal of Technology Transfer and Commercialisation from Inderscience Publisher. His study interests are methodology, electronic commerce, organizational behavior, machine learning, and consumer behavior. He may be reached by email at [email protected].
Tran Trong Huynh
Tran Trong Huynh is a lecturer at FPT University; he got a Master’s degree in Mathematics in 2013 at Ho Chi Minh City University of Education and Finance in 2020 at the University of Economics Ho Chi Minh City. His current research interests include finance, applied mathematics, data science, econometrics, and machine learning. He can be contacted at email: [email protected].
References
- Angelidis, T., Sakkas, A., & Tessaromatis, N. (2015). Stock market dispersion, the business cycle and expected factor returns. Journal of Banking & Finance, 59, 265–15. https://doi.org/10.1016/j.jbankfin.2015.04.025
- Anh, T. T. T. (2017). The Fama-French three-factor model in Vietnam-A quantile regression approach. Banking Technology Review, 1(2), 239–256.
- Avramov, D., & Chordia, T. (2006). Asset pricing models and financial market anomalies. The Review of Financial Studies, 19(3), 1001–1040. https://doi.org/10.1093/rfs/hhj025
- Benkraiem, R., & Zopounidis, C. (2021). Preface: Regression methods based on or techniques and computational aspects in management, economics and finance. Annals of Operations Research, 306(1), 1–6. https://doi.org/10.1007/s10479-021-04306-7
- Berk, J. B., Green, R. C., & Naik, V. (1999). Optimal investment, growth options, and security returns. The Journal of Finance, 54(5), 1553–1607. https://doi.org/10.1111/0022-1082.00161
- Campbell, J. Y., & Vuolteenaho, T. (2004). Bad beta, good beta. The American Economic Review, 94(5), 1249–1275. https://doi.org/10.1257/0002828043052240
- Capaul, C., Rowley, I., & Sharpe, W. F. (1993). International value and growth stock returns. Financial Analysts Journal, 49(1), 27–36. https://doi.org/10.2469/faj.v49.n1.27
- Chan, L. K., Hamao, Y., & Lakonishok, J. (1991). Fundamentals and stock returns in Japan. The Journal of Finance, 46(5), 1739–1764. https://doi.org/10.1111/j.1540-6261.1991.tb04642.x
- Chen, Y., & Hao, Y. (2017). A feature weighted support vector machine and K-nearest neighbor algorithm for stock market indices prediction. Expert Systems with Applications, 80, 340–355. https://doi.org/10.1016/j.eswa.2017.02.044
- Chen, N. F., & Zhang, F. (1998). Risk and return of value stocks. The Journal of Business, 71(4), 501–535. https://doi.org/10.1086/209755
- Clark, E., & Qiao, Z. (2020). The value premium puzzle, behavior versus risk: New evidence from China. The Quarterly Review of Economics and Finance, 76, 12–21. https://doi.org/10.1016/j.qref.2019.04.007
- Cortes, C., & Vapnik, V. (1995). Support-vector networks. Machine Learning, 20(3), 273–297. https://doi.org/10.1007/BF00994018
- Dhiman, H. S., Deb, D., & Guerrero, J. M. (2019). Hybrid machine intelligent SVR variants for wind forecasting and ramp events. Renewable and Sustainable Energy Reviews, 108, 369–379. https://doi.org/10.1016/j.rser.2019.04.002
- Doshi, H., Jacobs, K., Kumar, P., & Rabinovitch, R. (2019). Leverage and the cross‐section of equity returns. The Journal of Finance, 74(3), 1431–1471. https://doi.org/10.1111/jofi.12758
- Ebrahim, M. S., Girma, S., Shah, M. E., & Williams, J. (2014). Rationalizing the value premium in emerging markets. Journal of International Financial Markets, Institutions and Money, 29, 51–70. https://doi.org/10.1016/j.intfin.2013.11.005
- Fama, E., & French, K. (1992). The cross-section of expected stock returns. The Journal of Finance, 47(2), 427–465. https://doi.org/10.1111/j.1540-6261.1992.tb04398.x
- Fama, E. F., & French, K. R. (1993). Common risk factors in the returns on stocks and bonds. Journal of Financial Economics, 33(1), 3–56. https://doi.org/10.1016/0304-405x(93)90023-5
- Fama, E. F., & French, K. R. (1998). Value versus growth: The international evidence. The Journal of Finance, 53(6), 1975–1999. https://doi.org/10.1111/0022-1082.00080
- Fama, E. F., & French, K. R. (2015). A five-factor asset pricing model. Journal of Financial Economics, 116(1), 1–22. https://doi.org/10.1016/j.jfineco.2014.10.010
- Fama, E. F., & French, K. R. (2021). The value premium. The Review of Asset Pricing Studies, 11(1), 105–121. https://doi.org/10.1093/rapstu/raaa021
- Freyberger, J., Neuhierl, A., Weber, M., & Karolyi, A. (2020). Dissecting characteristics nonparametrically. The Review of Financial Studies, 33(5), 2326–2377. https://doi.org/10.1093/rfs/hhz123
- Gagliardini, P., Ossola, E., & Scaillet, O. (2016). Time‐varying risk premium in large cross‐sectional equity data sets. Econometrica, 84(3), 985–1046. https://doi.org/10.3982/ECTA11069
- Gang, J., Qian, Z., & Chen, F. (2019). The Aumann-Serrano risk factor and asset pricing: Evidence from the Chinese A-share market. Quantitative Finance, 19(10), 1599–1608. https://doi.org/10.1080/14697688.2019.1605187
- Gordon, M. J. (1959). Dividends, earnings, and stock prices. The Review of Economics and Statistics, 41(2), 99–105. https://doi.org/10.2307/1927792
- Henrique, B. M., Sobreiro, V. A., & Kimura, H. (2018). Stock price prediction using support vector regression on daily and up to the minute prices. The Journal of Finance and Data Science, 4(3), 183–201. https://doi.org/10.1016/j.jfds.2018.04.003
- Huang, H., Wei, X., & Zhou, Y. (2016). A sparse method for least squares twin support vector regression. Neurocomputing, 211, 150–158. https://doi.org/10.1016/j.neucom.2015.12.133
- Ismailov, A., & Rossi, B. (2018). Uncertainty and deviations from uncovered interest rate parity. Journal of International Money and Finance, 88, 242–259. https://doi.org/10.1016/j.jimonfin.2017.07.012
- Jaffe, J. F., Jindra, J., Pedersen, D. J., & Voetmann, T. (2020). Can mispricing explain the value premium? Financial Management, 49(3), 615–633. https://doi.org/10.1111/fima.12272
- Jagannathan, R., & Wang, Z. (1996). The conditional CAPM and the cross‐section of expected returns. The Journal of Finance, 51(1), 3–53. https://doi.org/10.1111/j.1540-6261.1996.tb05201.x
- Khoa, B. T., & Huynh, T. T. (2022a, 21-22 January, 2022). Factors affecting forecast accuracy of individual stocks: SVR algorithm under CAPM framework. Paper presented at the 2022 International Conference for Advancement in Technology (ICONAT). Goa, India. https://doi.org/10.1109/ICONAT53423.2022.9725916
- Khoa, B. T., & Huynh, T. T. (2022b). Forecasting stock price movement direction by machine learning algorithm. International Journal of Electrical and Computer Engineering (IJECE), 12(6), 6625. https://doi.org/10.11591/ijece.v12i6.pp6625-6634
- Khoa, B. T., & Huynh, T. T. (2022c. 23-25 March, 2022). The impact of company characteristics and macro factors on stock prices: Machine learning approach. Paper presented at the 2022 International Conference on Decision Aid Sciences and Applications (DASA). https://doi.org/10.1109/DASA54658.2022.9764989
- Khoa, B. T., Huynh, T. T., & Gong, D. (2021). Is it possible to earn abnormal return in an inefficient market? An approach based on machine learning in stock trading. Computational Intelligence and Neuroscience, 2021, 1–14. https://doi.org/10.1155/2021/2917577
- Kirby, C. (2019). The value premium and expected business conditions. Finance Research Letters, 30, 360–366. https://doi.org/10.1016/j.frl.2018.10.022
- Koijen, R. S., Lustig, H., & Van Nieuwerburgh, S. (2017). The cross-section and time series of stock and bond returns. Journal of Monetary Economics, 88, 50–69. https://doi.org/10.1016/j.jmoneco.2017.05.006
- Kudar, A., & Sayılgan, G. (2021). A new sustainable dividend policy and valuation model: Decreasing growth rate model. Managerial and Decision Economics, 42(6), 1638–1642. https://doi.org/10.1002/mde.3332
- Lakonishok, J., Shleifer, A., & Vishny, R. W. (1994). Contrarian investment, extrapolation, and risk. The Journal of Finance, 49(5), 1541–1578. https://doi.org/10.1111/j.1540-6261.1994.tb04772.x
- Lettau, M., & Ludvigson, S. C. (2005). Expected returns and expected dividend growth. Journal of Financial Economics, 76(3), 583–626. https://doi.org/10.1016/j.jfineco.2004.05.008
- Liu, J., Stambaugh, R. F., & Yuan, Y. (2019). Size and value in China. Journal of Financial Economics, 134(1), 48–69. https://doi.org/10.1016/j.jfineco.2019.03.008
- Loughran, T. (1997). Book-to-market across firm size, exchange, and seasonality: Is there an effect? The Journal of Financial and Quantitative Analysis, 32(3), 249–268. https://doi.org/10.2307/2331199
- Ma, Y., Han, R., & Wang, W. (2021). Portfolio optimization with return prediction using deep learning and machine learning. Expert Systems with Applications, 165, 113973. https://doi.org/10.1016/j.eswa.2020.113973
- Neves, M. E., Pinto, M. A., de Assunção Fernandes, C. M., & Vieira, E. F. S. (2021). Value and growth stock returns: International evidence (JES). International Journal of Accounting & Information Management, 29(5), 698–733. https://doi.org/10.1108/IJAIM-05-2021-0097
- Ouerhani, N., Loehr, B., Rizzotti-Kaddouri, A., Santo De Pinho, D., Limat, A., & Schinderholz, P. (2022). Data-driven thermal deviation prediction in turning machine-tool-a comparative analysis of machine learning algorithms. Procedia computer science, 200, 185–193. https://doi.org/10.1016/j.procs.2022.01.217
- Pan, Y., Xiao, Z., Wang, X., & Yang, D. (2017). A multiple support vector machine approach to stock index forecasting with mixed frequency sampling. Knowledge-Based Systems, 122, 90–102. https://doi.org/10.1016/j.knosys.2017.01.033
- Qadan, M., & Jacob, M. (2022). The value premium and investors’ appetite for risk. International Review of Economics & Finance, 82, 194–219. https://doi.org/10.1016/j.iref.2022.06.014
- Rosenberg, B., Reid, K., & Lanstein, R. (1985). Efficient capital markets: II. Persuasive Evidence of Market Inefficiency, 11(3), 9–16. https://doi.org/10.3905/jpm.1985.409007
- Rossi, B., & Sekhposyan, T. (2015). Macroeconomic uncertainty indices based on nowcast and forecast error distributions. The American Economic Review, 105(5), 650–655. https://doi.org/10.1257/aer.p20151124
- Skinner, D. J., & Sloan, R. G. (2002). Earnings surprises, growth expectations, and stock returns or don’t let an earnings torpedo sink your portfolio. Review of Accounting Studies, 7(2), 289–312. https://doi.org/10.1023/A:1020294523516
- Smith, S. C., & Timmermann, A. (2022). Have risk premia vanished? Journal of Financial Economics, 145(2), 553–576. https://doi.org/10.1016/j.jfineco.2021.08.019
- Stambaugh, R. F. (1999). Predictive regressions. Journal of Financial Economics, 54(3), 375–421. https://doi.org/10.1016/S0304-405X(99)00041-0
- Stattman, D. (1980). Book values and stock returns. The Chicago MBA: A Journal of Selected Papers, 4(1), 25–45.
- Thomas, S., Pillai, G. N., & Pal, K. (2017). Prediction of peak ground acceleration using ϵ-SVR, ν-SVR and Ls-SVR algorithm. Geomatics, Natural Hazards and Risk, 8(2), 177–193. https://doi.org/10.1080/19475705.2016.1176604
- Varela, O. (2022). Duration‐adjusted betas. Review of Financial Economics, 40(2), 168–173. https://doi.org/10.1002/rfe.1144
- Yin, L., & Nie, J. (2021). Adjusted dividend-price ratios and stock return predictability: Evidence from China. International Review of Financial Analysis, 73, 101618. https://doi.org/10.1016/j.irfa.2020.101618
- Zhang, J., Li, L., & Chen, W. (2021). Predicting stock price using two-stage machine learning techniques. Computational Economics, 57(4), 1237–1261. https://doi.org/10.1007/s10614-020-10013-5
- Zheng, J., Wang, Y., Li, S., & Chen, H. (2021). The stock index prediction based on SVR model with bat optimization algorithm. Algorithms, 14(10), 299. https://doi.org/10.3390/a14100299
