
 ?Mathematical formulae have been encoded as MathML and are displayed in this HTML version using MathJax in order to improve their display. Uncheck the box to turn MathJax off. This feature requires Javascript. Click on a formula to zoom.
Abstract
This paper aims to establish the asymmetric effects in the short and long term of cyclical output on Algeria’s unemployment rate during the period 1970–2018. To achieve this objective, the “Okun” relation was applied, relying on a NARDL model methodology in the estimation. The main results of this study are summarized as follows. In the long run, we concluded that unemployment gap in Algeria responds in the same proportion to both recession and economic expansion (with a different signal), where the effect size reached 0,02. This shows a positive and significant effect of the unemployment gap for the last period on the current unemployment gap (where the impact size reached 0,37). In the short run, we concluded that the unemployment gap responds to recession only but does not respond to recovery. Finally, through the analysis of the dynamic multiplier effects, we concluded that the unemployment gap responds slowly to negative changes compared to positive changes in the output gap at the beginning of the period, but they converge in the long term (after 7–8 years). From a policy perspective, it follows that an increase in economic growth will not only have the desired result of reducing the overall unemployment rate, but will also have the distributional effect of reducing youth unemployment.
1. Introduction
The analysis of the growth-unemployment relationship and its repercussions on the economic space raises two types of complementary questions (Dixon et al., Citation2016). The first relates to the qualitative changes in the conditions for economic growth and the nature of the resulting combinations of jobs. The second concerns the specificity of economic territories and the challenges revealed by non-uniform local dynamics. These are questions that continue to fuel the economic debate, but with greater intensity since the onset of the economic crisis. Indeed, the appearance of massive and lasting unemployment, the reformulations of professional integration trajectories as well as the apparent inadequacy of the training-employment relationship are the mark of a structurally modified labor market driven by major currents of flexibility, precariousness and segmentation (Economou & Psarianos, Citation2016). However, increasing the growth rate does not necessarily mean reducing the unemployment rate for several reasons. First, the labor force may grow at a rate greater than that of employment. Second, economic growth may have low employment content depending on productivity growth (Huang & Lin, Citation2008). However, despite all efforts, the number of the unemployed remains high throughout the world, where the number of the unemployed exceeds 170 million in 2018 (ILO, Citation2019). Although the same organization (ILO) expected a decrease in the number of unemployed people in the world during the years 2019 and 2020, its expectations were untrue. Indeed, there are around 188 million unemployed worldwide in the year 2019, against the average 5.4% unemployment rate (ILO, Citation2020).
The disruption of major economic balances highlighted the need for a structural restructuring of economies on the productive level (Ball et al., Citation2017). New challenges are then specified and articulated around technological and organizational vectors. The productive system confronted with new production constraints has gradually integrated adaptation strategies based essentially on the flexibility described by GB Benko as numerical flexibility (the ability to act on the workforce) and functional flexibility (the ability to act on the tasks performed within the company). This dual trend was accompanied by massive layoffs and broad attempts to reformulate skills and qualifications. It is in this context that unemployment took off to reach, today, levels that are highly disruptive to social cohesion, as long as this trend is not fundamentally altered by phases of economic growth resumption.
In macroeconomics and applied economic policy, Okun’s law still enjoys a stable position despite some criticism and reevaluations. Although Okun’s law has a largely empirical basis, its criticism is not so much directed at its observation that changes in output growth lead to changes in unemployment. In contrast, the study emphasizes the fact that the relationship does not need to be linear, and that it is non-linear and time-varying instead. A country’s output-unemployment fluctuation intensity will vary depending on its economic situation (Ball et al., Citation2017; Bod’a & Považanová, Citation2021; Zanin & Marra, Citation2012). Nevertheless, structural breaks may also occur in the presupposed empirical regularity (Grant, 218; Woo, Citation2023), Coefficients of Okun’s time-variance (Karlsson & Österholm, Citation2020) and over the cycle of business, there is an even asymmetry (Coşar & Yavuz, Citation2021; Donayre, Citation2022). According to other studies, unemployment is more responsive to business fluctuations based on gender and age (Butkus & Seputiene, Citation2019; Butkus et al., Citation2022; Coşar & Yavuz, Citation2021; Donayre, Citation2022; Lim et al., Citation2021; Mihajlović & Fedajev, Citation2021; Mihajlović, Citation2020; Widarjono, Citation2020). The Okun’s law studies to focus on one economy (such as the US), but cross-country comparisons are also popular, and they use typically a basal econometric framework to compare multiple economies in a comparative fashion (such as the G7). The asymmetric output-unemployment relationships have also been reported in studies, depending on the gender and the business cycle phase. This dual asymmetry has been studied by Woo (Citation2023) for the South Korea, Boďa and Považanová (Citation2023) for G7, and by Ben-Salha and Mrabet (Citation2019) for North African countries.
The question of GDP-employment nexus has generated a lot of ink in recent years. The official unemployment rate contradicts the basic laws of economics (the employment rate is a function of the growth rate). Indeed, the IMF (2007) report gives an unemployment rate of 20%, and indicates a growing duality between decreasing permanent jobs and increasing temporary jobs. Unemployment strikes the poorly trained, but also higher education graduates, demonstrating a slowdown in economic activity and the inability of the economic apparatus to adapt to new international changes. The study of the growth-unemployment relationship is interesting in the Algerian context. Algeria has experienced high unemployment rates despite the strong investment in education and the economic reforms adopted since the late 1980s. In addition, unemployment in Algeria is structural insofar as the proportion of long-term unemployed (more than one year) has increased considerably. Thus, the economic growth achieved in recent decades has not generated enough jobs to absorb new job seekers, especially women and young graduates. The worsening of the unemployment rate, one of the main factors leading to the events in Algeria from mid-December 2010, has reopened the debate on the relationship between the growth rate and the unemployment rate. The main objective of this paper is precisely to measure the sensitivity of unemployment to variations in the GDP growth rate in Algeria, which amounts to estimating the Okun coefficient and checking its validity.
This article is structured as follows. The second section provides an overview of the literature on the Okun relationship. The third section presents the characteristics of the relationship between economic growth and unemployment in Algeria. The fourth section describes the methodology adopted. The empirical tests, results, and corresponding interpretations are presented in the fifth section. The final section concludes the paper.
2. Literature review
In a context of massive unemployment, boosting economic growth is often put forward as an adequate solution. However, increasing the growth rate does not necessarily imply decreasing the unemployment rate, for various reasons. First, the labor force may grow at a higher rate than employment. Second, economic growth can have a low employment content depending on productivity growth (Huang & Lin, Citation2008). Indeed, a negative shock to the output gap, for example, which translates into a fall in production relative to its potential level, can force companies to reduce their demand for employment and, sometimes, even to lay off the least efficient performers. Consequently, this generally results in an increase in the supply of employment in the labor market and, therefore, probably in a fall in real wages, a fall in the final consumption of households and, consequently, in an increase of the unemployment rate.
A brief review of the literature to date indicates that the paper by A. Okun (Citation1962) is pioneering in the study of the relationship between unemployment and income for USA over the 1947–60 period. This so-called “Okun’s law” relationship determines the growth threshold from which the unemployment rate begins to decline. Okun concludes that 1% real GDP growth in the United States decreases the unemployment rate by 0.4%. In addition, when the growth rate reaches 3%, the unemployment rate tends to stabilize. Beyond 3%, the jobs created lead the unemployment rate to decrease. When we refer back to the literature review on “Okun’s law”, we see that it went through three stages:(i) The first stage studied the simple relationship of Okun’s law or Okun’s relationship through the simple (static) model. One of the most noted studies that distinguished this stage is that of A. Okun (Citation1962) about GDP and the unemployment in the case of the American economy. In addition, we find the study of A. M. Okun (Citation1970) that indicated the existence of two forms to this relationship. Then it was followed at the same stage by the study of Smith () which confirmed again the validity of Okun’s Law in America during the period 1947–1973. (ii) The second stage is the stage in which the dynamic model stranded-out to study the Okun relationship. The most noted studies that distinguished this stage are the works of Jardin and Gaétan (Citation2012). (iii) The third stage is the asymmetric relationship that studied Okun’s law, among the most important studies that pointed to the asymmetric relationship (Cevik et al., Citation2013).
Although all of these studies pointed to the asymmetric GDP-unemployment nexus, they did not provide an effective econometric model for studying the dynamic asymmetric relationship. Non-linearity is commonly observed in economic and financial time series for a variety of reasons. Indeed, economic and financial time series are less likely to follow simple linear paths during the period in which we conduct our research, because several events complicate them. In fact, The Organization of the Petroleum Exporting Countries (OPEC) economic crisis of 1997, the oil shocks in 2008, and the global financial crisis of 2008 were among the most important events during the period 1980–2017. However, this did not last long after that, and during this phase, econometric models were developed to be able to measure the dynamic asymmetric relationship between independent and dependent variables, which contributed to the emergence of the non-linear model (or asymmetric) of Autoregressive-Distributed-lags (the NARDL model). Given that our current paper relies on this model to test Okun’s relationship in the Algerian economy, we will present some previous studies that tried to test Okun’s relationship by applying the NARDL model as follows:
Shin, Yu, et al. (Citation2014) proposed a method for modelling asymmetric cointegration and dynamic multipliers in a NARDL framework. This approach introduces short-run and long-run nonlinearities by decomposing the explanatory variable into positive and negative partial sums. They show that their model can be estimated by OLS, and that bounds-testing can yield reliable long-run inference regardless of the variables’ integration orders. Likewise, Shin, Byungchul, et al. (Citation2014) studied the asymmetric relationship between output and unemployment, and in this study an Autoregressive-Distributed-Lag Model was applied, taking into account the nonlinear or asymmetric relationship (NARDL). This model was applied on the relationship between output and unemployment in the USA, Canada, and Japan during the period 1982–2003. The study concluded that there is a negative (inverse) relationship between GDP and unemployment (this means that the Okun’s relationship was achieved in these countries). In addition, tests showed that the asymmetry in the relationship was significantly achieved for the three countries. Similarly, Tang and Bethencourt (Citation2017) examined the asymmetric relationship between unemployment and output, using the NARDL model in the euro area. The study concluded that the labor market responds to the periodic output in a short term. In contrast, the adjustments are small in the long term. Additionally, Mazorodze and Noureen (Citation2018) applied the NARDL model to study the asymmetric effects between GDP and unemployment in South Africa using quarterly data during the period Q11994-Q42017. The study concluded that there is an asymmetric response in the labor market with respect to output as the unemployment rate rises dramatically during deflation. However, unemployment falls slightly in the case of recovery and this means that growth alone is not sufficient to address unemployment.
Tyokase and Sunday (Citation2019) studied the effects of both oil prices and gross domestic product on unemployment in Nigeria during the period 1981–2016 by applying the NARDL model. The study concluded that the Okun relationship in the Nigerian economy was valid during the study period through the achievement of the inverse relationship between economic growth and unemployment, and the achievement of asymmetry on the effects of negative and positive fluctuations of oil prices on unemployment. Using quarterly data during the period 2000:1–2014:4, Neifar (Citation2020) examined the relationship between GDP and unemployment in MENA countries. The study demonstrated the asymmetry in the impact of GDP on unemployment in the long run for all sample countries of the MENA region, with the exception of Oman, where asymmetry was achieved in the short term. According to Okun’s law, Lamdjed et al., examined the asymmetric effect between unemployment rates and economic growth in Algeria between 1980–2018. Based on a NARDL model, their results indicate that the long-term relationship lacks an equilibrium relationship—which indicates the absence of Okun’s law. The long-term relationships are also symmetric according to the asymmetry test. However, their results indicate that the short-term relationship is asymmetric.
On the other hand, there is a stream in the literature that does confirm the stability of Okun’s coefficient over time. For example, Ball et al. (Citation2013) find that changes in the coefficient during the Great Recession are small and short-lived. They estimate both the gap and difference forms of Okun’s law using OLS on U.S. data from 1960 onward, as well as a gap form on 20 separately advanced economies (in this case, the sample starts in 1980). They point to a strong and stable relationship in most of the countries analyzed, which did not change substantially during the Great Recession. Moreover, the findings of Daly et al. (Citation2014) show that in the recent global crisis, the Okun coefficient remained remarkably similar to that observed in previous deep recessions in the U.S., thus dismissing rumors of the death of Okun’s Law during the Great Recession as greatly exaggerated. Their findings are based on U.S. annual data for the period 1959–2013, using a classical OLS estimate of the difference version of Okun’s law. In addition, using OLS regressions in the form of the difference and deviation for each of the three Baltic states, Ebeke and Everaert (Citation2014) find relatively high Okun coefficients. Moreover, their rolling regressions show that the Okun coefficient tends to decline and that there is no strong indication of a break since the 2008/2009 crisis.
Our research complements the existing empirical studies in three aspects. Firstly, while the majority of studies on the age-dependent Okun’s coefficient investigate how changes in youth unemployment respond to economic growth, we estimate the so-called gap version of Okun’s law. This version allows to estimate unemployment sensitivity to output deviations from its potential level. The second contribution is that we take a close look at the intercept value in the Okun’s law equation. The intercept indicates the unemployment rate when output is at potential level, which corresponds to the definition of a natural (equilibrium) unemployment. Also, contrary to the above-mentioned studies which assume that the output gap has a homogenous effect on unemployment, we allow different effects to occur depending on the gap’s sign (positive/negative).
From this literature review, we can conclude that when applying the linear and/or nonlinear dynamics ARDL bounds testing analysis, we should be cautious with the empirical results and explain them carefully. In summary, this literature shows the sensitivity of the results to the methodological approach and to the economic growth and unemployment. The four reasons most often given for these conflicting results are: (1) the country studied, (2) the methodology used, (3) the number of variables included in the model and (4) the period considered.
3. Economic growth and unemployment in Algeria
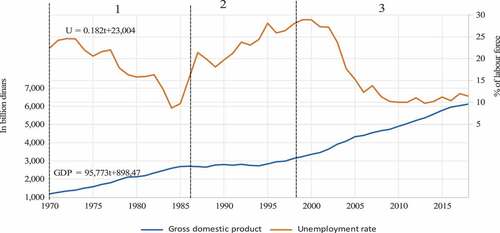
When analyzing the economic situation in Algeria during the study period from 1970 to 2018, we notice that it is divided into the following sub-periods as shown in Figure below:
3.1. The first sub-period (1970–1985)
The Algerian economy witnessed during this period a set of political and economic changes that focused in particular on reforming the industrial and agricultural sectors through the adoption of tripartite and quadruple economic programs in order to drive economic growth and control unemployment rates. The most important of them is the first quadruple plan that spanned from 1980 to 1984. It was aimed at working to restructure public economic institutions by moving away from a centralized management policy. But, since the Algerian economy is a rentier, and a single export economy, where oil dominated nearly 90% of the total exports, this made it fully dependent on the movement of the international oil markets and their fluctuations. Indeed, in 1986, the Algerian economy witnessed an oil shock due to the drop in oil prices to almost half, as the price of a barrel reached 14 dollars in 1986 compared to 27 dollars in 1985. This caused a 50%-decrease of the budget revenues, which reached a deficit of 13.7% of the total output in 1988 and hence the developmental movement declined. Therefore, the state sought to introduce several structural reforms during the period after the oil crisis in 1986, which showed the great fragility that characterized the Algerian economy and its tight association with the hydrocarbon sector. Despite the State’s efforts to reduce high unemployment rates during that period, unemployment levels remained high, ranging between 14.29% (in 1983) and 23.59% (in 1973) (Boualkour, Citation2018).
3.2. The second sub-period (1985–1999)
The main objective of the economic reforms that the country began to actually implement since 1988 was to introduce market economy mechanisms in the conduct of the national economy. But despite the significant progress made by Algeria in the direction of achieving financial and monetary stability, the recorded economic growth was less than the available capabilities, where the average growth rate of real GDP at the beginning of the years of economic reform was − 0.6%. This continued until 1995, when this percentage increased to 3.2% during the period 1995–2000. Limited economic growth resulted in increased unemployment rates, with the purchasing power of the population deteriorating strikingly, resulting in widespread poverty during the 1990s (Keddi, Citation2002). The economic reform program aimed to restore the overall economic balance and the general budget. It exacerbated unemployment, which moved from 21% in 1989 to 29.5% in 2000, where about 52% were sourced from the public sector and 48% from the private sector. Unemployment at this stage was estimated at about 4.2 million people, striking 80% of the youth category (no more than 30 years old); 75% of them having applied for the first time to work. Unemployment also struck about 80,000 university graduates in 1998 among more than 100,000 university graduates. The restructuring further exacerbated unemployment, as more than 460,000 employees lost their jobs or were directed to technical unemployment between 1990–1998. The absence of economic recovery and the absence of a program to support employment at the time, led to a growing demand for labor by the population, which reached 300,000 requests annually. Added to that, the absence of a clear working policy led to an increase in the parallel informal work, especially in the area of commercial activity. Women also took their share of unemployment, where the proportion of unemployed women increased from 125,000 unemployed women in 1992 to 487 000 unemployed women in 1996. It is worth noting that women represent one fifth of the unemployed and most of them live in urban areas (Souag and Assad (Citation2018).
3.3. The third sub-period (1999–2018)
The 3.2% ratio achieved in the rate of economic growth mentioned above was not sufficient to meet the urgent needs of the population, especially in the field of employment, housing and social facilities and living conditions. This situation coincided with a rise in oil prices in 2000 to unprecedented levels ($ 28.60 per barrel). This financial breakthrough allowed the implementation of the economic growth support program to start with an amount of 7 billion ds over a period from 2001 to 2004. It aimed at three major qualitative goals: achieving regional balance, reviving the Algerian economy, creating jobs and fighting poverty. This program was also supported by a complementary program to support growth within the framework of the first five-year plan, which spanned from 2005 to 2009. A financial cover was estimated at $ 114 billion ds. The main objectives of this program include eliminating fragile construction, embodying the high and southern plateau programs as well as developing infrastructure to integrate into the global economy by ratifying partnership contracts and encouraging the private sector. Algeria also witnessed an improvement in its financial conditions during this period thanks to the high oil prices, which moved from 54.6 dollars in 2005 to 98.9 dollars per barrel in 2008. This led to the establishment of the second five-year plan (2010–2014). A financial cover of $286 billion ds was allocated to this program which came to consolidate the growth and projects that were initiated within the first five-year program to reduce unemployment by creating 3 million jobs. Also, education and health were among this program’s priorities, and they were allocated almost half of its total value. The third five-year program, for which a financial cover of $262 billion ds was allocated, was also held. This program came to consolidate economic growth by raising the growth rates to reach 7% in the year 2019 in addition to supplementing investment projects and improving the infrastructure that began to be applied during the previous two programs, with the allocation of 600 projects in the fishing sector (National Office of Statistics).
Our reading of the outcome at the end of the program suggests that the performance of economic growth improved compared to previous years, where its growth recorded an average rate of 3.64% during that period. The economic growth outside petrol also achieved an average growth rate of 5.4% for the same period, which was achieved mainly thanks to the construction and public works sectors, as well as services.
The improvement in economic growth rates during this period allowed the creation of many new job opportunities (approximately 717,000 jobs in 2004) that were intended to create 926,380 permanent jobs and 186,850 non-permanent jobs. Hence, unemployment rates dropped to 17.7%. As for youth unemployment rates, they remained high, as shown in the following figure :
Figure 1. Evolution of youth unemployment during the period 2004–2018.
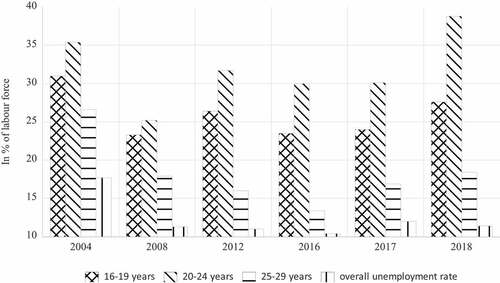
After supporting this program with complementary programs to support growth until the year 2019, this clearly contributed to increasing economic growth; reducing the unemployment rate (which reached 10.4% with about 564,000 new jobs created) and reducing poverty rates to 4.8% in 2016. The following figure illustrates all this:
Based on Figure , we see that in stages 1 and 3 the unemployment rate decreased in conjunction with the increase in the GDP while it increased significantly to reach 30% during the second stage, which is the same stage that saw a decline in the economic growth rate. Generally, the level of real GDP takes a general upward trend (it reached 95.5 billion dinars a year on average) in contrast to the unemployment rate which takes a downward trend at a rate of up to −0,18 per year on average. So, in the long term, the inverse relationship between growth and unemployment stipulated by Okun as shown in Figure is realized.
Figure 2. Evolution of unemployment rate and GDP during the period 1970 –2018.
4. Methodology
4.1. Model specification
A. Okun (Citation1962) showed that there is a relationship between GDP and the unemployment rate. In the same context, A. M. Okun (Citation1970) suggested that there are two versions of this relationship that are represented in both the gap model and the difference model. The model of the gap is presented as follows:
where is the actual GDP;
is the potential GDP;
is the actual unemployment rate;
is the natural unemployment rate;
is the Okun’s coefficient;
is the error term.
The difference model, however, takes into account the relationship between the differences for each GDP and Unemployment. In this section we briefly provide the main methodologies used for estimating Okun’s law. We can provide the two versions of Okun’s law according to the works of (Khemraj et al., Citation2006), and (Biyase & Bonga-Bonga, Citation2007), as follows:
With ∆ the first difference of the variable; is the unemployment rate;
is the logarithm of real GDP. β1 measures how much the unemployment rate changes in percentage points when real GDP changes by 1%.
The second, known as the “gap version”, links the differences in the unemployment rate and the observed GDP respectively to the unemployment rate and to the potential GDP. This version is in the following form:
where ,
represent the difference between the GDP trend and the actual (observed) GDP; the difference between the unemployment rate trend and the actual (observed) unemployment rate, respectively.
,
represent the GDP and unemployment rate trends, respectively.
,
represent both actual GDP (observed) and the actual (observed) unemployment rate, respectively.
The second formula can be represented as follows:
where ,
are also calculated in the same way as seen before.
is the number of lags.
In this model, we need to account for the potential GDP and the natural unemployment rate. In this regard, we find that (HP filter) is one of the most used estimation methods.
HP filter provided by Hodrick and Prescott (Citation1997) represents a smoothing method of time series, to explain this method we suppose that we have:
is the actual time series that we have (observed series);
is the trend component in this series;
is the cyclical component in this series.
The principle of this filter is based on the calculation of the smoothed series—or making the direction element (τ) as a smooth chain not very different from the observed series-, and minimizing the variance of (y) about (τ). This is achieved by making the series variance (τ) as minimal as possible around the second difference, and from here the HP filter selects the series (τ) to minimize the following equation:
where λ: represents the multiplier or the smoothing parameter, and the direction sensitivity of fluctuations is adjusted by adjusting the value of λ.
When (λ → 0); then the estimated series becomes the same
series. But when
(λ →∞); then the estimated series becomes linear.
As we have seen before, several papers have confirmed the asymmetry in Okun’s Law, but they did not provide an efficient method to estimate the asymmetric dynamic relationship (Ball et al., Citation2013, Citation2017; Ebeke & Everaert, Citation2014). Therefore, the matter remained the same until the emergence of the nonlinear Autoregressive-Distributed-Lags-Model (NARDL) which is a model that helps to study asymmetry in the independent—dependent variables nexus in the short and long terms.
4.2. Specification of the NARDL model
The NARDL model is a nonlinear version of the ARDL model. This model has the merit of testing short- and long-term asymmetries. In addition, it has the advantage of allowing the mixing of I(0) and I(1) variables and directly testing the existence of a long-term cointegration relationship. In this model, we use the autoregressive representation of Pesaran et al. (Citation2001) by incorporating short- and long-term asymmetric effects in order to take into account the asymmetry of the unemployment-growth relationship. It can be illustrated in the following formula:
where is decomposed as
and
In order to take into account the asymmetry, equation (7) is modified as follows:
Here, we say that there is an asymmetric unemployment-growth relationship, or we say that these two variables are “asymmetrically cointegrated”, if and only if is stationary.
We can illustrate the application of the NARDL model by applying the following steps:
First Step: Extending the long-term asymmetric regression model previously referred to (last part) to become in form of a NARDL (p, q) as follows:
: is the Autoregressive Parameter;
and
: are the asymmetric parameters of distributed lag;
: is the error term.
and
are calculated as previously seen.
Second Step: Estimating the error correction model (NARDL-ECM) as follows:
where: ،
،
are parameters in the long term and
،
are short-term parameters.
This model can also be written as follows:
where: ;
;
;
;
;
;
;
;
: is the nonlinear error correction term.
;
and
: are parameters in the long term.
Third Step: Testing the null hypothesis of no cointegration in the long term between and
by using the Bounds testing approach as follows:
As seen above, we can also test the short-term relationship and the long-term relationship by testing the following hypotheses:
(15)
The last step of the NARDL procedure derives the positive and negative multipliers with and
computed as (Mazorodze & Noureen, Citation2018):
Finally, the effect of a change of one percent of the dynamic asymmetric multipliers respectively and
on Gdpt can be expressed as follows:
and,
where h = 0,1, 2…
If h→∞, then and
.
5. Data and empirical results
5.1. Data
The data used in this paper are annual during the period 1970–2018 and were collected based on the National Office of Statistics of Algeria (NOS). Real GDP is expressed as a multiplied logarithm. The unemployment rate is expressed in percentage points. Table illustrates the average unemployment rates and real GDP growth rates in the Algeria for our annual data between 1970 and 2018. This table exhibited an (unweighed) average GDP growth of 14.15 to 24.7%. Unemployment rates were 1.99 to 4.84% on average. After observing the instability of the growth-unemployment relationship in Algeria and the nonlinear specifications in the literature to explain this relationship, we refer to the NARDL model. This model has the merit of testing the asymmetries relationship. The estimate of the Okun relationship in the Algerian economy according to the “gap model” and applying the NARDL model is written as follows:
Table 1. Evolution of average unemployment rate and average economic growth rate
where is the cyclic unemployment rate, which represents the gap between the actual unemployment rate (observed)
and the natural unemployment rate
.
is the Cyclic GDP which represents the gap between actual real GDP (observed)
and the potential GDP which is
.
and the natural unemployment rate
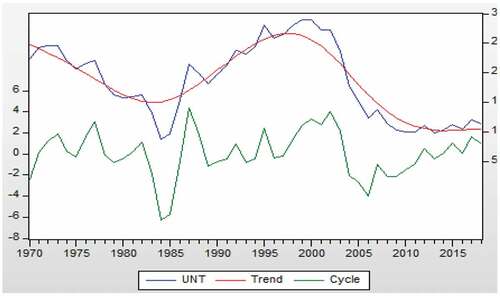
are determined by using the HP Filter method (Hodrick-Prescott Filter). The analysis of the hereunder figures (Figures ) shows that both the potential output and the natural unemployment rate grow when the unemployment rate and the actual output increase permanently. On the other hand, they are not affected when the increase in production and actual unemployment is only temporary.
Figure 3. Output gap.
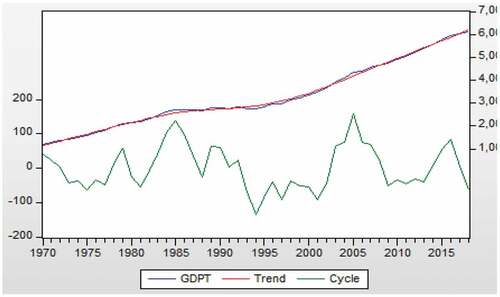
Figure 4. Unemployment gap.
5.2. Empirical results
First, to examine the stationarity of the series, we will apply the ADF and PP tests. As shown in Table , the results show that the GDPC variable is stationary in first difference, while the UNTC variable is stationary at level. Thus, the variables of our study are integrated of order I (0) and I (1), which justifies relying on the ARDL method.
Table 2. Unit root test results
The ARDL method appears to be the best technique for estimating the Okun relationship since it has the advantage of testing long-term relationships between variables with different orders of integration (Mohammed Suliman & Abid, Citation2020). In order to implement the sensitivity of the Okun coefficient to the hypothesis of linearity of the unemployment-growth relationship and to take into account the asymmetry of this relationship, we will also rely on the NARDL technique to estimate it. Second, after determining the order of integration of the different variables, we use the NARDL or Black Box approach for cointegration to determine the relationship between the series in the long run. To do so, we rely on the Bound test for linear and non-linear models. The Bound test results are shown in Table . In this table, we notice that the null hypothesis of no cointegration cannot be rejected for the linear model because the calculated F-stat (2.074) is lower than the upper critical value (4.875). In contrast, the long-term relationship exists when the model is nonlinear and the statistic F-statistic = 8.035, which proves the rejection of the null hypothesis.
Table 3. Bounds test
Diagnostic tests indicate that the specifications adopted are generally satisfactory. The Jarque-Bera and Ramsey RESET tests do not allow the error normality hypothesis to be rejected. The tests carried out to detect the presence of ARCH (Autoregressive Conditional Heteroscedasticity) residues in the estimated equations do not reveal any heteroscedasticity problem at the 5% threshold. Thus, the LM test shows that there is no autocorrelation between the series. In addition, the results show that the graph of CUSUM (Figure ) and CUSUMQ (Figure ) statistics remain within the critical value interval at the 5% threshold, which implies that the model coefficients are stable.
Figure 5. CUSUM Test.
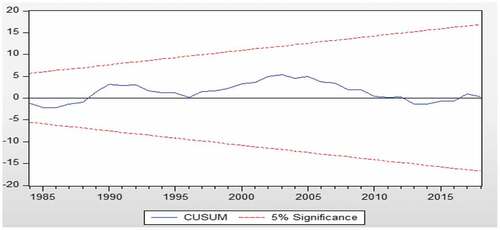
Figure 6. CUSUM of Squares Test.
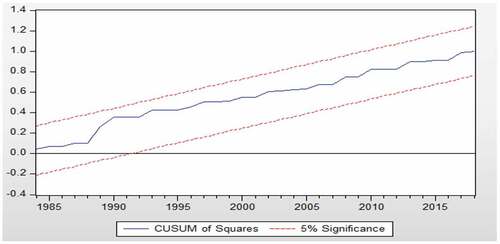
Table 4. Results of the NARDL model
In light of the previous results of the long and short equations for the previous NARDL model, we find that the error correction parameter () is significant at 1% threshold with the expected negative sign. This parameter is equal to approximately (−0.72), which indicates that 72% of the unemployment rate short-run disequilibrium is corrected each year. That is, when the unemployment rate deviates from its equilibrium values during the short period (t-1) in the long run, the equivalent of 72% of this deviation is corrected in the period (t). Likewise, it can be said that the unemployment rate takes approximately
year to adjust to its equilibrium value.
The estimation results also showed that most of the estimated parameters were statistically significant at varying significance levels, with the exception of the variables ,
in the short run. It is also clear from the table that the value of the determination coefficient reached 0,55. This means that the variations in the output gap account for 55% of the changes in the unemployment rate.
In the long run, the results show that GDP+ and GDP- are negative and statistically significant. We can say that if GDP+ increases by 1%, the unemployment gap decreases by 0.02%. Moreover, if GDP- decreases by 1%, the unemployment gap increases by 0.02% in the long run. This result clearly indicates that the unemployment rate in Algeria responds in the same proportion to both recession and economic expansion. By the values of these parameters, we can conclude that in addition to their small values, there is some similarity in the impact size (with a different signal), i.e., in the number of workers who are fired when the economy declines, and those who are hired when the economy recovers. This result is in line with the results of (Neifar, Citation2020) using the same methodology on some MENA countries. He proves that the impact of variations in production on the unemployment rate is similar. This result is theoretically consistent with the labor market hysteresis. The concept of hysteresis effect actually assumes that the actual unemployment (or output) can affect the natural rate of unemployment so there can exist some permanent changes due to the economic recessions and expansions.
The small size of the impact (Okun coefficient) can also be attributed to the fact that most of the workers in Algeria are in the public employment sector (approximately 70%), which does not respond directly to economic activity. Also, the largest proportion of the total output is due to the hydrocarbon sector- which has fewer workers (almost 80% of the output)- and not to the other labor-intensive sectors (especially industry, agriculture, construction and public works). In these sectors, we find that the output fluctuations (positive and negative) are mostly due to the hydrocarbon sector, and not to other sectors.
In the short term, we notice that there is a significant and positive impact of the unemployment gap during the last period on the current unemployment gap, where the impact size reached 0,37. Generally, this relationship shows the importance of the dynamic nature of unemployment. This means that unemployment in the current period depends on the unemployment of the previous period (this is known in the economy as the hysteresis of unemployment).
For the short run, we also notice that the unemployment rate only responds to recession while recovery does not. In addition, most of these negative changes are positive, which suggests that reductions in a cyclical output reduce the unemployment rate. Contrary to economic theory, this confirms that the response of the labor market in Algeria to the output changes is unequal in the short run, unlike the long run.
The results show that negative changes in the output delayed by two and three years are only statistically significant at 5%. The interpretation of these coefficients is that a reduction of cyclical output delayed by two and three years by one unit (1 billion ds) will reduce the unemployment gap by 0.015 and 0.018 percentage points respectively in the short run. This can be explained by the fact that the decrease in the unemployment rate in the short term is not due to economic growth, but the large proportion of this decrease in the unemployment rate during the period is due to the programs and measures implemented by the government to reduce the severity of unemployment and its consequences. What is noticed in Algeria (especially in recent years) is incorporating young people (65% of the unemployed) in work as a result of adopting a professional integration program that provides for the inclusion of the unemployed in state institutions, and that does not constitute an obstacle (i.e., in terms of costs) to these institutions regardless of the number of workers hired because their wages are borne by the state according to this program. On the other hand, women’s participation in work, which represents the largest percentage of the unemployed, increased since 75% were given the right to work during the last five-year plan according to government statements. In addition, among the most important measures taken by the state during the study period, we can mention: the youth employment program, the youth professional integration device, compensation for activities of public benefit, works of public benefit, extensive use of labor, pre-employment contracts, the microcredit program, the National Insurance Fund on Unemployment, the National Agency for Youth Employment Support, the National Investment Development Agency, … etc. It is worth noting that the positive relationship between negative output changes and the unemployment rate confirmed in Table (short-run model) contrasts with many other relevant studies.
Indeed, the results are in line with empirical studies which affirm linearity between unemployment and output, where in the long term, despite the existence of asymmetry, the GDP+ and GDP- are equal, and in the short-run, cyclic unemployment is not affected by positive output changes. Thus, the results assert that unemployment and output react in the same way in the long run, while in the short run the effect depends only on variations in the negative output.
Finally, the weak response of the unemployment gap to the output gap in the long and even short run is also due to the actual unemployment rate being close to the natural unemployment rate, especially during the recent period where the unemployment rate was in the range of 30% in the year 2000 to 11% in recent years and is close to the natural unemployment rate.
5.3. Multiplier effect analysis
Figure hereunder shows that the unemployment rate is slow to respond to negative changes compared to positive changes in periodic output at the beginning of the period. But they converge in the long term to become identical (after the tenth year), where we note that the curve of asymmetry (the asymmetry plot represents the difference between positive and negative output changes) becomes zero after the tenth year.
Figure 7. Dynamic multipliers for Algeria.
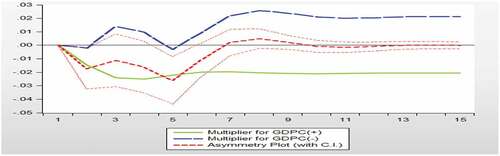
In general, these multiplier effects of positive and negative output gaps are logical and agree with economic theory, where positive output shocks generally lead to a reduction in the unemployment rate, and negative shocks lead to its increase; except at the beginning of the period, where we note that the multiplier effects of the positive output shocks are stronger than the multiplier effects of the negative output shocks at the beginning of the period (i.e., in the short term). Indeed, the asymmetry plot biases and deviates down towards the curve of the multiplier effects of the positive output gap, which indicates a reduction in unemployment rates in the short term in total. This response also increases gradually with time and becomes stronger in the long run for both negative and positive output shocks. This corroborates the results reported in Tables .
In the short run, our results are consistent with those of Marinkov and Geldenhuys (Citation2007) who find a significant negative relationship between cyclical output and cyclical unemployment for South Africa, using an asymmetric error correction model over the period 1970 to 2005. Au contraire, le chômage semble être insensible aux fluctuations de la production pendant les récessions économiques, ce qui suggère une rupture de la relation inverse entre le chômage et la production comme le prédit la loi d’Okun (Palley, Citation1993; R. J. Gordon, Citation2010). In the long run, our results are consistent, for example, with those of Kavase and Phiri (Citation2020), who find that a 1% decrease in cyclical output would reduce the cyclical unemployment gap by 1.66% in the Free State province. Our results are in line with those of Sere and Tchereni (Citation2020), who find an insignificant positive relationship between unemployment and economic growth in South Africa. In contrast, for the case of Algeria, our results are inconsistent with those of Lamdjed et al., (2020) who found that the relationship between economic growth and unemployment is symmetric in the long-term and asymmetric in the short-term according to the asymmetry test. Our paper relied on data from 1970–2018 and the work of Lamdjed et al., (2020) from 1980 to 2018. The difference is that we consider the two oil shocks of 1973 and 1979 during the 1970–1980 period. These two shocks have negative consequences on OPEC countries, Algeria in particular: aggravation of inflation, imbalance of trade balances, and slowdown of economic activity due to austerity policies. The 1973 and 1979 oil shocks led to a severe economic crisis. The Yom Kippur War and the rise in the price of oil brought growth to a sudden halt. Stagflation sets in, with both low growth and accelerating inflation (over 10% per year). Unemployment soars in OPEC countries due to structural changes in the labor force, the slowdown in production and competition from emerging countries. Indeed, fluctuations in oil prices were established as a major cause of economic crises and negative economic growth. The effect of large swings in the price of oil depends on whether a country is an oil importer or exporter. Since oil is an input in several production processes, an increase in oil prices could stimulate economic growth in exporting countries, while a decline in oil prices could limit the positive effects of the influx of hydrocarbon oil revenues. In this sense, Attouchi (Citation2021) examined the relationship between oil shocks and GDP for Algeria using a NARDL model for the 1970–218 period. Their results showed that there was, in the short and long term, an increase in oil prices increases GDP, while a drop in oil prices decreases GDP.
5.4. Robustness checks
To analyze the robustness of our results, we introduced the inflation (INFL) and exchange rate (ER) variables into our relationship (Table ). The results of our estimations show that our variable of interest always keeps the same signs. Indeed, in the long run, the results show that GDP+ and GDP- are negative and statistically significant. We can say that if GDP+ increases by 1%, the unemployment gap decreases by 0.0309%. Moreover, if GDP− decreases by 1%, the unemployment gap increases by 0.0286% in the long run. This result clearly indicates that the unemployment rate in Algeria reacts in the same proportion to both recession and economic expansion.
Table 5. Results of the long-run estimation
For the exchange rate variable, we note that it has a negative and significant effect on the unemployment rate. Thus, the variability of the exchange rate restricts the volume of trade, increases unemployment and reduces employment, which has an important influence on the evaluation of costs and benefits. These results are consistent with the work of Belke and Gros (2002a) who show, in a project for the European Commission, that exchange rate variability can also have significant negative effects on labor markets at the global level. The results indicate that the variability of the transatlantic exchange rate has a negative and significant impact on labor markets in the EU and probably also in the United States. According to the authors, volatility is an important variable that intervenes in investment decisions characterized by a certain degree of irreversibility in the presence of structural rigidities. The same approach is applied to emerging markets by Belke and Gros (2002b) for the Mercosur zone.
For the inflation variable, we can clearly see that it has a negative and significant effect on unemployment. Thus, any increase in inflation levels contributes to a reduction in unemployment levels and vice versa. This result seems to be consistent with economic theory, which predicts an inverse relationship between inflation and unemployment according to the Philips curve. Indeed, when the unemployment rate decreases, wages increase, and companies increase their prices to restore their margins; conversely, prices decrease when unemployment increases.
6. Conclusion
In this study, the relationship between the output gap and the unemployment gap in Algeria during the period 1970–2018 was examined through the use of a non-linear ARDL model recently developed to capture nonlinearity and inequalities. The main results of this study are summarized as follows.
We relied on a full statistical technique for obtaining and distinguishing between structural or natural unemployment and situational unemployment (cyclical) on the one hand, and calculating the probable or natural output and its cyclical level on the other hand. There is a positive and significant effect of the unemployment rate during the last period on the current unemployment rate. This relationship shows an important fact, which is the dynamic nature of unemployment. This means that unemployment in the current period depends on the unemployment of the previous period (this is known in the economy as the hysteresis of unemployment). In the long run, we conclude that the unemployment gap in Algeria is responding in the same proportion to both recession and economic expansion, where the effect size reached 0.02. In the short run, we conclude that the unemployment gap responds only to recession and does not respond to recovery. In addition, most of these negative changes have positive signs, and thus the response of the unemployment gap in Algeria to the output changes is unequal in the short term. By analyzing the dynamic multiplier effects, we conclude that the unemployment gap is slow to respond to negative changes compared to positive changes in output gap at the beginning of the period, but they converge in the long term to become identical.
From there, we can suggest that one of the challenges of economic policies in Algeria should relate not only to an improvement in the job content of economic growth but also to the promotion of enough qualified jobs to cope with the growing influx of graduates. The absorption of this category of job seekers would at the same time increase labor productivity, which has always been well below its potential. On the supply side, faced with the weak capacity of the public sector to create enough jobs to reduce the severity of unemployment, in particular for university degrees, the economic policies to be implemented would benefit from favoring the support of the private sector and promote entrepreneurship. In this sense, it would be effective to subsidize the creation of businesses and to clean up the business environment in order to boost private investment. Likewise, labor market institutions should evolve to alleviate the rigidity that undermines the willingness and ability of companies to hire young people. On the job demand side, reframing the education system is essential in order to better adapt training to the needs of the production system. In general, active employment policies should target more particularly young graduates, women and certain disadvantaged regions where the unemployment rate has reached alarming levels.
Indeed, macroeconomic policy can play a role in stimulating aggregate demand to generate a sustainable reduction in the level of unemployment in Algeria. The integration of the Okun relationship provides a more appropriate tool to analyze the effects of economic policies on unemployment. In other words, economic policy (fiscal and/or monetary), while having a positive effect on economic growth, would lead to higher unemployment if it creates a vicious structural change in the Okun relationship. The most effective economic stimulus policy in the fight against unemployment is the one that, in addition to accelerating economic growth, induces a virtuous structural change in the Okun relationship. Thus, the Okun’s law theorem opens up new perspectives, particularly at the empirical level, for the analysis of the quality of economic growth on the one hand, and for the objective evaluation of the quality of economic policy options from the point of view of their impact on employment on the other.
Some limitations of this study can also provide future research opportunities. A panel data approach can also be used to test the validity of these hypotheses simultaneously for a group of countries, since this study only examines the impact of output on unemployment for Algeria. The contribution of the paper can be enhanced by investigating the time varying sensitivity of such a relationship, e.g., explore macroeconomic factors that influence the strength of the relationship between output and unemployment over time. A number of novel recent econometric techniques, including cross-section autoregressive distributed-lag model (CS-ARDL) and machine learning algorithms, can also be applied to future studies to enhance the understanding of the current situation.
Acknowledgements
The authors extend their appreciation to the Deanship of Scientific Research at Jouf University for funding this work through research grant No (DSR-2021-04-0202).
Disclosure statement
No potential conflict of interest was reported by the authors.
References
- Attouchi, M. (2021). Estimation de l’impact des chocs pétroliers sur les taux du PIB algérien: analyse par le modèle NARDL. Repères et Perspectives Economiques, 5(2), 21–20.
- Ball, L., Leigh, D., & Loungani, P., 2013. Okun’s law: Fit at Fifty. IMF Working Paper WP/13/10.
- Ball, L., Leigh, D., & Loungani, P. (2017). Okun’s law: Fit at 50? Journal of Money, Credit, and Banking, 49(7), 1413–1441.. https://doi.org/10.1111/jmcb.12420
- Ben-Salha, O., & Mrabet, Z. (2019). Is economic growth really jobless? Empirical evidence from North Africa. Comparative Economic Studies, 61(4), 598–624.. https://doi.org/10.1057/s41294-018-00082-9
- Biyase, M., & Bonga-Bonga, L. (2007). South Africa’s Growth paradox. DEGIT Conference Papers c012_043. [Online] Available: http://degit.sam.sdu.dk/papers/degit_12/C012_043.pdf.
- Bod’a, M., & Považanová, M. (2021). Output-unemployment asymmetry in Okun coefficients for OECD countries. Economic Analysis and Policy, 69, 307–323.. https://doi.org/10.1016/j.eap.2020.12.004
- Boďa, M., & Považanová, M. (2023). How credible are Okun coefficients? The gap version of Okun’s law for G7 economies. Economic Change and Restructuring, 1–48.. https://doi.org/10.1007/s10644-022-09438-9
- Boualkour, N. (2018). Determinants of unemployment in Algeria during the period 1970-2016 in the framework of the ARDL model. Annals Journal of University of Algeria, 1, 32 (02.
- Butkus, M., Dargenytė-Kacilevičienė, L., Matuzevičiūtė, K., Ruplienė, D., & Šeputienė, J. (2022). Do Gender and Age Matter in Employment–Sectoral Growth Relationship Over the Recession and Expansion. Ekonomika, 101(2), 38–51..
- Butkus, M., & Seputiene, J. (2019). The output gap and youth unemployment: An analysis based on Okun’s law. Economies, 7(4), 108.. https://doi.org/10.3390/economies7040108
- Cevik, E. I., Dibooglu, S., & Barisik, S. (2013). Asymmetry in the unemployment–output relationship over the business cycle: Evidence from transition economies. Comparative Economic Studies, 55(4), 557–581. https://doi.org/10.1057/ces.2013.7
- Coşar, E. E., & Yavuz, A. A. (2021). Okun’s law under the demographic dynamics of the Turkish labor market. Central Bank Review, 21(2), 59–69.. https://doi.org/10.1016/j.cbrev.2021.03.002
- Daly, M. C., Fernald, J., Jordà, O., & Nechio, F. (2014). Interpreting deviations from Okun’s Law. Federal Reserve Bank of San Francisco, FRBSF Economic Letter.
- Dixon, R., Lim, G. C., van Ours, van Ours, J. C., & Jan, C. (2016). Revisiting the Okun relationship. Applied Economics, 49(28), 2749–2765. https://doi.org/10.1080/00036846.2016.12458460
- Donayre, L. (2022). On the behavior of Okun’s law across business cycles. Economic Modelling, 112, 105858.. https://doi.org/10.1016/j.econmod.2022.105858
- Ebeke, C., & Everaert, G., 2014. Unemployment and Structural Unemployment in the Baltics. IMF Working Paper WP/14/153.
- Economou, A., & Psarianos, I. N. (2016). Revisiting Okun’s Law in European Union countries. Journal of Economic Studies, 43(2), 275–287. https://doi.org/10.1108/JES-05-2013-0063
- Gordon, R. J. (2010). Okun’s law and productivity innovations. The American Economic Review, 100(2), 11–15. https://doi.org/10.1257/aer.100.2.11
- Hodrick, R., & Prescott, E. (1997). Postwar US business cycles: An empirical investigation. Journal of Money, Credit, and Banking, 29(01), 01–16. https://doi.org/10.2307/2953682
- Huang, H., & Lin, S. (2008). Smooth-time-varying Okun’s coeffcient. Economic Modelling, 25(2), 363–375. https://doi.org/10.1016/j.econmod.2007.06.009
- ILO. (2019). World Employment Social outlook_trends 2019. ILO Centenary Declaration for the Future of Work. Geneva: International Labour Organization.
- International Labour Office. (2020) . Global employment trends for youth 2020: Technology and the future of jobs. International Labour Organisation (ILO)..
- Jardin, M., & Gaétan, S. (2012). How Okun’s law is non-linear in Europe: A semi-parametric approach. 16th International Conference on Macroeconomic Analysis & International Finance (pp. 01–23). https://icmaif.soc.uoc.gr/~icmaif/Year/2012/papers/paper_1_32.pdf.
- Karlsson, S., & Österholm, P. (2020). A hybrid time-varying parameter Bayesian VAR analysis of Okun’s law in the United States. Economics Letters, 197, 109622.. https://doi.org/10.1016/j.econlet.2020.109622
- Kavase, K., & Phiri, A. (2020). A provincial perspective of nonlinear Okun’s Law for emerging markets: The case of South Africa. Studia Universitatis “Vasile Goldis Arad. Economics Series, 30(3), 59–76. https://doi.org/10.2478/sues-2020-0017
- Keddi, A. (2002). Economic reforms in Algeria: An evaluation attempt. Notebooks of CREAD, 61, 03.
- Khemraj, T., Madrick, J., & Semmler, W. (2006, March 04). Okun’s Law and Jobless Growth. Working Paper, N°03, 01–10. The New School for Social Research.
- Lim, G. C., Dixon, R., & van Ours, J. C. (2021). Beyond Okun’s law: Output growth and labor market flows. Empirical Economics, 60(3), 1387–1409.. https://doi.org/10.1007/s00181-019-01794-2
- Marinkov, M., & Geldenhuys, J. P. (2007). Cyclical unemployment and Cyclical output: An estimation of Okun’s Coefficient for South Africa: 1970-2005. South African Journal of Economies, 75(3), 373–390. https://doi.org/10.1111/j.1813-6982.2007.00134.x
- Mazorodze, B. T., & Noureen, S. (2018). On the unemployment-output relation in South Africa: A Non-Linear ARDL Approach. Journal of Economics and Behavioral Studies, 10(05), 167–178. https://doi.org/10.22610/jebs.v10i5(J).2506
- Mihajlović, V. (2020). The nexus between unemployment and economic growth in Serbia: Does Okun’s law hold? Ekonomika preduzeća, 68(7–8), 484–499.. https://doi.org/10.5937/EKOPRE2008484M
- Mihajlović, V., & Fedajev, A. (2021). Okun’s Law (A) symmetry in SEE Countries: Evidence from Nonlinear ARDL model. Romanian Journal of Economic Forecasting, 24(3), 140–157..
- Mohammed Suliman, T. H., & Abid, M. (2020). The impacts of oil price on exchange rates: Evidence from Saudi Arabia. Energy Exploration & Exploitation, 38(5), 2037–2058.. https://doi.org/10.1177/0144598720930424
- Neifar, M. 2020. Cyclical output, cyclical unemployment, and augmented Okun’s Law in MENA zone. N°98953. Récupéré sur University Library of Munich, https://mpra.ub.uni-muenchen.de/98953/1/MPRA_paper_98953.pdf.
- Okun, A. (1962). Potential GNP: Its Measurement and Significance.” Reprinted as Cowles Foundation Paper 190. http://cowles.econ.yale.edu/P/cp/p01b/p0190.pdf
- Okun, A. M. (1970). Political Economy of Prosperity.W. W. Norton & Company.
- Palley, T. I. (1993). Okun’s Law and the asymmetric and changing cyclical behaviour of the USA economy. International Review of Applied Economics, 7(2), 144–162. https://doi.org/10.1080/758530144
- Pesaran, M. H., Shin, Y., & Smith, R. J. (2001). Bounds testing approaches to the analysis of level relationships. Journal of Applied Econometrics, 16(3), 289–326.. https://doi.org/10.1002/jae.616
- Sere, K. A., & Tchereni, B. H. M. (2020). Nonlinear modelling of economic growth and unemployment in South Africa. Œconomica, 16(6), 273–282.
- Shin, Y., Byungchul, Y., & Matthew, G.N. (2014). Modelling asymmetric cointegration and dynamic multipliers in a nonlinear ARDL framework. In R. C. Sickles & W. C. Horrace (Eds.), The Festschrift in Honor of Peter Schmidt.: Econometric Methods and Applications (pp. 281–314). Springer.
- Shin, Y., Yu, B., & Greenwood-Nimmo, M. (2014). Modelling Asymmetric Cointegration and Dynamic Multipliers in a Nonlinear ARDL Framework. In R. Sickles & W. Horrace (Eds.), Festschrift in Honor of Peter Schmidt. New York, NY: Springer. https://doi.org/10.1007/978-1-4899-8008-3_9
- Smith, G. (1975). Okun’s law revisited. The Quarterly Review of Economics and Business, 15(04), 37–54.
- Souag, A., & Assaad, R. (2018). Replace Masette and Hammouda (1999) with Souag and Assad. Middle East Development Journal, 10(2), 272–298.
- Tang, B., & Bethencourt, C. (2017). Asymmetric unemployment-output tradeoff in the Eurozone. Journal of Policy Modeling, 39(3), 465–466. https://doi.org/10.1016/j.jpolmod.2017.01.003
- Tyokase, T., & Sunday, E. A. (2019). Oil price volatility and unemployment in Nigeria. World Journal of Innovative Research (WJIR), 07(06), 27–51.
- Widarjono, A. (2020). Asymmetric Okun’s law in an emerging market: ASEAN-3 case. Economics & Sociology, 13(3), 203–217.. https://doi.org/10.14254/2071-789X.2020/13-3/12
- Woo, J. (2023). Revisiting Okun’s law in South Korea: Asymmetries, crises, and structural changes. The Journal of Economic Asymmetries, 27, e00292.. https://doi.org/10.1016/j.jeca.2023.e00292
- Zanin, L., & Marra, G. (2012). Rolling regression versus time‐varying coefficient modelling: An empirical investigation of the Okun’s Law in some euro area countries. Bulletin of Economic Research, 64(1), 91–108.. https://doi.org/10.1111/j.1467-8586.2010.00376.x