
 ?Mathematical formulae have been encoded as MathML and are displayed in this HTML version using MathJax in order to improve their display. Uncheck the box to turn MathJax off. This feature requires Javascript. Click on a formula to zoom.
Abstract
Cryptocurrencies have, over the years, gained an unprecedented prominence in financial discourse, with the market fielding over 5,300 digital currencies and reaching over $2 trillion in market capitalisation in 2022. The surge in market values of digital currencies and their popularity in the world of e-commerce have remained unabated and equally received special attention from researchers focusing on identifying the underlying factors that drive changes in their market values. Thus, this study models the dynamics of the prices of cryptocurrencies alongside their interconnectedness, focusing on Bitcoin, Ethereum, and Litecoin along the time and frequency dimensions of monthly data from 1 March 2016 to 05/31/2022. Based on the ARDL model, results show that the volume of transactions of Bitcoin, Ethereum, and Litecoin, oil prices, and gold prices exert a more significant positive influence on their prices in the longrun than in the shortrun. However, the publicity of the selected cryptocurrencies (google search rates) does not significantly influence their prices. Interestingly, results from the Wavelet Granger causality tests show no causality between the raw series of Bitcoin, Ethereum, and Litecoin prices. However, a bi-directional causality exists between Bitcoin and Ethereum prices during the longrun in their low frequencies, a unidirectional causality running from Bitcoin to Litecoin prices during the longrun in their low frequencies, and a unidirectional causality running from Litecoin to Ethereum prices during the shortrun, medium run and longrun in their high, medium, and low frequencies. These findings have profound implications for the global financial market and investor decisions.
1. Introduction
Cryptocurrencies have, in recent times, gained unprecedented popularity in financial discourse. According to Kjaerland et al. (Citation2018), cryptocurrencies are decentralised digital currencies that use encryption to verify transactions. Following the registration of the domain name (bitcoin.org) in August 2008 and the follow-up publication of Bitcoin by Nakamoto (Citation2008), as well as the full activation of Bitcoin in January 2009, the cryptocurrency market has witnessed tremendous growth, with over 5,300 cryptocurrencies being traded, and over $2 trillion market capitalisation in 2022 (Quandl.com). Other prominent and up-and-coming cryptocurrencies include Litecoin (launched in 2011) and Ethereum (launched in July 2015), with a market capitalisation of over $5bn and $230bn, respectively. As of 2022, Bitcoin, Ethereum, and Litecoin are among the most known and commonly used cryptocurrencies. The unit prices of Bitcoin, Ethereum, and Litecoin currently stand at about $30,000, $1,800, and $65, respectively (Quandl.com).
The growing market values of cryptocurrencies may significantly impact several economies. Also, the unprecedented rise in the prices of Bitcoin, Ethereum, Litecoin, and other cryptocurrencies has attracted several empirical studies aimed at understanding the underlying factors that account for price changes. Several reasons justify the keen interest in predicting changes in the prices of crypto assets. First, it has been argued that digital currencies can develop the existing payment systems, as well as financial institutions, since they represent a new idea of money and the security of transactions (Mikhaylov, Citation2020), and unlike other financial assets, cryptocurrencies have no connection to a higher power and no physical representation, as their values are determined by the security of an algorithm that can track every transaction and are infinitely divisible (Corbet et al., Citation2019). Thus, verifying this claim by modelling cryptocurrency prices against the prices of certain traditional asset classes is important. Second, cryptocurrencies have become widely used as a medium of exchange and transfer payment in the world of e-commerce across countries, bypassing the intermediation role of formal financial institutions, which hitherto served as the primary trusted third-party facilitator of electronic payments. Therefore, predicting changes in crypto asset prices against certain critical factors will unarguably provide valuable insights for understanding the implications of the cryptocurrency market for international capital mobility. Third, there is a growing debate on whether cryptocurrencies should be treated as an independent asset class. Thus, modelling the prices of cryptocurrencies against certain critical factors will bolster the arguments for or against recognising cryptocurrencies as an independent asset class. Fourth, the cryptocurrency market has a persistently increasing number of investors who take advantage of trading cryptocurrencies. However, the dynamic nature of cryptocurrency prices increases the risk of trading and investment in crypto assets. Thus, by developing a model for predicting cryptocurrency prices against certain critical factors and their interdependencies along time and frequency dimensions, investors can make sound trading and investment decisions as they will be better guided when choosing the appropriate assets portfolio for risk hedging in both bearish and bullish markets.
A cursory look into the extant literature reveals some critical factors responsible for changes in the prices of cryptocurrencies. Aside from the volume of transactions of these cryptocurrencies, which has been extensively examined (Li & Wang, Citationn.d.; Kristoufek, Citation2013; Garcia et al., Citation2014; Kristoufek, Citation2015; Bouoiyour & Selmi, Citation2016; Ciaian et al., Citation2016; Kjaerland et al., Citation2018; Poyser, Citation2017; Katsiampa, Citation2017; Aalborg et al., Citation2018; Kjærland et al., 2018), other key drivers of the prices of cryptocurrencies include the prices of other related assets like gold, and crude oil, as well as their publicity through google search (Al-Yahyaee et al., Citation2019; Bhuiyan et al., Citation2021; Bouri et al., Citation2018; D. Baur et al., Citation2018; D. G. Baur & Hoang, Citation2021; Kumah & Odei-Mensah, Citation2022; Shariati, Citation2022). First, Palombizio and Morris (Citation2012) argue that the price of cryptocurrencies could increase (decrease) when the general price level changes due to cost and demand pressures in an economy, usually provoked by fluctuations in crude oil prices since investors in crude oil assets may consider crypto assets as a haven for risk hedging at bear (bull) markets (Ciaian et al., Citation2016). Also, in a study of seven cryptocurrencies and crude oil, Kumah and Odei-Mensah (Citation2022) showed a significant relationship between crude oil and cryptocurrency prices, as hedging possibilities were feasible for crude oil and cryptocurrency investors, especially in the medium to long term at both bear and bull markets. Second, before the creation of cryptocurrencies, gold was known to be a haven for investments since investors could hedge their portfolio with gold against currency risks, inflation, and during a crisis, given its lower risks and high returns attributes (Harris & Shen, Citation2017; Ji et al., Citation2020). It is quite likely for one to argue that since the creation of cryptocurrencies (particularly bitcoin), the popularity of gold for investors has been diminished due to Bitcoin’s higher returns despite having greater price volatility than gold in the short term (Ozturk, Citation2020). Laboure and Reid (Citation2020) argue that cryptocurrencies may share some properties with gold prices and that a strong relationship may likely exist between both assets. In a study, Shariati (Citation2022) revealed the unidirectional effect of price changes from gold to cryptocurrency (bitcoin), showing that gold and crypto assets enjoy similar sentiments from investors. Third, it is argued that the high and persistently growing number of online users suggests that popularity in the form of google search intensity tends to reflect the intentions and expectations of individuals (Ginsberg et al., Citation2009; Herzog & dos Santos, Citation2021). Sifat (Citation2021) argue that most asset investors in less developed financial markets tend to intensify their search for underlying assets in the peak of trading activities, high returns, or high volatility. In an exchange rate model, Herzog and dos Santos (Citation2021) proved that google search intensity is a critical factor for higher prediction performance for exchange rate models.
Several researchers have studied the dynamics of cryptocurrency prices with emphasis skewed in favour of Bitcoin by drawing attention to some macroeconomic, technical, and publicity-related variables to understand better how these factors affect the prices of cryptocurrencies (Li & Wang, nd; Aalborg et al., Citation2018; Bouoiyour & Selmi, Citation2016; Ciaian et al., Citation2016; Garcia et al., Citation2014; Katsiampa, Citation2017; Kaya, Citation2018; Kjaerland et al., Citation2018; Kristoufek, Citation2013, Citation2015; Nasir et al., Citation2019; Poyser, Citation2017). Even though they were motivated differently, other studies examining cryptocurrencies other than Bitcoin have also emerged, employing different methodological techniques (Fasanya et al., Citation2021; Corbet et al., Citation2019; Kyriazis et al., Citation2020; Sovbetov, Citation2018; Taker et al., Citation2020; Vidal-Tomás et al., Citation2019). While Bouoiyour and Selmi (Citation2016), Katsiampa (Citation2017), and Kjaerland et al. (Citation2018) utilised the Generalised Autoregressive Conditional Heteroskedasticity (GARCH) in examining the price dynamics of cryptocurrencies, others like Nasir et al. (Citation2019), and Taker et al. (Citation2020) adopted the Johansen cointegration, VAR, Granger, Dolado and Lütkepohl causality tests in their study of cryptocurrencies. Vidal-Tomás et al. (Citation2019) and Kyriazis et al. (Citation2020) followed a systematic review approach in their studies of cryptocurrencies. More so, Sovbetov (Citation2018) and Kjaerland et al. (Citation2018) stressed the need to capture both the longrun and shortrun effects of the potential drivers of cryptocurrency price dynamics and, thus, utilised the Autoregressive Distributed Lag (ARDL) model framework.
While this study is similar to Sovbetov (Citation2018) and Kjaerland et al. (Citation2018) in that it uses the ARDL model framework to capture both the longrun and shortrun effects of potential drivers (e.g., their volumes of transactions, their publicity through google search, gold and crude oil prices) of the selected crypto assets prices, it is not unaware of the potential spillover effect (interdependencies) in the prices of different cryptocurrencies, particularly Bitcoin, Ethereum, and Litecoin. For instance, Fasanya et al. (Citation2021) argue in favour of a potential return and volatility spillover among different cryptocurrencies. Thus, to model the crypto assets’ prices and adequately characterise the potential spillover across their prices, this study uses the highly celebrated Wavelet Granger causality approach to examine the interdependence of prices of the selected cryptocurrencies. The main aim of this study is to shed light on the influence of volume of transactions, publicity/google search, gold, and crude oil prices on the prices of Bitcoin, Ethereum and Litecoin as implications for risk hedging. The contribution of this study to knowledge is three-fold – (i) most studies that have modelled cryptocurrency prices beyond Bitcoin and Ethereum against factors like their volumes of transaction, their publicity through google search, gold and crude oil prices, did not cover the fast-growing Litecoin prices are determined, thus, this study extends the frontier of knowledge by developing a model of Litecoin price dynamics, as well as contributing to the ongoing debate in favour or against treating cryptocurrencies as an independent asset class; (ii) unlike several other studies that relied more on daily or weekly data frequencies, this study uses monthly data on crypto assets prices and considers a more larger data coverage, as Vidal-Tomás (Citation2022) have shown that, regardless of frequency, analysis of crypto assets (e.g., Bitcoin) can be more efficient over time; and (iii) unlike previous studies on spillover (e.g., Fasanya et al., Citation2021) that utilised the standard VAR model, the use of Wavelet Granger causality approach is considered more appropriate for determining the spillover effect among the selected cryptocurrency prices since it presents both time and frequency components of data in the distribution of variables when examining causality among the selected crypto assets.
2. Literature review
2.1. Conceptual clarifications
2.1.1. Cryptocurrency
According to Greenberg (Citation2011) and Polansek (Citation2016), a cryptocurrency (also known as digital currency or crypto) is a digital asset created to function as a medium of exchange in which individual coin ownership records are kept in a ledger that takes the form of a computerised database and employs strong cryptography to secure transaction records, regulate the creation of additional coins, and confirm the transfer of coin ownership. These currencies do not exist in physical forms (like paper money) and are typically not issued by a central authority. The control of cryptocurrencies is decentralised, unlike the usual centralised digital currency and central banking systems (Allison, Citation2015). A cryptocurrency minted or created before its issuance or issued by a single issuer is considered centralised. However, when cryptocurrencies are implemented with decentralised control, they work through distributed ledger technology, known as the blockchain, which serves as a public financial transaction database (Matteo, Citation2015).
2.1.2. Blockchain
Narayanan et al. (Citation2016) defined blockchain as a continuously growing list of records called blocks linked and secured using cryptography. Each block contains a hash pointer, a link to a previous block, a timestamp, and transaction data. It is the blockchain that guarantees the validity of each cryptocurrency’s coins. Blockchains are designed to resist any modification of the data inherently. It is “an open, distributed ledger that can efficiently and permanently record transactions between two parties” (Iansiti & Lakhani, Citation2017). A peer-to-peer network manages blockchain, collectively adhering to a protocol for validating new blocks, typically used as a distributed ledger. Raval (Citation2016) pointed out that blockchains are secure by design and are an example of a distributed computing system with high Byzantine fault tolerance, adding that decentralised consensus has been achieved with a blockchain.
2.1.3. Bitcoin
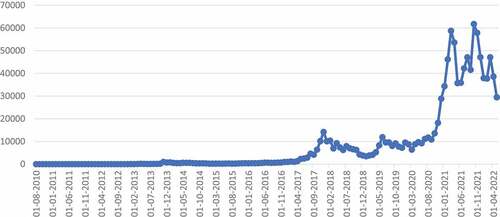
Bitcoin (BTC) is the first decentralised cryptocurrency released in 2009 as open-source software (Sagona-Stophel, Citation2016). Bitcoin was invented by an unknown person or group of people in 2008 using the name Satoshi Nakamoto. The currency came into use in 2009 when it was implemented as open-source software (Antonopoulos, Citation2014; Davis, Citation2011). According to Calvery (2013), Bitcoin is a decentralised digital currency that can be sent from user to user on the peer-to-peer bitcoin network without a central bank or single administrator, which does not require intermediaries. The transactions are verified by network nodes through cryptography and recorded in public distributed ledger called a blockchain. Bitcoins are created as a reward for a process known as mining, and they can be exchanged for other currencies, products, and services (CNN Money, Citation2015). Based on the estimates given by Hileman and Rauchs (Citation2017), about 2.9 to 5.8 million unique users of cryptocurrency wallets are using bitcoin. As of 31 August 2010, the price of Bitcoin was about $0.06, and since then, the price of Bitcoin has witnessed an unprecedented rise, reaching an all-time high of $68,000 in November 2021 and declining to $29,448 in May 2022. Figure shows the trend of monthly Bitcoin market prices (in USD) from August 2010 to May 2022.
Figure 1. Monthly Bitcoin market price (in USD), 31/08/2010–31/05/2022source: Quandl.Com.
2.1.4. Ethereum
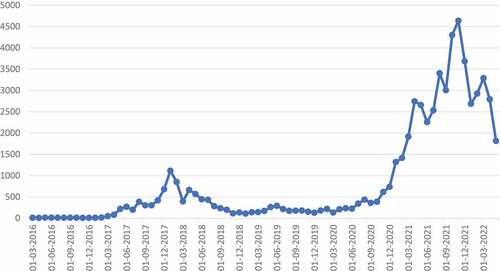
Ethereum (ETH) is among the cryptocurrencies collectively referred to as Altcoin (alternative cryptocurrencies), which means other types of digital assets other than Bitcoin (Browne, Citation2017; Katz, Citation2017; Yang, Citation2018). It is also a decentralised, open-source blockchain that features the functionality of the Smart Contract functionality, as well as the native cryptocurrency of the platform. Ethereum is considered the second-largest cryptocurrency after Bitcoin regarding market capitalisation and market prices in USD (Bloomberg.com). Ethereum was proposed in 2013 by a programmer called Vitalik Buterin, and its development was crowdfunded in 2014, while its network went live on 30 July 2015, with about 72 million coins pre-mined (Tapscott & Tapscott, Citation2016). Ever since its development, Ethereum has gained prominence in the world of digital assets reaching an all-time high of $4,636.7 in November 2021 while growing from $11.41 in March 2016 to $1,814 in May 2022 (Quandl.com). Figure shows the trend movement of monthly Ethereum market prices (USD) from March 2016 to May 2022.
Figure 2. Monthly Ethereum market price (in USD), 31/03/2016–31/05/2022.
2.1.5. Litecoin
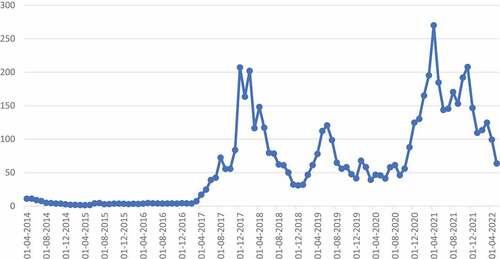
Litecoin (LTC) is another Altcoin, a decentralised peer-to-peer cryptocurrency, an open-source software project released under the MIT/X11 license, and an early bitcoin spinoff or Altcoin, dated October 2011 (WIRED, Citation2017). Technically, Litecoin is almost the same as Bitcoin. It was released by Charlie Lee (a Google employee who later became Engineering Director at Coinbase) via an open-source client on GitHub on 7 October 2011. It went live on October 13 of the same year (Odell, Citation2015). In November 2013, the aggregate market value of Litecoin witnessed rapid growth, which included a 100% leap within 24 hours (Charlton, Citation2013). As of May 2017, Litecoin has become the first among the top-5 cryptocurrencies in market capitalisation to adopt Segregated Witness. Between April 2014 and May 2022, Litecoin’s price rose from $11.10 to $63.68, with the highest growth ($412.96) witnessed in May 2021. Figure shows a picture of Litecoin’s price movement from April 2014 to February 2021.
Figure 3. Monthly Litecoin market price (in USD), 30/04/2014–31/05/2022.
2.2. Theoretical consideration
2.2.1. Stock market theories (Efficiency market hypothesis and greater fool theory)
We consider two popular theories in financial economics—the Efficiency Market Hypothesis and the Greater Fool Theory. According to the Efficient Market Hypothesis (EMH), asset prices reflect all the available information. This is a financial economics hypothesis that it is impossible to consistently “beat the market” based on risk adjustment, given that market prices only react to new information (Fama, Citation1976). Given that the EMH is expressed in risk adjustment, it only makes testable predictions when coupled with a particular risk model (Fama, Citation1970). Consequently, research in financial economics has, since at least the 1990s, focused on market anomalies, deviating from specific models of risk (Schwert, Citation2003). The EMH offers the logical basis for the modern risk-based theories of asset prices, alongside valuable frameworks such as consumption-based asset pricing and intermediary asset pricing, which can be thought of as the combination of a model of risk with the EMH (Fama, Citation2013).
On the other hand, the greater fool theory (GFT) states that the price of an asset is not determined by its intrinsic value but by the local and relative demand of a specific consumer. In other words, a consumer might pay an inflated price because of their needs and the local related-market value in an inflated market despite having broader market knowledge. However, other consumers may deem the price excessive relative to their needs and market value assessment. This implies that the commodity has a greater value, and to another consumer, the former consumer looks like a fool (Fox, Citation2001).
2.3. Empirical evidence
The recent surge in the growth of cryptocurrencies has called for the cherished attention of economic and financial researchers in understanding and unveiling the underlying factors driving the cryptocurrency market dynamics. For instance, Li and Wang (nd) conducted a theory-driven empirical study of the Bitcoin exchange rate (against USD) determination, considering both technical and economic factors. The study employed the autoregressive distributed lag (ARDL) model with a bounds test approach in the estimation to account for stationarity and cointegration among variables. According to the study, Bitcoin’s exchange rate varies in the near term in response to shifts in market conditions and economic factors. The long-term Bitcoin exchange rate is less susceptible to technological variables and more sensitive to the underlying economic conditions. The study further identified a significant impact of mining technology and a decreasing significance of mining difficulty in the Bitcoin exchange price determination.
Kristoufek (Citation2013 & Kristoufek, Citation2015) analysed the frequency of online searches on Bitcoin, found them to be good proxies for interest and popularity, and concluded that the relationship between the Bitcoin prices and online popularity is bidirectional. Also, Ciaian et al. (Citation2016) reported a positive relationship between Wikipedia searches and Bitcoin prices. Similarly, Bouoiyour and Selmi (Citation2016) found that popularity and investor attractiveness primarily drive price movements. Poyser (Citation2017) explored the association between the Bitcoin market price and internal and external factors using the Bayesian Structural Time Series Approach. The findings indicate that the price of Bitcoin is inversely correlated with the price of gold, the Yuan-to-USD exchange rate, and a neutral investor’s sentiment, while positively correlated with the stock market index, the USD/EUR exchange rate, and a variety of signs among search trends across various countries.
Kaya (Citation2018) analysed the cryptocurrency market and drivers of Bitcoin prices using a simple regression model based on the OLS technique. The study found that the only significant variable was public interest and popularity of Bitcoin. Also, Sovbetov (Citation2018) examined the factors influencing the prices of the most common five cryptocurrencies, such as Bitcoin, Ethereum, Dash, Litecoin, and Monero, from 2010–2018 using weekly data. The study employed the ARDL technique and found that crypto-market-related factors such as market beta, trading volume, and volatility are significant determinants of all the five cryptocurrencies in the short- and long-run. The study also found that the attractiveness of cryptocurrencies also matters in terms of their price determination, but only in the longrun and that the SP500 index has a weak positive longrun impact on Bitcoin, Ethereum, and Litecoin. At the same time, its sign turns negative, losing significance in the shortrun, except for Bitcoin. Also, Kjaerland et al. (Citation2018) examined the potential Bitcoin price drivers using the Autoregressive Distributed Lag and Generalised Autoregressive Conditional Heteroscedasticity (GARCH) approach. In line with conclusions from earlier literature, empirical studies show that returns on the S&P 500 and Google searches impact the price of Bitcoin. However, the study deemed the Chicago Board Options Exchange’s (CBOE) volatility index (VIX), oil, gold, and Bitcoin transaction volume were all inconsequential.
Nasir et al. (Citation2019) analysed the predictability of Bitcoin volume and returns using Google search values. The study employed a rich set of established empirical approaches to capture a dependency structure, including a VAR framework, a copulas approach, and non-parametric drawings. Based on a weekly dataset from 2013 to 2017, the results suggest that the frequency of Google searches leads to positive returns and a surge in Bitcoin trading volume. Also, shocks to search values have a positive effect and persist for at least a week.
In a study of all the altcoins available for three different periods (2015–2017, 2016–2017 and 2017), Vidal-Tomás et al. (Citation2019) employed the cap-weighted market portfolios to analyse the weak efficiency of the cryptocurrency market within the framework of traditional tests of efficiency. They concluded that the cryptocurrency market is weak-form inefficient due to the behaviour of all the altcoins and is more inefficient over time, especially in 2017.
Corbet et al. (Citation2019) systematically reviewed empirical literature to validate the accusations of cryptocurrency pricing bubbles central to certain intangible factors. The study showed that regulatory oversight, the potential for illicit use, and infrastructural breaches influence the perception of the role of cryptocurrencies as a credible investment asset class and legitimate value.
In another systematic review, Kyriazis et al. (Citation2020) surveyed the academic literature concerning the formation of pricing bubbles in digital currency markets. Their study showed that Bitcoin has been in a bubble-phase since June 2015, while Ethereum, NEM, Stellar, Ripple, Litecoin and Dash have witnessed bubble-like characteristics since September 2015.
Taker et al. (Citation2020) examined how changes in gold and oil prices affect the daily price movements of various cryptocurrencies, such as Bitcoin, Tether, Ethereum, Litecoin, and EOS, between 1 August 2017, and 3 April 2019. They tested for stationarity of the time series using the Ng and Perron (Citation2001) method, the existence of the cointegration relationship among the series was tested using Johansen (Citation1988) technique, and the presence of causality relationships among the series was investigated using the Dolado and Lütkepohl (Citation1996) causality test. The empirical results support a cointegration relationship only between Tether and gold and oil prices.
In a study of cryptocurrency market pricing and application of cryptocurrencies by the Bank of Russia for its monetary policy, Yu (Citation2020) examined the cyclical nature of price dynamics to study market maturity and potential risks that have a long-term positive relationship with the financial stability of the cryptocurrency market. The study was based on the Hurst method with the Amihud illiquidity measure to study the resistance of four cryptocurrencies (Bitcoin, Litecoin, Ripple and Dash) and their evolution over the last five years. The results show that the cryptocurrency market has entered a new stage of development, affirming the reduced possibility to have excess profits when investing in the most liquid cryptocurrencies in the future, whereas, buying new high-risk tools provides opportunities for speculative income. The study concluded that illiquid cryptocurrencies exhibit strong inverse anti-persistence in the form of a low Hurst exponent.
3. Methodology
3.1. Theoretical framework and the model
This study finds the EMH and the GFT relevant for modelling the dynamics of cryptocurrency prices following the work of Santoni (Citation1987), which has been applied by Kjaerland et al. (Citation2018). According to Fama (Citation1976), the EMH believes that stock prices can only vary when investors receive new information about the market fundamentals since all relevant information dwells in the current stock prices, meaning that past variations in price have no helpful information about future price variations. On the other hand, GFT believes that investors do not find essential valuable information in their investment decision. For instance, an investor buys stocks hoping that he will sell to a bigger fool at a higher price in the future, making this scheme a thing of speculation and anticipation of persistent price rise on account of past rises. In line with the preceding and based on the literature (see Sobvetov, Taker et al., Citation2020; Nasir et al., Citation2019; Kjaerland et al., 201; Taker et al., Citation2020), the relationship between the selected cryptocurrency prices and their potentially determining factors can be functionally specified as follows:
where BTCP, ETHP, and LTCP stand for Bitcoin prices, Ethereum prices, and Litecoin prices, respectively; VOLB, VOLE, and VOLL stand for volume traded of Bitcoin, Ethereum, and Litecoin, respectively; GOLD denotes commodity gold index; OILP stands for crude oil prices; GGSB, GGSE, and GGSL stand for the number of google searches for Bitcoin, Ethereum, and Litecoin respectively. Note that the subscript t stands for daily time-series data. Specifying EquationEquations 17
7 , Equation2
8
8 , and Equation3
9
9 in their complete econometric forms and applying the natural logarithm transformation of variables, we have the following equations:
where α0, 0, and λ0 are the intercept terms; αi,
i, and λi (i = 1, 2, 3, 4) are the slope coefficients; µ, ν, and ω are the uncorrelated error terms; ln = natural logarithm notation.
3.2. The data
The description and data sources relating to the chosen variables are summarised in Table .
Table 1. Data descriptions and sources
3.3. Estimation technique
3.3.1. Autoregressive Distributed Lag (ARDL) model
To unveil how identified factors drive the selected cryptocurrency prices and determine the speed at which they converge to a longrun equilibrium after a shortrun shock in their determining factors, we employed the ARDL model framework. The choice of the ARDL model over alternative methods is based on the premise that; (i) it has better small sample properties, (ii) it provides an avenue for establishing both the longrun and shortrun relationships among variables regardless of whether the underlying variables are purely I(0) or I(1), or fractionally integrated, meaning that the preliminary test of unit root on variables is not compulsory, (iii) estimates obtained from the ARDL model are considered to be unbiased and efficient since it avoids the problems that may arise in the presence of serial correlation and endogeneity bias in a single-equation setup (Madichie et al., Citation2020; Pesaran et al., Citation2001). Thus, the ARDL version of Equations 4, 5, and 6 is expressed as follows:
The first step to estimating the ARDL model is to test for cointegration among variables using the Bound Test procedure proposed by Pesaran et al. (Citation2001). The Bound cointegration test is based on estimating an unrestricted ECM version of the ARDL specification by conducting an F-test for the joint significance of the coefficients of the lagged level of all the variables. The F-test for the Bound test follows a distribution that is non-standard depending on: (i) whether chosen variables are I(0) or I(1); (ii) the number of explanatory variables; and (iii) whether the ARDL model structure has drift and/or a deterministic trend. Pesaran et al. (Citation2001) developed two sets of critical values, with one being calculated under the assumption that all variables are I(0) and the other assuming that the variables are all I(1). The null hypothesis of no cointegration is rejected if the F-test is greater than the upper bound critical value. However, it cannot be rejected if the F-test is less than the lower bound critical value at the 5% level. However, the decision to reject or not to reject the null hypothesis of no cointegration becomes inconclusive if the F-test falls within the lower and upper bound critical values (Pesaran et al., Citation2001). Upon rejecting the null hypothesis of no cointegration, an error correction model was specified for each cryptocurrency price model to establish the nature of their shortrun dynamics and to reconcile the longrun behaviour of variables with their shortrun responses. The ECM version of Equations 7, 8, and 9 are specified as follows:
Finally, the forecasting ability of the estimated models will be established using the cumulative sum of squares (CUSUM) test of model stability.
4. Results and discussion
4.1. Results of descriptive statistics
We begin this section by reporting the results of descriptive statistics, as shown in Table . This is to examine the spread of data points with relevant test statistics such as the Mean, Standard Deviation, Maximum and Minimum, Jaque-Bera (JB), Skewness, and Kurtosis. According to Table , the mean values of Bitcoin (BTCP), Ethereum (ETHP), and Litecoin (LTCP) prices over the period are $10,048.40, $469.07, and $70.57, with standard deviations of $12,873.45, $634.68, and $67.22 respectively, indicating a wider spread between their various data points and their mean values. The highest values of BTCP, ETHP, and LTCP during the period are $61,258.73, $3,879, and $384.28, and their minimum values are $373.74, $7.23, and $3, respectively, which also indicates a broader spread in BTCP, ETHP, and LTCP. The skewness statistics show that BTCP, ETHP, and LTCP are positively or rightly skewed. In contrast, their kurtosis statistics indicate that BTCP, ETHP, and LTCP are leptokurtic, meaning they tend to peak beyond normal distribution. Also, the JB statistics for BTCP, ETHP, and LTCP show that they do not follow a normal distribution.
Table 2. Results of descriptive statistics
The mean values of the volume of transactions of Bitcoin (VOLB), Ethereum (VOLE), and Litecoin (VOLL) over the periods are 128,229.7, 135,830.5, and 124,963.1 units, with standard deviations of 79,005.63, 136,606.9 and 172,078.3 units respectively, suggesting that a huge disparity exists between their mean values and their various data points. The maximum VOLB, VOLE, and VOLL values are 448,636.8, 1.176,545, and 1,588,527 units, respectively; their minimum values are 33,184.41, 3178.437 and 237.7254 units, respectively, also indicating that a huge disparity exists in all. The skewness statistics for VOLB, VOLE, and VOLL show that they are all positively or rightly skewed. In contrast, their kurtosis statistics suggest that they are all leptokurtic and tend to peak beyond normal distribution. The JB statistics for VOLB, VOLE, and VOLL indicate that none follow a normal distribution.
The mean values of google search rates using the terms Bitcoin (GGSB), Ethereum (GGSE), and Litecoin (GGSL) are 38.54%, 31.40%, and 33.24% during the periods, with standard deviations of 22.20%, 21.50%, and 24.17% respectively, indicating a pretty wide variation between their mean values and their respective data points. The maximum value of google search rate is 100% for GGSB, GGSE, and GGSL, while their minimum values are 4%, 0%, and 0%, respectively. Regarding the skewness statistics, it is evident that GGSB, GGSE, and GGSL are positively or rightly skewed. Also, the kurtosis statistics for GGSB, GGSE, and GGSL show that GGSE and GGSL have heavier tails (leptokurtic) than a normal distribution. In comparison, GGSB has lighter tails than a normal distribution. Their JB statistics also indicate that they do not follow a normal distribution.
More so, the mean values of oil (OILP) and gold prices (GOLD) over the periods are $52.19 per barrel and $1,428.47 per troy ounce, with standard deviations of $11.76 per barrel and $241.53 per troy ounce, respectively, suggesting that the OILP and GOLD have wide variations across data points. Also, the maximum and minimum values of OILP and GOLD are $75.13 per barrel and $2,031.15 per troy ounce, respectively. The skewness statistics show that OILP is negatively skewed while GOLD is positively skewed. Their kurtosis statistics suggest that OILP has heavier tails than a normal distribution (leptokurtic), and GOLD has lighter tails than a normal distribution. It should be noted that going forward into the mainstream model estimations, the natural logarithm transformation is applied to all variables to reduce the tendency for potential heteroskedasticity problems and to enable the interpretation of coefficients as elasticities.
4.2. Results of unit root test
Albeit it has been argued that the unit root test is not a customary practice when the ARDL bound test is to be used for cointegration analysis on the axiom that variables are either I(0), I(1) or a combination of both, the relevant of unit root test in this section is meant to ensure that none of the chosen variables is I(2) as the ARDL bound test becomes meaningless in the face of I(2) variables (Madichie et al., Citation2020). The unit root test was conducted using Augmented Dickey-Fuller (ADF), which was complemented by Zivot-Andrew (ZA) techniques to ensure that structural break in time-series does not pose a problem in identifying the exact orders of integration of variables since the ZA method accounts for structural breaks in time-series. It should be noted that structural breaks in time-series data are usually mistaken to be unit roots by the conventional unit root test procedures like the ADF leading to the non-rejection of the unit root hypothesis (Zivot & Andrew, Citation1992). According to the Augmented Dickey-Fuller (ADF) unit root test results reported in Table , the order of integration of variables is mixed between I(0) and I(1), and there is no I(2). The I(1) variables include BTCP, ETHP, LTCP, VOLB, and GOLD, while others like VOLE, VOLL, GSSB, GSSE, GSSL, and OILP are I(0) variables. The unit root test results reported by the ADF method are supported by the ZA unit root results (see Table ) as variables maintained their orders of integration in the face of structural breaks in time-series. This implies that structural break in any form does not constitute a severe impediment to the unit root test results reported in this study. This outcome justifies using the ARDL bound test for cointegration analysis which assumes that time series variables under investigation are either I(0), I(1) or a combination of both.
Table 3. Results of ADF Unit Root Test
4.3. Results of the cointegration test
Having identified the orders of integration of variables as a combination of I(0) and I(1), the results of the ARDL bound cointegration test are reported in Table . As shown in Table , the F-statistics for the joint significance of the lagged level variables for the three cryptocurrency price models—BTCP, ETHP, and LTCP are 5.56, 5.96, and 5.18, respectively, which are greater than their respective upper bound critical values at both 1% and 5% levels of significance. Thus, we reject the null hypothesis of no cointegration between the dependent and independent variables for the three models. In other words, there is a longrun relationship between the prices of the selected cryptocurrencies and their volume of transactions, google search rates, oil prices, and gold prices over the periods under review. This implies that consistent estimates of both longrun and shortrun parameters are evident.
Table 4. Results of ARDL bound cointegration test
4.4. Results of longrun model estimation
As part of the ARDL bound cointegration test, it is customary to report the results of the normalised longrun coefficients from where the longrun influence of the explanatory variables is evaluated. In Table , we report the longrun estimates of the various cryptocurrency price models. The results show that volumes of transactions of Bitcoin (VOLB), Ethereum (VOLE), and Litecoin (VOLL) have a significant positive influence on their respective prices in the longrun. In terms of the magnitude of impact, the results show that a percentage increase (decrease) in the volumes of transactions of Bitcoin (VOLB), Ethereum (VOLE), and Litecoin (VOLL) will eventually bring about 0.53%, 0.57%, and 0.46% increase (decrease) in the prices of Bitcoin, Ethereum and Litecoin respectively over the longrun. This shows that the volumes traded of the selected cryptocurrencies hold a significant implication for the movement in their prices over the longrun. This finding supports the finding reported by Sovbetov (Citation2018), who concluded that trading volume significantly drives Bitcoin, Ethereum, and Litecoin prices. This finding implies that the volume of transactions of Bitcoin, Ethereum, and Litecoin should be a good signalling factor to cryptocurrency investors.
Table 5. Results of the estimated longrun coefficients
The results also show that, in the longrun, crude oil prices significantly positively influence the prices of the selected cryptocurrencies. A percentage increase (decrease) in crude oil prices should be expected to translate to about 1.52%, 1.20%, and 1.54% increase (decrease) in Bitcoin, Ethereum, and Litecoin prices, respectively, in the longrun. While this finding is consistent with the finding by Teker et al. (Chai et al., Citation2019), who reported that crude oil prices significantly drive the prices of selected cryptocurrencies, it also stands in contrast with the conclusion given by Kjaerland et al. (Citation2018), who posits that oil prices do not significantly influence the prices of selected cryptocurrencies. Thus, we posit that a concurrent price movement exists between crude oil and the selected cryptocurrencies over the longrun. This implies that the moments of rising crude oil prices should, in the longrun, serve as a signalling factor to the cryptocurrency market actors regarding the upward tendency in price movement in crypto assets. This, however, suggests the absence of hedging characteristics in Bitcoin, Ethereum, and Litecoin prices for the crude oil price movement at bear (bull) markets. In addition, given the strong correlation of crypto assets with the traditional asset class (i.e., crude oil prices), the argument that crypto assets deserve to be treated as an independent asset class is not validated. While this finding supports Hairudin et al. (Citation2020), it negates Kruckeberg and Scholz (Citation2020) and Sifat (Citation2021).
Going further, the results show that the price of gold significantly drives the prices of the selected cryptocurrencies in the longrun such that a percentage increase (decrease) in the price of gold will significantly result in about 5.30%, 6.60%, and 4.22% increase (decrease) in the prices of Bitcoin, Ethereum, and Litecoin respectively over the longrun. This finding negates that of Poyser (Citation2017), who found that gold prices negatively influence the prices of the selected cryptocurrencies. Our result implies a concurrent price movement in gold and crypto markets and that gold and crypto assets investors tend to complement and diversify their investments in both assets, meaning that crypto assets investors do not hedge their assets on gold in both bear and bull markets. Again, the argument that crypto assets deserve to be treated as an independent asset class is faulted, given the strong correlation of crypto assets with the traditional asset class (i.e., gold prices).
Interestingly, the results could not establish any significant relationship between the prices of the selected cryptocurrencies and their publicity (google search rate). Even though a positive association exists between the selected cryptocurrencies and their publicity in the longrun, the influence of publicity on the price of the corresponding cryptocurrency is not significant at the 5% level. Also, the magnitudes of the response of prices of Bitcoin, Ethereum, and Litecoin are 0.003%, 0.02%, and 0.08%, respectively, per percentage increase (decrease) in their publicity (google search rates). This finding is consistent with some literature on the consistently inferior predictive power of google-based search on driving crypto asset prices (Chai, Citation2019; Sifat et al., 2020; Herzog & dos Santos, Citation2021).
4.5. Results of shortrun model estimations
In this section, we report the results of the shortrun dynamic models, which are also regarded as the error correction models (ECMs) of Bitcoin, Ethereum, and Litecoin prices based on their estimated ADRL models. As reported in Table , the ECMs appeared in their parsimonious forms and were generated from their respective overparameterised forms through the general-to-specific approach using the automatic lag selection provided by the Akaike Information Criterion (AIC). Looking at the first-period lags of Bitcoin, Ethereum, and Litecoin prices, it is clearly shown that their past price rises determine their future price rises in line with the GFT, though this is not significant for the Bitcoin price model. Thus, the GFT holds significantly true only for Ethereum and Litecoin prices. In other words, the future price rise in Ethereum and Litecoin depends, to a larger extent, on their past price rise (see GFT).
Table 6. Results of parsimonious ECM versions of the estimated ARDL models
The results show that, in the shortrun, the volume traded of the selected cryptocurrencies maintained their respective positive influence on the prices of only Bitcoin and Litecoin. However, the influence on Bitcoin prices is not significant. As for the Ethereum prices, the shortrun impact of volume traded is negative but not significant. In summary, we posit that the volume of transactions does not seriously affect Bitcoin and Ethereum prices but Litecoin prices. Also, crude oil prices do not significantly influence Bitcoin, Ethereum, and Litecoin prices in the shortrun (see Table ). However, gold prices have a significant shortrun influence on Bitcoin, Ethereum, and Litecoin prices. However, the significant influence of gold prices on Ethereum is only visible during the second period lag. Just as in the longrun case, the google search rates for Bitcoin and Ethereum do not exert any significant influence on Bitcoin and Ethereum prices in the shortrun. Interestingly, the google search rates for Litecoin prices have a significant shortrun influence on Litecoin prices.
More importantly, the speed of adjustment from shortrun deviation to longrun equilibrium for the prices of selected cryptocurrencies is denoted with CointEq(−1)* and is also shown in Table . The values of the error correction term (CointEq(−1)*) for Bitcoin, Ethereum, and Litecoin prices are significantly 0.00027, 0.021, and 0.044, respectively. Even though the speed of adjustment to longrun equilibrium is relatively low across the selected crypto prices, Bitcoin prices have the lowest speed of adjustment (0.027%), followed by Ethereum prices (2.1%) and then Litecoin prices (4.4%). Based on these coefficients, it is evident that the shortrun deviation in the equilibrium price of Bitcoin is expected to adjust by 0.027% monthly, while Ethereum and Litecoin prices are expected to have a monthly adjustment of 2.1% and 4.4%, respectively. The implication is that shortrun equilibrium distortions in Bitcoin, Ethereum, and Litecoin prices are temporary as equilibrium holds in the longrun for them, though with relatively low speed.
4.6. Results of the Wavelet Granger causality test
Part of the objectives of this study is to establish the nature of the causal relationship between the prices of Bitcoin, Ethereum, and Litecoin. As part of the Wavelet Granger causality analyses, it is instructive to begin by providing an insightful overview of the relevant variables’ time and distributional frequency patterns. This involves analysing the energy decomposition of the relevant variables (BTCP, ETHP, and LTCP) to ascertain the relevance of short-term, medium-term, and long-term dynamics. This starts with a multi-resolution analysis (MRA) of order J = 6 using the maximal overlap discrete wavelet transform (MODWT), which is based on Daubechies’ (1992) least asymmetric (LA) wavelet filter that plots the orthogonal dimensions (D1, D2, … , D6) to provide further details of the various time and frequency dimensions of the raw data alongside the smoothed dimension (S6).
Following the above, the distributional patterns of BTCP, ETHP, and LTCP are grouped into four periodic phases beginning with shortrun period (D1 + D2), then a medium-run period (D3 + D4), longrun period (D5 + D6), and very longrun period (S6). The results of the energy decomposition of variables are reported in Table . According to the results, high frequencies are observed in the distribution of BTCP during the shortrun period (D1 + D2) with a total scale of 74.37% (i.e., 67.69 + 6.68 = 74.37). However, the variation in BTCP stabilises after the medium run in the rest of the periods. The results show a similar distributional pattern in both ETHP and LTCP as both variables witness high frequencies in the medium run (D3 + D4) with a total scale of 61.73% (ETHP) and 62.95% (LTCP). However, stability is maintained in the remaining parts of the periods.
Table 7. Energy decomposition of BTCP, ETHP, and LTCP
Having examined the Wavelet energy decomposition of variables, we report and discuss the Wavelet Granger causality test results as shown in Table . In the first segment of Table , results show no causality between the raw BTCP series and that of ETHP. However, a bi-directional causality exists between BTCP and ETHP in the longrun period (D5 + D6) and very longrun period (S6). These periods coincide with the periods of low frequencies in both BTCP and ETHP, meaning that BTCP and ETHP mutually explain changes in each other during their low-frequency periods. This finding implies that BTCP and ETHP are mutually dependent, meaning that changes in BTCP or ETHP are expected to unleash significant influence on either of them in the longrun.
Table 8. Wavelets granger causality between BTCP, ETHP, and LTCP
In the second segment of Table , we found similar causality outcomes between BTCP and LTCP. First, there is no evidence of causality between the raw series of BTCP and that of LTCP. However, a unidirectional causality was found running from BTCP to LTCP in the longrun period (D5 + D6). These periods coincide with the low frequencies in both BTCP and LTCP, meaning that unidirectional causality runs from BTCP to LTCP during their low-frequency periods in the longrun. Interestingly, a unidirectional causality from LTCP to BTCP exists in the second half of the medium-run period (D4). This particular period coincides with the highest frequency in LTCP and medium frequency in BTCP. The outcome of this analysis implies that changes in BTCP or LTCP are only sufficient for both BTCP and LTCP in the longrun, while in the medium run, changes in only LTCP are sufficient for BTCP.
In the third segment of Table , no causality exists between the raw series of LTCP and ETHP. However, evidence of unidirectional causality running from LTCP to ETHP was found in the second half of the shortrun period (D1), during the medium-run period (D3 + D4), and longrun period (D5 + D6). These periods coincide with high, medium, and low frequencies in both LTCP and ETHP, meaning that LTCP causes changes in high, medium, and low frequencies of ETHP during the shortrun, medium run, and longrun periods.
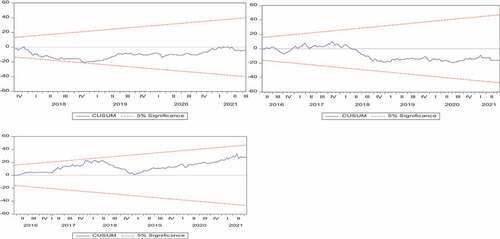
4.7. Model stability tests and other robustness checks
The estimated ARDL models were tested for stability using the Cumulative Sum (CUSUM) method, and the results are reported in Figure . We found that the estimated ARDL models of Bitcoin, Ethereum and Litecoin prices are stable since their fitted lines fall within the dotted 95% confidence bounds, meaning that the estimated coefficients of the ARDL models are consistent. The result also suggests the absence of structural breaks in the estimated ARDL models. Other relevant robustness checks include—serial correlation of the residuals using the Breusch-Godfrey serial correlation LM method, the Jaque-Bera normality test, the Breusch-Pagan-Godfrey heteroskedasticity test, and most importantly, the Ramsey RESET test of model misspecification errors. These different diagnostic checks show that the estimated ARDL models were robust and rightly specified in their true functional forms, given that the probability of the estimated statistics could not reject the null hypotheses.
Figure 4. CUSUM stability test results.
5. Conclusion
This study models the dynamics of the prices of cryptocurrencies alongside spillover effects in their prices, focusing on Bitcoin, Ethereum, and Litecoin using monthly data from 1 March 2016 to 05/31/2022. In determining the driving factors of the prices of selected cryptocurrencies and their interconnectedness along time and frequency dimensions, this study employed the ARDL model framework to establish the longrun and shortrun relationship between the prices of selected cryptocurrencies and their various determinants and the Wavelet Granger causality framework to unveil the potential spillover among the prices of the selected cryptocurrencies.
Results from estimated ARDL models show that the volume of transactions of Bitcoin, Ethereum, and Litecoin, oil prices, and gold prices exert a more significant positive influence on their prices in the longrun than in the shortrun. The positive impact of gold and crude oil prices indicates the absence of hedging possibilities of crypto assets for gold and crude oil price movement. In addition, our study revealed that crypto assets strongly correlate with the traditional asset class (gold and crude oil prices), which invalidates the argument that crypto assets deserve to be treated as an independent asset class. However, the publicity of the selected cryptocurrencies (google search rates) does not significantly influence their prices. Interestingly, results from the Wavelet Granger causality tests show no causality between the raw series of Bitcoin, Ethereum, and Litecoin prices. However, a bi-directional causality exists between Bitcoin and Ethereum prices during the longrun in their low frequencies, a unidirectional causality running from Bitcoin to Litecoin prices during the longrun in their low frequencies, and a unidirectional causality running from Litecoin to Ethereum prices during the shortrun, medium run and longrun in their high, medium, and low frequencies. Our findings have profound implications for the global financial market as the evidence contributes to the debate on whether crypto assets should be classified as an independent asset class and offer useful guidance for informed investor decisions in assessing the feasibility of gold and crude oil assets as a haven for hedging crypto assets’ risk at bear (bull) markets.
Abbreviations
| AIC | = | Akaike Information Criterion |
| ARDL | = | Autoregressive Distributed Lag |
| CBOE | = | Chicago Board Options Exchange |
| EMH | = | Efficiency Market Hypothesis |
| GARCH | = | Generalised Autoregressive Conditional Heteroskedasticity |
| GFT | = | Greater Fool Theory |
| LA | = | Least Asymmetric |
| MODWT | = | Maximum Overlap Discrete Wavelet Transform |
| MRA | = | Multiresolution Analysis |
| VAR | = | Vector Autoregression |
| VIX | = | Volatility Index |
Availability of data and materials
The authors have provided the link to the data sources in the manuscript and the dataset analysed is also available on request.
Acknowledgments
The authors are grateful to all the anonymous reviewers and the editor for their valuable and helpful comments. The authors take responsibility for any further errors.
Disclosure statement
No potential conflict of interest was reported by the authors.
Additional information
Funding
Notes on contributors

Chekwube V. Madichie
Chekwube V. Madichie Lagos Business School, Pan-Atlantic University, Lagos, Nigeria.
References
- Aalborg, H. A., Molnár, P., & de Vries, J. E. (2018). What can explain the price, volatility, and trading volume of Bitcoin? Finance Research Letters, Forthcoming. [CrossRef]. https://doi.org/10.2139/ssrn.3233977
- Allison, I. (2015). If Banks want benefits of Blockchains, They must go permissionless. International Business Times. https://www.ibtimes.co.uk/nick-szabo-if-banks-want-benefits-blockchains-they-must-go-permissionless-1518874
- Al-Yahyaee, K. H., Mensi, W., Al-Jarrah, W. I. M., Hamdi, W., & Kang, S. (2019). Volatility forecasting, downside risk and diversification benefits of bitcoin and oil and international commodity markets: A comparative analysis with yellow metal. The North American Journal of Economics and Finance, 49(1), 104–23. https://doi.org/10.1016/j.najef.2019.04.001
- Antonopoulos, A. M. (2014). Mastering Bitcoin: Unlocking digital cryptocurrencies. O’Reilly Media, Inc.
- Baur, D., Dimpfl, G., & Kuck, K. (2018). Bitcoin, gold, and the us dollar–a replication and extension. Finance Research Letters, 25, 103–110. https://doi.org/10.1016/j.frl.2017.10.012
- Baur, D. G., & Hoang, L. (2021). The Bitcoin gold correlation puzzle. Journal of Behavioral and Experimental Finance, 32, 100561. https://doi.org/10.1016/j.jbef.2021.100561
- Bhuiyan, R. A., Husain, A., & Zhang, C. (2021). A wavelet approach for causal relationship between bitcoin and conventional asset classes. Resources Policy, 71, 101971. https://doi.org/10.1016/j.resourpol.2020.101971
- Bouoiyour, J., & Selmi, R. (2016). Bitcoin: A beginning of a new phase? Economics Bulletin, 36(3), 1430–1440. https://ideas.repec.org/a/ebl/ecbull/eb-16-00372.html
- Bouri, E., Mahamitra, D., Gupta, R., & Roubaud, D. (2018). Spillovers between bitcoin and other assets during bear and bull markets. Applied Economics, 50(55), 5935–5949. https://doi.org/10.1080/00036846.2018.1488075
- Browne, R. (2017). Bitcoin is not a bubble, but other cryptocurrencies are cannibalising themselves. CNBC.
- Chai, D., Dai, M., Gharghori, P., & Hong, B. (2019). Internet search intensity and its relation with trading activity and stock returns. International Review of Finance, 21(1), 282–311. https://doi.org/10.1111/irfi.12268
- Fasanya, I. O., Oyewole, O., & Odudu, T. (2021). Returns and volatility spillovers among cryptocurrency portfolios. International Journal of Managerial Finance. 17(2), 327–341. https://doi.org/10.1108/IJMF-02-2019-0074
- Charlton, A. (2013). Litecoin value leaps 100% in a day as market cap passes $1bn. International Business Times. https://www.ibtimes.co.uk/litcoin-value-leaps-100-percent-market-cap-525867
- Ciaian, P., Rajcaniova, M., & Kancs, D. (2016). The economics of bitcoin price formation. Applied Economics, 48(19), 1799–1815. https://doi.org/10.1080/00036846.2015.1109038
- CNN Money. (2015). What is bitcoin?
- Corbet, S., Lucey, B., Urquhart, A., & Yarovaya, L. (2019). Cryptocurrencies as a financial asset: A systematic analysis. International Review of Financial Analysis, 62, 182–199. https://doi.org/10.1016/j.irfa.2018.09.003
- Davis, J. (2011). The crypto-currency: Bitcoin and its mysterious inventor. The New Yorker.
- Dolado J J and Lütkepohl H. (1996). Making wald tests work for cointegrated VAR systems. Econometric Reviews, 15(4), 369–386. 10.1080/07474939608800362
- Fama, E. (1970). Efficient capital markets: A review of theory and empirical work. The Journal of Finance, 25(2), 383–417. JSTOR 2325486. https://doi.org/10.2307/2325486
- Fama, E. Efficient capital markets: Reply. (1976). The Journal of Finance, 31(1), 143–145. CrossRef. https://doi.org/10.1111/j.1540-6261.1976.tb03205.x
- Fama, E. (2013). Two pillars of asset pricing. Prize Lecture for the Nobel Foundation.
- Fox, J. (2001). When bubbles burst tulips. Money.cnn.com.
- Garcia, D., Tessone, C. J., Mavrodiev, P., & Perony, N. The digital traces of bubbles: Feedback cycles between socio-economics signals in the Bitcoin economy. (2014). Journal of the Royal Society Interface, 11(99), 1–28. CrossRef] [PubMed. https://doi.org/10.1098/rsif.2014.0623
- Ginsberg, J., Matthew, H. M., Patel, R. S., Brammer, L., Smolinski, M. S., & Brilliant, L. (2009). Detecting influenza epidemics using search engine query data. Nature, 457(7232), 1012–1014. https://doi.org/10.1038/nature07634
- Greenberg, R. (2011). Bitcoin: An innovative alternative digital currency.
- Hairudin, A., Sifat, M. I., Mohamad, A., & Yusof, Y. (2020). Cryptocurrencies: A survey on acceptance, governance, and market dynamics. International Journal of Finance & Economics, 27(4), 4633–4659. https://doi.org/10.1002/ijfe.2392
- Harris, R. D. F., & Shen, J. (2017). The intrinsic value of gold: An exchange rate-free price index. Journal of International Money and Finance, 79, 203–217. https://doi.org/10.1016/j.jimonfin.2017.09.007
- Herzog, B., & dos Santos, L. (2021). Google search in exchange rate models: Hype or hope? Journal of Risk and Financial Management, 14(11), 512. https://doi.org/10.3390/jrfm14110512
- Hileman, G., & Rauchs, M. (2017). Global Cryptocurrency benchmarking study. Cambridge University.
- Iansiti, M., & Lakhani, K. R. (2017). The truth about blockchain. Harvard Business Review. https://hbr.org/2017/01/the-truth-about-blockchain
- Ji, Q., Zhang, D., & Zhao, Y. (2020). Searching for safe-haven assets during the COVID-19 pandemic. SSRN Electronic Journal. https://doi.org/10.2139/ssrn.3602780
- Johansen, S. (1988). Statistical analysis of cointegrating vectors. Journal of Economic Dynamics & Control, 12(2–3), 231–254. https://doi.org/10.1016/0165-1889(88)90041-3
- Katsiampa, P. (2017). Volatility estimation for Bitcoin: A comparison of GARCH models. Economics Letters, 158, 3–6. https://doi.org/10.1016/j.econlet.2017.06.023
- Katz, L. (2017). Cryptocurrency mania goes beyond bitcoin. Bloomberg. https://www.bloomberg.com/news/articles/2017-05-24/cryptocurrency-mania-goes-beyond-bitcoin-as-altcoins-lead-gains
- Kaya, Y. (2018). Analysis of cryptocurrency market and drivers of the bitcoin price. Master of Science Thesis TRITA-ITM, KTH.
- Kjaerland, F., Khazal, A., Krogstod, E. A., Nordstrom, F. B., & Oust, A. (2018). An analysis of bitcoin’s price dynamics. Journal of Risk and Financial Management, 11(63), 1–18. https://doi.org/10.3390/jrfm11040063
- Kristoufek, L. Bitcoin meets google trends and Wikipedia: Quantifying the relationship between phenomena of the internet era. (2013). Scientific Reports, 3(1), 3415. [CrossRef] [PubMed]. https://doi.org/10.1038/srep03415
- Kristoufek, L. (2015). What are the main drivers of the bitcoin price? Evidence from wavelet coherence analysis. PLoS One, 10(4), e0123923. https://doi.org/10.1371/journal.pone.0123923
- Kruckeberg, S., & Scholz, P. (2020). Cryptocurrencies as an asset class. Cryptofinance and Mechanisms of Exchange, 1–28. https://doi.org/10.1007/978-3-030-30738-7_1
- Kumah, S. P., & Odei-Mensah, J. (2022). Do cryptocurrencies and crude oil influence each other? Evidence from wavelet-based quantile-in-quantile approach. Cogent Economics and Finance, 10(1). https://doi.org/10.1080/23322039.2022.2082027
- Kyriazis, N., Papadamou, S., & Corbet, S. (2020). A systematic review of the bubble dynamics of cryptocurrency prices. Research in International Business and Finance, 54, 101254. https://doi.org/10.1016/j.ribaf.2020.101254
- Laboure, M., & Reid, J. (2020, January). Download Pdf. Www.dbresearch.com. https://www.dbresearch.com/PROD/RPS_EN_PROD/PROD0000000000504589/The_Future_of_Payments__Part_III__Digital_Currenc.pdf?undefined&realload=~3dDXaroXw8bxXN5kfwh2pkWvo0aWUOG4B08aFqIY1JeypAZL8QTM~8nycqNZ~R0
- Li, X., & Wang, C. (n.d.). The technology and economic determinants of cryptocurrency exchange rate: The case of bitcoin. Decision Support Systems, 95, 49–60. https://doi.org/10.1016/j.dss.2016.12.001
- Madichie, C. V., Eze, A. E., Orji, C. A., & Maduka, O. D. (2020). Estimation of import demand elasticities for Nigeria: Implications for the balance of payments adjustment policies. IOSR Journal of Economics and Finance, 11(4), 01–08.
- Matteo, D. (2015). All you need to know about bitcoin. Times of Tndia-Economic Times. https://en.wikipedia.org/wiki/Cryptocurrency#cite_note-3
- Mikhaylov, A. (2020). Cryptocurrency market analysis from the open innovation perspective. Journal of Open Innovation, Technology, Market, and Complexity, 6(4), 197. https://doi.org/10.3390/joitmc6040197
- Nakamoto, S. (2008). Bitcoin: A peer-to-peer electronic cash system. Available online: http://bitcoin.org/bitcoin.pdf.
- Narayanan, A., Bonneau, J., Felten, E., Miller, A., & Goldfeder, S. (2016). Bitcoin and cryptocurrency technologies: A comprehensive introduction. Princeton University Press. ISBN 978-0-691-17169-2.
- Nasir, M., Huynh, T. L., Nyuyen, S. P., & Duong, D. (2019). Forecasting cryptocurrency returns and volume using search engines. Financial Innovation, 5(2). https://doi.org/10.1186/s40854-018-0119-8
- Ng, S., & Perron, P. (2001). Lag length selection and the construction of unit root tests with good size and power. Econometrica, 69(6), 1519–1554. https://doi.org/10.1111/1468-0262.00256
- Odell, M. (2015). A solution to bitcoin’s governance problem. Tech Crunch. https://techcrunch.com/2015/09/21/a-solution-to-bitcoins-governance-problem/
- Ozturk, S. S. (2020). Dynamic connectedness between bitcoin, gold, and crude oil volatilities and returns. Journal of Risk and Financial Management, 13(11), 275. https://doi.org/10.3390/jrfm13110275
- Palombizio, E., & Morris, I. (2012). Forecasting exchange rates using leading economic indicators. Open Access Scientific Reports, 1(8), 1–6. https://doi.org/10.4172/scientificreports
- Pesaran, M. H., Shin, Y., & Smith, R. J. (2001). Bounds testing approaches to the analysis of level relationships. Journal of Applied Econometrics, 16(3), 289–326. https://doi.org/10.1002/jae.616
- Polansek, T. (2016). CME, ICE prepare pricing data that could boost bitcoin. Reuters. https://www.reuters.com/article/us-cme-group-bitcoin-idUKKCN0XT1G1
- Poyser, O. (2017). Exploring the determinants of bitcoin’s price: An application of bayesian structural time series. PhD Dissertation. Universitat Autònoma de Barcelona. https://www.researchgate.net/publication/317356728_Exploring_the_determinants_of_Bitcoin's_price_an_application_of_Bayesian_Structural_Time_Series
- Raval, S. (2016). Decentralised applications: Harnessing bitcoin’s blockchain technology. O’Reilly Media, Inc. ( ISBN 978-1-4919-2452-5)
- Sagona-Stophel, K. (2016). Bitcoin 101 white paper.
- Santoni, G. J. (1987). The great bull markets 1924–29 and 1982–87: Speculative bubbles or economic fundamentals? Federal Reserve Bank of St Louis Review, 69, 16–29. CrossRef. https://doi.org/10.20955/r.69.16-30.bbg
- Schwert, G. W. (2003). Anomalies and market efficiency. Handbook of the Economics of Finance. https://doi.org/10.1016/S1574-0102(03)01024-0
- Shariati, K. (2022). The influence of gold market on bitcoin prices. Jonkoping International Business School – Jonkoping University.
- Sifat, I. (2021). On cryptocurrencies as an independent asset class: Long-horizon and COVID-19 pandemic era decoupling from global sentiments. Finance Research Letters, 43, 102013. https://doi.org/10.1016/j.frl.2021.102013
- Sovbetov, Y. (2018). Factors influencing cryptocurrency prices: Evidence from bitcoin, ethereum, dash, bitcoin, and monero. Journal of Economics and Financial Analysis, 2(2), 1–27. https://doi.org/10.1991/jefa.v2i2.a16
- Taker, D., Teker, S., & Ozyesil, M. (2020). Macroeconomic determinants of cryptocurrency volatility: Time series analysis. Journal of Business and Economic Policy, 7(1), 65–77. https://doi.org/10.30845/jbep.v7n1a8
- Tapscott, D., & Tapscott, A. (2016). Blockchain revolution: How the technology behind Bitcoin is changing money, business, and the world (pp. 432). Portfolio.
- Vidal-Tomás, D. (2022). All the frequencies matter in the Bitcoin market: An efficiency analysis. Applied Economics Letters, 29(3), 212–218. https://doi.org/10.1080/13504851.2020.1861196
- Vidal-Tomás, D., Ibáñez, A. M., & Farinós, J. E. (2019). Weak efficiency of the cryptocurrency market: A market portfolio approach. Applied Economics Letters, 26(19), 1627–1633. https://doi.org/10.1080/13504851.2019.1591583
- WIRED. (2017). Ex-googler gives the world a better bitcoin.
- Yang, S. (2018). Want to keep up with bitcoin enthusiasts? learn the lingo. The Wall Street Journal. https://www.wsj.com/articles/want-to-keep-up-with-bitcoin-enthusiasts-learn-the-lingo-1517394601
- Yu, M. A. (2020). Cryptocurrency market development: Hurst method. Finance: Theory and Practice, 24(3), 81–91. (In Russ.). https://doi.org/10.26794/2587-5671-2020-24-3-81-91
- Zivot, E., & Andrew, D. W. K. (1992). Further evidence on the great crash, the oil price shock and the unit root hypothesis. Journal of Business and Economics Statistics, 10(3), 251–270. https://doi.org/10.1080/07350015.1992.10509904
