
 ?Mathematical formulae have been encoded as MathML and are displayed in this HTML version using MathJax in order to improve their display. Uncheck the box to turn MathJax off. This feature requires Javascript. Click on a formula to zoom.
Abstract
The Nontraditional Agricultural Exports (NTAE) sub-sector is a key contributor to agricultural gross domestic product (GDP) in several developing countries. It has the potential to create jobs and contribute to enhancing food and nutrition security, hence an important pillar to the economies of several countries including Ghana. This study, therefore, examines the factors driving the growth of nontraditional agricultural exports in Ghana using an Autoregressive Distributive Lag (ARDL) model. The study was based on secondary data from the World Development Indicators (WDI) and Food and Agriculture Organization (FAO). The study identified real GDP to be a significant determinant of NTAE’s growth in both contemporaneous and lag forms. Other variables including inflation, gross capital formation and foreign direct investment influence NTAE’s growth through their lag values. Exchange rate, inflation and RGDP significantly determine the growth of NTAEs in the long-run. The study further identified a co-integrating relationship between NTAE and other explanatory variables. The Error Correction Model showed an adjustment speed of 0.41, indicating that 41% adjustment will occur within the first year and it will take 2.4 years for the system to return to equilibrium in the long-run. Based on the findings, the study recommends that Ghana Export Promotion Authority (GEPA) adopts promotional strategies including providing incentive packages to farmers, exhibitions and trade fairs to curtail the declining trend in the growth of the NTAE’s sector. The Ministry of Food and Agriculture (MoFA) should educate farmers on the use of acceptable agronomical practices in the production field. Lastly, Ghana Investment Promotion Center (GIPC) and MoFA should collaborate to identify strategic areas for domestic support and foreign direct investment in the NTAE’s sub-sector to ensure it grows and contributes towards socio-economic development in Ghana.
1. Introduction
The Export-Led Growth Hypothesis (ELGH) ascribes exports as an important determinant of economic growth. Exports of products and services provide the government with revenue, provide employment and income to exporters and thus boost foreign exchange reserves, which lead to national development (Hinson & Sorensen, Citation2006). Exports play a role in increasing technological advancement, widening the capital market and liberalizing trade worldwide (Ibid). Gupta and Yang (Citation2006) reckon that emerging market economies such as India, China and the developed East Asian “Tigers” achieved remarkable success in economic growth because they prioritized export diversification. This was done by widening their export baskets to include differentiated goods and services in many markets across the world.
There is a long-established custom where most economies in Africa struggled over the years to gain relevance in the international market due to over-dependence on primary or raw commodities which are affected by price volatility and low market demand in the international markets (Verter, Citation2017). African economies often rely on few exports, usually not processed or partly processed for foreign exchange.
The African continent’s trade in goods and services amounted to only 3% of the world exports value and this translates into US$ 462 billion out of the world exports value of US$19 trillion [United Nations Conference on Trade and Development (UNCTAD, Citation2021)]. It is interesting to note that some individual countries’ merchandised exports were more than that of the whole African continent’s global share of exports (UNCTAD, Citation2015). China recorded 13.7% of the value of global exports, Germany 8%, Japan 3.8%, the United States of America (USA) 9.1%, the Netherlands 3.4%, the United Kingdom (UK) 2.8% and 2.5% for Canada. These individual countries’ share of global exports was more than that of Africa’s share of 2.4%. Gupta and Yang (Citation2006), intimate that global trade increased by 75% of the world rate, but the situation is different for Africa, where trade in exports lags in comparison with other developing economies in Europe and Asia with more than 65% of the continent’s exports being primary commodities (e.g. fuel and agricultural products).
The contribution of the African continent to world trade continues to decline as the whole continent contributes less than 3% to global exports. The diminishing contribution of Africa to international trade has contributed to worsening poverty in Africa (Verter, Citation2017). This situation calls for Africa to renew its efforts at widening or diversifying its exports to include non-traditional exports (NTE) and to venture into new markets. Thus, the need to diversify into non-traditional exports is recognized as a viable strategy for stabilizing the economy and stimulating the required economic development in African countries.
Ghana focused on expanding exports as a growth strategy since independence (Baah-Nuakoh et al., Citation1996) and this was heightened in the era of the implementation of the structural adjustment programme (SAP) as part of the International Monetary Fund (IMF) and World Bank directed economic policies. Export-led growth policies were particularly pursued under structural adjustment programmes in developing countries (Baah-Nuakoh et al., Citation1996) in light of the significant contribution of exports to economic growth and development.
As part of Ghana’s export diversification policy strategy, efforts were geared towards building the NTE sector to enhance the economic prospects of the nation. The strategy was to discourage the importation of foreign products, encourage exports and promote the consumption of products produced in Ghana [Ministry of Trade and Industry (MoTI, Citation2012)]. In pursuant of the trade policy, Ghana in the year 2018 expanded the implementation modules of the Planting for Food and Jobs (PFJ) programme to include “Rearing for Food and Exports (RFE)” and “Planting for Export and Rural Development (PERD)” to structurally transform the economy to address the issues of job creation and food insecurity in the country [Ministry of Food and Agriculture (MoFA, Citation2019)].
NTAE is seen as a significant component of Ghana’s overall exports. Trade statistics from Ghana Export Promotion Authority, GEPA (Citation2020) reveal that Ghana’s exports grew by 3.81% from 2015 to 2019 and its total exports increased by 8.53% in 2019. During this period (2015–2019), Ghana’s NTAE grew at a rate of 2.97% annually with an average contribution of 19.6% to total national merchandise exports over this period. The NTAE’s contributions to total national exports were 20%, 23%, 18%, 19% and 18 in 2015, 2016, 2017, 2018 and 2019, respectively (GEPA, Citation2020).
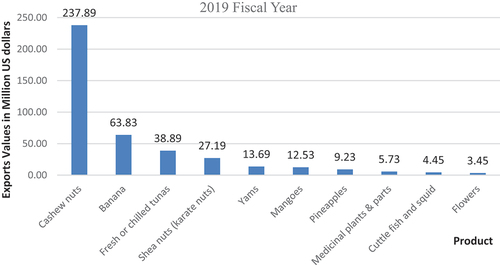
Statistics from GEPA (Citation2019) show that the NTAE subsector significantly contributes to Ghana’s export earnings. Based on individual commodities, cashew came top as the highest contributor among all NTAE commodities in 2018 and 2019 in terms of the value of commodities exported. Flowers also posted significant contributions in terms of revenues among the top 10 products of the NTAE subsector and this accounts for 0.80% of the total subsector earnings registering a growth rate of 40.64% as compared to 2018. Shea nuts exports’ earnings increased marginally (92.79%) in 2019 relative to 2018 while yam had a growth of 58.8% in 2019 in value relative to its 2018 exports. Pineapples, bananas, mangoes, medicinal plants and parts, and fresh/chilled tunas experienced a reduction in growth in 2019 as compared to 2018 (as indicated in Figure ) but still contributed greatly to merchandised exports in Ghana as shown in Figure .
Figure 1. Top Ten NTAE products growth in percentage terms in 2019 Relative to 2018 Figures. Source: Authors’ estimation from GEPA (Citation2019) Statistics.
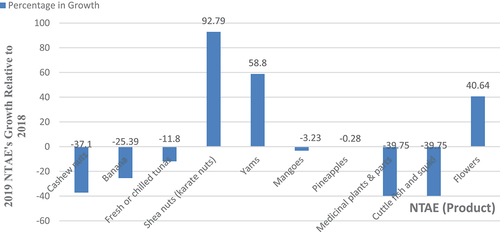
Figure 2. Top Ten NTAE products contributions to overall merchandized exports in 2019. Source: Authors’ estimates from GEPA (Citation2019) Statistics.
It can be seen from the above statistics that the growth in the NTAE subsector is fluctuating in terms of individual commodities and some cases the entire NTAE in Ghana. While anecdotes of determinants of NTAE’s growth has been linked to certain factors including market expansion and hike in prices of close substitutes (GEPA, Citation2020), efforts to ascertain the factors behind this growth from an empirical perspective are very faint. As such Apalatoya (Citation2018) empirically examined the determinants of NTE’s growth in Ghana using data from 1983 to 2016. The author, however, used the entire nontraditional exports of Ghana in the analysis. This current study, therefore, focused on the nontraditional agricultural exports sector. This study is significant because much of the discussions has centered on traditional agricultural exports with cocoa taking the center stage. Moreover, discussions on the NTAE’s growth are centered around public discourses in Ghana with infinitesimal empirical content. The study seeks to achieve the following objectives; 1. Empirically examine the determinants of NTAE’s growth in Ghana using macroeconomic data from 1961 to 2019. 2. Inform and shape policy towards promoting the growth of the NTAE subsector to stimulate overall economic growth in Ghana. The rest of the paper is structured as follows; empirical review of literature, methodology, discussion of results and conclusion and recommendations.
2. Empirical review
Several empirical studies indicate the existence of a positive correlation between economic growth and NTAE. However, the question of what determines NTAE’s growth varies from country to country and also depends on several factors. For instance, Dastjerdi et al. (Citation2021) used the ARDL model to investigate factors affecting the exports of Pistachio in Iran and found that GDP growth, exchange rate appreciation and bank credit had a significant positive effect on the growth of pistachio export whiles increased banks’ liquidity significantly inhibited the growth of pistachio export in Iran.
Similarly, using the ARDL approach to examine linkages between energy consumption, industrialization, carbon emission and agricultural product exports, Khan et al. (Citation2021) revealed that in the long-run, energy consumption had significant positive nexus with agricultural products export, whereas urbanization, transportation, and carbon emission deleteriously influenced agricultural products export in Pakistan. In the short-run, there was a reverse of the long-run situation where industrialization, transportation, and energy consumption impacted positively on the export of agricultural products with carbon emission and urbanization posing a deleterious impact on the export of agricultural products.
Apalatoya (Citation2018) revealed that NTE’s growth in Ghana is influenced by low transportation costs, common border and language, political stability, rule of law, absence of violence, and high level of trade openness of the importing countries. The study further posited that NTE’s growth is positively influenced by Ghana’s GDP expansion, trading partners’ population and as well as their GDP and adversely influenced by regulatory quality control.
Wang et al. (Citation2022) also used the gravity model to examine the export potential of Kazakhstan’s grains exports. As part of the influencing factors that determine the quantum of grains exports in Kazakhstan, the study identified Kazakhstan’s level of economic development and economic distance as significant factors that positively influenced the country’s grains export whereas geographical distance and difference in per capita GDP served as impediments to Kazakhstan’s grains exports. Factors such as common border, and geographical and political distance, however, were no significant determinants of Kazakhstan’s grains exports.
Similarly, Son et al. (Citation2021) explored the factors affecting the exports of agricultural products in Vietnam employing the gravity model and identified among other factors that Vietnam’s GDP, economic development, exchange rate, population, the openness of the economy, and the exporting country’s membership to World Trade Organization (WTO) exerted a positive and significant impact on agricultural exports turnover in Vietnam. The study further found that the size of agricultural land and the distance between the agricultural products and the importing country impacted negatively on Vietnam’s agricultural exports.
In a related study, Khan et al. (Citation2020) deployed the ARDL approach to reexamine factors that affect agricultural product exports in Pakistan. The co-integration test showed a long-run relationship between agricultural product exports and the hypothesized variables such as agricultural credit, cereal production, population, area sown, FDI and agricultural employment. The study revealed that only the area sown (cultivated land size) and cereal production had a positive significant impact on agricultural product exports and this impact was only seen in the short-run. None of the hypothesized variables had a significant effect on agricultural product exports in the long-run. The study further examined the causal relationship between agricultural product exports and the aforementioned hypothesized variables. The authors discovered a unidirectional or one-way causality running from cereal production to agricultural export products without reverse causality. A unidirectional causality was also revealed from agricultural product export to population, and FDI to population.
Mabeta (Citation2015) employed Granger causality test to examine the causal relationship between hypothesized variables and NTAE growth in Zambia using cotton and tobacco exports as a case study. The results indicated that these two products (cotton and tobacco) exhibited causality in one way, that is, from agricultural GDP share to the exports of agricultural products.
Abdullahi, Aluko, et al. (Citation2021) showed that Nigeria’s agri-food exports are influenced by GDP of Nigeria and that of her trading partners’, importers’ population, EU membership, ECOWAS membership and contiguity. They further posited that bilateral distance, domestic population, exchange rate, and language have a deleterious impact on agri-food exports in Nigeria.
Eliakim (Citation2020) investigated exchange rate effects on Tanzania agricultural exports using WDI time series data for the period 1997–2018 and employed OLS estimation technique. The findings indicated an inverse relationship between foreign exchange rates and agricultural exports in Tanzania. Johansen co-integration test showed Tanzania’s agricultural exports and exchange rate were related in the long-run.
Abdullahi et al. (Citation2021) reckoned that several variables affect Nigeria’s agri-food exports to European Union (EU). They posited that GDP of Nigeria and her trading partner’s GDP remain significant factors that influence Nigeria’s exports to the EU. The per capita GDP of both countries and Nigeria’s exchange rate have a deleterious impact on Nigeria’s agricultural food export to EU with distance positively influencing the quantity or volume of food Nigeria exports to the EU.
Boafo (Citation2019) analyzed the factors that drive agricultural exports using the political ecology approach and focused on cashew production. The results revealed that historical legacies, global market/trade integration and government policy narratives are drivers of the commodification of domestic agriculture in Ghana.
Mojahed et al. (Citation2021) used a fixed and random effects model to show that neighboring countries’ GDP significantly and positively impacted agricultural exports from Iran while the exchange rate and the ratio of prices of neighboring countries negatively impacted agricultural exports from Iran. Fayisa (Citation2021) examined the factors that determine East African exports using a panel ARDL approach with heterogeneous panel data. The study revealed that trade openness, RGDP, supply of labour, domestic demand and GCF significantly affect agricultural exports in East Africa in the short-run. Also, in the long-run, factors such as GCF, FDI, final consumption, RGDP of importing and exporting countries and trade openness significantly affected the performance of East African exports.
In sum, it is evident from the empirical evidence presented above that the factors determining NTAE’s growth vary from country to country. This may be related to specific national policies, geo-politics and regional economic policies. The authors contend that there is a paucity of empirical studies in the Ghanaian context in relation to the topic of NTAE growth. The sectoral and geographical distinction or segregation has created a contextual research gap. This study is therefore significant and justified to fill this important research gap. Thus, we find it prudent to conduct this study to ascertain which factors influence NTAE’s growth in Ghana and its socioeconomic implications for national development.
3. Methodology
3.1. Data sources and collection methods
The study utilized secondary data which covered the period 1961 to 2019 obtained from the World Development Indicators (WDI) of the World Bank. The variables obtained include real gross domestic product (RGDP), gross capital formation (GCF), foreign direct investment (FDI), inflation and exchange rate. Additional data were sourced from the division of the Food and Agriculture Organization (FAO) trade statistics (Trade Indices 81) for the period 1961–2019. The data included aggregated values of non-traditional agricultural commodities such as vegetables, pineapple, banana, and cashew are used as a proxy for NTAE.
3.2. Description of the variables
Table contains the description of the variables alongside their expected signs.
Table 1. Explanatory variables and their a prior expectations
3.3. Non-Traditional Agricultural Exports (NTAE)
NTAE are agricultural products which were previously not exported but are recently exported and are regarded as agricultural products that are outside the traditional exports. From the Ghanaian perspective, nontraditional agricultural exports are exports of all agricultural commodities except cocoa beans and timber/lumber. Any product outside this bracket is classified as NTAE. The major NTAE products in Ghana include shea nuts, yam, cashew, medicinal plants and pineapples (GEPA, Citation2019). For this study, NTAE is referred to as the total sum of exports from the following products; banana, pineapple, cashew and vegetables. These products were chosen based on the availability of data that is deemed long enough for this kind of study.
3.4. Real Gross Domestic Product (RGDP)
RGDP is a measure of the value of economic output produced within the borders of a nation without considering the nationals involved in its production with inflation-adjusted for. In its calculation, capital consumption allowances such as depreciation are not adjusted for. GDP measures the health of a country’s economy and healthy economies tend to attract and promote trade. An increase in GDP is expected to impact exports positively. GDP is widely used in international literature as a trade variable. Several studies including Apalatoya (Citation2018), Son et al. (Citation2021) and Fayisa (Citation2021) identified GDP as a determinant of trade.
3.5. Gross Capital Formation (GCF)
This is described as investments realized in an economy emanating from the government and the private sector. These include investments in the local economy through citizens’ contributions geared towards boosting production units. GCF as an investment is expected to enhance trade openness. Investment increases the competitive advantage of firms and national output and thus GCF is expected to exert a positive effect on trade. Similar studies including Urriola et al. (Citation2018) and Mabeta (Citation2015) included GCF as a variable which influences international trade.
3.6. Exchange Rate (EXCR)
Exchange rate is simply the rate at which one currency exchanges for another currency. EXCR used here is a measure of the Ghanaian Cedi for the US dollar over a period of time. The United States dollar is used because it is considered the most easily traded currency in international transactions. Depreciation of the currency makes exports cheaper and reverse for appreciation. So, we expect the exchange rate to have an inverse relationship with exports.
3.7. Inflation Rate (INFL)
Inflation is the general increase in prices of goods and services over a given period. Consumer Price Index (CPI) is an indicator of inflation which measures the prices of a basket of goods and services consumed by households. Ghana Statistical Service is the mandated state body that calculates inflation for the country and this is usually done on a monthly basis. This study used annual averages calculated from monthly rates. There are mixed empirical findings on the relationship between inflation and agricultural export growth. Jacob et al. (Citation2021) found a positive impact while Alagidede and Ibrahim (Citation2017) found a negative relationship. Inflation reduces the purchasing power of consumers by reducing their real income that translates into a reduction in the quantities of commodities consumed. A reduction in aggregate consumption thus leads to a decrease in exports. Inflation causes an increase in production costs and decreases output which eventually affects the quantum of exports. Inflation therefore will impact negatively on export growth.
3.8. Foreign Direct Investment (FDI)
Foreign direct investment (FDI) simply refers to investments from foreigners into businesses in another country with the intent of establishing a lasting relationship. FDI is investment from citizens of other countries, and this will lead to the creation of outputs in the economy hence its inclusion in the study. It is expected that FDI will impact exports in a positive sense.
4. Empirical method
4.1. Least square method
We examined the developmental trajectory (trend) of NTAE for the period of the study, using least square inferential trend analysis methods. Specifically, the study employs the quadratic trend technique of the least square method to ascertain the trajectory of NTAE’s growth. This method was employed because it provides means for the trend of the variables to be ascertained inferentially unlike line graphs where there is no room for inferential statistics.
4.2. Unit root/stationarity test
The stationarity property of time series data is very important in time series analysis. Before the appropriate model was adopted for the study, we run stationarity tests employing Augmented Dickey Fuller (ADF), Philips-Perron (PP), and Generalised Dickey Fuller (GLS-DF) tests. A stationarity test is not a requirement for ARDL models, however, it may be prudent for one to have the assurance that no variable is integrated in the second order, as this will nullify the bound test assumption (Pesaran et al., Citation2001). The Stationarity test takes the following form;
(Variable is not stationary)
(Variable exhibits stationarity)
Variables can exhibit stationarity at levels I(0) and at first difference I(1) and given that the series in equation 1 is not stationary at the levels, it will imply that the first differential of it will be stationary. This can be written as;
4.3. Techniques of data estimation/model selection
The study employed the ARDL technique to estimate the determinants of NTAE’s growth in Ghana. This approach is akin to the use of the least square estimation procedure. The reason for the choice of this estimation technique is that the technique can function well irrespective of the integration or stationarity level of the variables (whether I(0) or I(1)). This technique is efficient and produces unbiased estimates and for that matter can be used in achieving the study’s objective. The ARDL technique has proven to be efficient and provides estimates which are unbiased with reliable t-statistic irrespective of the occurrence of endogeneity of some regressors (Haris & Sollis, Citation2003). The problem of endogeneity is resolved when the appropriate lag is selected and the residual correlation is amputated (Ali et al., Citation2016). The ARDL method has also proven efficient when used for small sample sizes (Pesaran et al., Citation2001). Empirical evidence from many researchers such as Dube et al. (Citation2018), Mabeta (Citation2015), and Ikechukwu (Citation2021) in the domain of economic relationships produced very efficient, unbiased and satisfactory results which are acceptable and this underscored the choice of the estimation technique.
The model specified in Eqn. 3 below was employed in the data analysis to obtain non-zero numerical values to ascertain the predictability of the model. This model segregates the determinants of NTAEs’ growth into short-run and long-run determinants. The extended version of the Solow model was used to estimate the determinants of NTAE’s growth in Ghana. The Solow model takes the following form;
Where, Y, K, L and A are output, capital, labour and technology respectively. For the purpose of this study
To avoid the use of difference in units of measurement, the natural log is used. Equation 5 is then transformed into logarithmic terms and specified as follows;
4.4. Test for cointegration using ARDL bound test
The study examined cointegration by testing if the variables (dependent and independent) are related in the long-run. The ARDL Bound test is used to examine whether there exists a long-run relationship between NTAE, RGDP, INFL, EXCR and FDI. The ARDL bounds approach is specified as follows;
where LNRGDP represents the logarithm form of Real Gross Domestic Product, LNNTAE represents the logarithm form of Non-Traditional Agricultural Exports, LNINFL is the logarithm form of Inflation, LNEXCR, is the logarithm form of Exchange Rate, LNGCF is the logarithm form of Gross Capital Formation, LNFDI is the logarithm form of foreign direct investment, and is the error term. Cointegration was tested using the ARDL Bounds-test with the null hypothesis indicating the betas are jointly equal to zero (
.
The presence of cointegration or otherwise can be determined by the Bounds-test of Pesaran et al. (Citation2001) using the F-values and t-values, one for the lower bound and the other for the upper bound. Cointegration is detected when the computed F and t values are higher than their critical values for the upper bound. However, when the computed F and t values are lower than the critical value of the lower bound, it implies that there is no cointegration. However, the test becomes inconclusive when the computed F and t values are in between the lower and the upper bounds.
4.5. Error Correction Model (ECM)
Error correction model is estimated when cointegration is confirmed and it is to ascertain how quick long-run equilibrium will be restored. When the sign of the coefficient is negative and significant, it shows there will be convergence in the long-run while a positive coefficient depicts an explosion. Thus, the study estimated the ECM to determine the speed of adjustment, which shows how quickly the series will return to its equilibrium position when a displacement occurs.
The ECM for the purpose of this study is written as:
denotes adjustment speed and shows the time period within which equilibrium will be restored after a displacement.
4.6. Diagnostics test
It is important to conduct prior and post-estimation test diagnostics to ensure that the results are valid and reliable. A prior estimation technique (stationarity test) was conducted to understand if the underlying time series variables are not integrated into order two. There is also a need to conduct post estimation tests for econometric problems including serial correlation, heteroscedasticity, normality, multicollinearity, and so on to ensure that the results are robust and reliable. Breusch Godfrey test is done to detect serial correlation, Breusch-Pagan Godfrey test is to detect heteroscedasticity, Jarque Bera tests for normality while Cumulative Sum (CUSUM) and Cumulative Sum of Squares (CUSUM SQUARES) are tests for model stability.
5. Empirical results
5.1. Developmental trajectory (trend) of NTAE from 1961 to 2019 – least squares method
Quadratic/exponential trend analysis was employed to ascertain the developmental trajectory of NTAE in Ghana. The results as indicated in Table shows that NTAE trend is declining.
Table 2. Trend analysis for NTAE-Least Squares method
The coefficient of the variable TREND^2 is −0.0138 and significant at 1% implying NTAE growth trend is increasing at a decreasing rate. This finding is similar to the results of Apalatoya (Citation2018) who found a decreasing trend in the growth of NTE value in Ghana.
Results of the analysis reveal that the decline in NTAE export is attributed to the decline in production over the years and this finding corroborates with data from the GEPA (Citation2020) which indicate that NTAE performance declined in 2019 due to a decline in production, standardization, regulatory and marketing problems. Ghana’s largest market destination for NTAE is the European Union (EU). In 2015, the EU banned vegetable exports from Ghana due to contamination. There are also threats from the EU concerning the inappropriate use of agrochemicals in vegetable and fruit production. These and other issues may account for the declining NTAE growth rate in Ghana.
5.2. Unit root test
The study employed Augmented Dickey Fuller (ADF) test, Philips Perron (PP) test and Generalised Dickey Fuller test (GLS-DF) to ascertain the level of stationarity or the order of integration of the variables. The results of the unit root test are presented in Table . The tests reveal that only inflation is an I(0) variable; the other variables such as LNRGDP, LNNTAE, LNEXCR, LNGFC and LNFDI are stationary at first difference. This implies that there is integration of the variables at different orders (I(1) and I(0)). The essence of this test is to avoid a situation where any of the variables is stationary or integrated at order two, I(2).
Table 3. Unit root test
5.3. ARDL bounds test (cointegration test)
The bounds test results are presented in Table and indicate that there is cointegration. The F-statistic value of 5.67 is greater than I(1) bound value of 4.15 at 1% significance level implying that there is a long-run relationship. The null hypothesis therefore is refuted at 1% significant level, and we conclude that NTAE and the independent variables are related in the long-run.
Table 4. ARDL bounds test approach to cointegration
5.4. Short run factors affecting NTAE growth based on the ARDL model
The short-run factors that affect the growth of NTAEs based on the ARDL model are presented in Table . It shows that in the short-run, RGDP and the second lag affect the growth of NTAE. The results show that a 1% increase in RGDP in the current period will cause an increase of 3.16% of NTAE and a decrease by 5.7% in the second lag, all other things being equal.
Table 5. Short-run factors that affect the growth of NTAE based on ARDL model
The results show that NTAE’s growth within the short-run is not contemporaneously caused by inflation but rather by previous years’ inflations. For example, an increase in both the first and second lag terms of inflation by 1% each decrease NTAE growth by 0.34% and 0.23%, respectively, in the short-run, ceteris paribus.
In the short-run, the current GCF has no significant effect on NTAE’s growth but the effect is rather from the previous years’ GCF. The result is plausible since previous years’ gross capital formation is anticipated to have a greater effect on export growth relative to the current level of gross capital formation.
The results show that LNGCF is significant at 5% in the first lag while it is significant at 1% in the second lag implying that an increase in the first lag by 100 basis points will result in an increase of 0.46% growth in NTAE in the short-run while an increase in the second lag by same 100 basis points will cause an increase of 0.44% growth in NTAE in the short-run, ceteris paribus.
The third lag of FDI affects NTAE growth but the first and second lags do not. The third lag has a coefficient of 0.08 and is significant at 5% implying that an increase in the third lag of FDI by 1% will result in 0.08% growth of NTAE in the short-run, ceteris paribus. Interestingly, both contemporaneous and lag terms of exchange rate do not significantly affect NTAE growth in the short-run.
5.5. Error correction model
Having confirmed the presence of cointegration, we estimated an error correction model to determine the speed of adjustment. The results of the ECM as presented in Table show a coefficient of −0.4145, that is, the ECM has a negative coefficient and significant at 1%. The speed of adjustment of −0.4145 as measured by the is an indication that convergence will occur in the long-run when there is disequilibrium and it will revert to equilibrium at an adjustment speed of 41.45%.
Table 6. Results of ARDL error correction model
Overall, the independent variables jointly explain the dependent variable. The F statistic shows that the independent variables (RGDP, GCF, INFL, EXCR and FDI) explain the dependent variable (NTAE) as it is significant at 1%. R-squared (coefficient of determination) is a measure of the model fitness. The R-squared coefficient is 0.9252 and this means that 92.52% of the variations in the dependent variable are explained by the independent variables. The error term captures the remaining 7.48% of the variations in the dependent variable. Thus, the model is fit for purpose.
5.6. Factors affecting the long run growth of NTAE based on ARDL model
Since cointegration is confirmed, the study further estimated factors influencing NTAE growth in the long-run as shown in Table . In the long-run, the growth of NTAE is significantly influenced by three economic variables (RGDP, INFL and EXCR). From the results in Table , a percentage change in RGDP will significantly result in the growth of NTAE by 5.02%. NTAE growth will increase by 1.34% when inflation increases by one per cent, ceteris paribus. When the domestic currency (Ghanaian Cedi) appreciates, the growth in NTAE will decline. When the Ghanaian Cedi appreciates by one per cent, NTAE growth will be negatively affected and will decrease approximately by 0.30%.
Table 7. Factors affecting the growth of NTAE in the long run
5.7. Diagnostics
Diagnosis tests as indicated in the previous section are necessary as they indicate whether the model best fits the data and will produce reliable results for policy and academic discourses. Firstly, serial correlation was tested with the Breusch–Godfrey method. The F-statistic had a probability value of 0.2961 at 5% significance level which indicates a rejection of the null hypothesis that there is no serial correlation and thus the model is free of serial correlation. The Breusch-Pagan-Godfrey test was performed to check if there is heteroscedasticity. The probability value of the F-statistic is 0.9309 which is greater than the probability value of 0.05 implying the model is not suffering from the problem of heteroscedasticity. Results for the normality test show that the model has a normal distribution as indicated by Jaque-Bera statistic of 0.0248 with a probability value of 0.9859 which is greater than the 5% significance level. This means that the model follows a normal distribution, and we can confidently say that the model satisfies the normality assumption and is deemed appropriate. The results are presented in table .
Table 8. Diagnostic test results
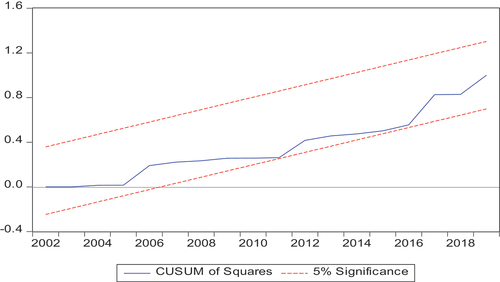
5.8. Stability test
The stability tests from CUSUM and CUSUM of SQUARES are presented in Figures . Both graphs reveal that the model is stable as it lies within the 5% significance boundary.
Figure 3. CUSUM test graph.
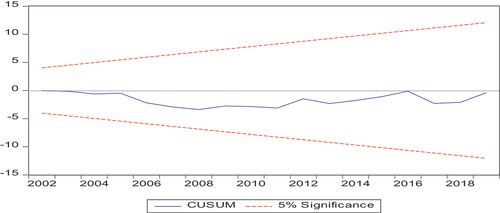
Figure 4. Graph of CUSUM squares.
6. Discussion of results
The study examined the determinants of NTAE growth in Ghana relying on macroeconomic variables to ascertain which factors influence the growth of NTAE in Ghana. The following macroeconomic factors were identified as influencing the growth of NTAE in Ghana and these are discussed below. RGDP significantly and positively influence the growth of NTAE in the short and long run indicating that as Ghana’s GDP increases, NTAE growth will also increase, ceteris paribus. This is unsurprising as indicated earlier; GDP measures the strength of an economy and an increase in GDP will influence a lot of economic activities including trade. This may account for the positive impact of GDP on NTAE. This finding is not in isolation as Dastjerdi et al. (Citation2021) found that Iran’s GDP positively influenced its pistachio exports. The findings are also consistent with Fayisa (Citation2021) and Mojahed et al. (Citation2021) whose findings showed that RGDP positively impacts exports in East Africa and GDP positively affects the expansion of agricultural exports in Iran respectively. In the Ghanaian context, the result of the study is consistent with Apalatoya (Citation2018) who found that NTE, in which NTAE is a component, increases with the growth of Ghana’s GDP.
The findings regarding inflation-NTAE nexus show that inflation positively impacts NTAE growth in Ghana which is consistent with the results of Jacob et al. (Citation2021) who revealed that inflation positively impacts India’s agricultural exports. This finding is, however, contrary to the results of Eliakim (Citation2020) who found that inflation does not cause a significant influence on Tanzania’s agricultural exports performance. Inflation influences the growth of NTAE through exchange rate and elasticity of NTAE. When there is an increase in inflation, the country’s value of currency erodes as compared to her trading partners and this causes depreciation of the currency thus making her exports cheaper as compared to domestic products of the market where the exports are sent to and increase the demand for exports.
Further, the Marshallian demand theory indicates that an increase in inflation will reduce demand as it increases the cost of production resulting in costlier exports to the international market. Ceteris paribus, when prices are higher due to high production costs, demand reduces and this negatively affects NTAE growth. This assumption is true for goods, which are elastic in demand but in situations where demand for the good is inelastic, an increase in price leads to a reduction in quantity demanded in a relatively smaller proportion. This means that a greater price increase only leads to a smaller decrease in quantity demanded which will make exporters to earn more from price hikes. Ghana has a comparative advantage with regard to most NTAEs due to natural endowment and this causes the demand for these products to be inelastic and which means a price increase will result in higher revenues and this may account for the positive inflation-NTAE nexus in Ghana. Exchange rate impacts negatively on NTAE growth in the long-run as captured in the study’s a prior expectation. When the domestic currency appreciates, exports become expensive and thus less competitive in the international market. Demand for exports will reduce and thus a reduction in revenues and this will negatively affect the growth of NTAE. This corroborates the findings of Eliakim (Citation2020) who found an adverse and significant relationship between exchange rate and agricultural exports in Tanzania.
The study also agrees with the finding of Mojahed et al. (Citation2021) who showed that exchange rate impacted negatively on Iran’s agricultural exports. The findings of Apalatoya (Citation2018) however showed that exchange rate did not have a significant effect on NTE’s growth in Ghana.
FDI is not a significant determinant of NTAE’s growth within the short and long-run and this is contrary to the study’s a prior expectation. One reason for this outcome may be that FDIs are not channeled to the agricultural sector as compared to the manufacturing sector even though agriculture is also a critical sector of the Ghanaian economy. The majority of Ghana’s foreign investments are channeled to the manufacturing and service sectors and little is committed to the agricultural sector, with the NTAE sub-sector almost a neglected sector in terms of FDIs. PWC (2019) showed that in the financial subsector, as of 31st December, 2018, 23 banks were in the country and 14 out of them were foreign controlled banks. The Ghanaian government’s industrialization drive seems to have attracted major automobile manufacturing companies into the country which has led to the creation of opportunities in the assembling of automobiles but not many investments go to the agricultural sector.
Ghana’s industrialization drive may account for high inflows of foreign direct investment into the country but with an insignificant contribution to the growth of non-traditional agricultural exports. This finding contradicts Dube et al. (Citation2018) who found FDI to be significant and a positive determinant of horticultural export growth in Ethiopia and Mabeta (Citation2015) who found FDI to significantly determine tobacco export growth in Zambia. The study is however consistent with the same Mabeta (Citation2015) who found FDI to be a non-significant determinant of cotton export growth in Zambia.
Similarly, GCF is not a significant determinant of NTAE’s growth in Ghana. Priority is not given to the agricultural sector in the case of huge investments and this could be the reason why gross capital formation (GCF) did not drive NTAE growth for the period of the study. For example, the road networks linking the hinterlands where NTAEs are produced are unmotorable, while producers still depend on outmoded farm implements for agricultural production. These factors and many more may account for the non-significant effect of GCF on NTAE growth.
Past literature shows that the agricultural sector attracted less than 2% of national government investments since the focus shifted to the cocoa subsector leading to a neglect of the other non-traditional export crops (Brooks et al., Citation2007; WorldBank, Citation2017). This cements the widely held view that the Comprehensive African Agricultural Development Programme (CAADEP) under the Maputo declaration for African countries to commit at least 10% of their budgets to agriculture is a mirage and far from its realization.
7. Conclusion and recommendations
The study examined the determinants of NTAE’s growth in Ghana relying on time series data for the period 1961–2019. The study included variables such as RGDP, GCF, exchange rate, inflation rate, net flow of FDI and aggregated values of some selected NTAE. Before adopting the ARDL, the study run a stationarity test to ascertain how the variables were integrated. The test results suggest that the variables are integrated in mixed order (I (0) and I (1)). The bounds test from the ARDL model indicated co-integration or long-run relationship between NTAE and the independent variables. The study revealed that in the short run, NTAE growth in Ghana is significantly affected by current and previous years’ RGDP, lag term of inflation, lag term of FDI, and lag term of GCF. However, contemporaneous form of FDI, GCF, INFL and EXCR did not significantly affect NTAE growth. This means that in the short-run, the aforementioned variables do not contemporaneously and significantly determine NTAE’s growth. In the long-run, RGDP, INFL and EXCR are significant factors affecting NTAE growth in Ghana. The ARDL results indicate that FDI and GCF do not significantly influence Ghana’s NTAE growth in the long-run. The ECM also shows an adjustment speed of 41.45% and indicates that distortions in equilibrium will be corrected within two years.
Based on the findings, the following measures are recommended to promote the growth of NTAE in Ghana. Firstly, the government should work towards reversing the decelerating trend in NTAE growth which is due to continuous deterioration in the production trend of NTAE, regulatory and marketing issues. Hence, Ghana Export Promotion Authority should urgently take measures including exhibitions and trade fairs, support services and incentives to farmers in the NTAE subsector among others to curtail the declining trend in NTAE growth. The Ministry of Food and Agriculture should also educate farmers on the use of acceptable agronomical practices in the production of nontraditional agricultural export commodities. The Ministry of Food and Agriculture should channel investment to agricultural innovations to improve production and storage as a way of soaring up NTAE exports. These measures will reverse the declining trend and make NTAE exports more attractive in global trade. Further, the government through joined collaboration between Ghana Investment Promotion Center (GIPC) and MoFA should identify strategic areas in the NTAE sector that need investment in the form of both domestic and foreign direct investments and channel the investments to those sectors to enable them to contribute significantly and positively towards NTAE’s growth in Ghana. Lastly, the government should take measures to expand the country’s GDP as the findings suggest an increase in GDP propels the growth of the NTAE sector.
Disclosure statement
No potential conflict of interest was reported by the authors.
References
- Abdullahi, N. M., Aluko, O. A., & Huo, X. (2021 8). Determinants, efficiency and potential of agri-food exports from Nigeria to the EU: Evidence from the stochastic frontier gravity model. Agricultural Economics (Zemědělská ekonomika), 67(8), 337–17. https://doi.org/10.17221/15/2021-AGRICECON
- Abdullahi, N. M., Huo, X., Zhang, Q., & Azeez, A. B. (2021). Determinants and potential of agri-food trade using the stochastic frontier gravity model: Empirical evidence from Nigeria. SAGE Open, 11(December), 1–12. https://doi.org/10.1177/21582440211065770
- Alagidede, P., & Ibrahim, M. (2017). On the causes and effects of exchange rate volatility on economic growth: Evidence from Ghana. Journal of African Business, 18(2), 169–193. https://doi.org/10.1080/15228916.2017.1247330
- Ali, H. S., Siong, H. L., & Talha, I. Z. (2016). Dynamic Impact of urbanization, economic growth, energy consumption and trade openness on Co2 emission in Nigeria. Environmental Science and Pollution Research, 23(12), 435–443. https://doi.org/10.1007/s11356-016-6437-3
- Apalatoya, P. (2018). Empirical Investigation into the Determinants of Non-Traditional Exports in Ghana: A Gravity Model of Trade Approach. University of Ghana.
- Baah-Nuakoh, A., Jebuni, C., Oduro Abena, D., & Yaw, A. (1996). Exporting Manufactures in Ghana: Is the Adjustment enough? In Overseas Development institute. African Economic Research Consortium (AERC) Research Papers Series, (3).
- Boafo, J., Appiah, D. O., & Tindan, P. D. (2019). Drivers of export-led agriculture in Ghana: The case of emerging cashew production in Ghana’s Brong Ahafo Region. Australasian Review of African Studies, 40(1), 31–52. https://doi.org/10.22160/22035184/ARAS-2019-40-1/31-52
- Brooks, J., Croppenstedt, A., & Aggrey-Fynn, E. (2007). Distortions to agricultural Incentives in Ghana distortions to agricultural incentives in Ghana (No. 47).
- Dastjerdi, N. T., Sedaghat, R., & Mohammadi, H. (2021). investigating factors affecting pistachio exports in Iran during 2001-2019. Journal of Nuts, 12(January), 1–7. https://doi.org/10.22034/jon.2021.1915854.1096
- Dube, A. K., Ozkan, B., & Govindasamy, R. (2018). Analyzing the export performance of the horticultural sub-sector in Ethiopia: ARDL bound test cointegration analysis. Horticulturae, 4(4), 34. https://doi.org/10.3390/horticulturae4040034
- Eliakim, T. (2020). Effects of Exchange Rates and Inflation Rates on Agricultural Exports in Tanzania. MSc Thesis, Institute of Accountancy Arusha.
- Fayisa, T. F. (2021). Determinants of export in East Africa: Heterogeneous panel data analysis. Journal of Finance and Economics, 9(1), 16–33. https://doi.org/10.12691/jfe-9-1-3
- GEPA. (2019). Export performance: Non-Traditional Exports (NTES) sector general performance 2018. Ghana Export Promotion Authority. www.gepaghana.org
- GEPA. (2020). Report on analysis of non-traditional export statistics.
- Gupta, S., & Yang, Y. (2006). Unblocking trade. Finance and Development-IMF Quarterly Magazine, 43(4).
- Haris, R., & Sollis, R. (2003). Applied time series modelling and forecasting. In West sussex. Wiley.
- Hinson, R., & Sorensen, O. J. (2006). E ‐ business and small Ghanaian exporters: Preliminary micro firm explorations in the light of a digital divide article information. Online Information Review, 30(2), 116–138. https://doi.org/10.1108/14684520610659166
- Ikechukwu, C. (2021). Effects of international trade on economic growth of Nigeria. International Journal of Innovative Finance and Economics Research, 9(1), 144–157.
- Jacob, T., Raphael, R., & Ajina, V. S. (2021). Impact of exchange rate and inflation on the export performance of the Indian Economy: An empirical analysis. BIMTECH Business Perspective, 1–13.
- Khan, Z. A., Koondhar, M. A., Aziz, N., Ali, U., & Tianjun, L. (2020). Revisiting the effects of relevant factors on Pakistan’s agricultural products export. Agricultural Economics (Zemědělská ekonomika), 66(12), 527–541. https://doi.org/10.17221/252/2020-AGRICECON
- Khan, Z. A., Koondhar, M. A., Khan, I., Ali, U., & Tianjun, L. (2021). Dynamic linkage between industrialization, energy consumption, carbon emission, and agricultural products export of Pakistan : An ARDL approach. Environmental Science and Pollution Research.
- Mabeta, J. (2015). Determinants of Non-Traditional Agricultural Exports Growth in Zambia: A Case of Cotton and Tobacco. MSc Thesis, Egerton University,
- MoFA. (2019). Medium term expenditure framework (MTEF) for 2019-2022.
- Mojahed, B., Syed, M. S. N., & Ali, A. E. (2021). Policy analysis the impact of GDP, the ratio of prices and exchange rate in neighboring countries on the development of agricultural exports. Technium Social Sciences Journal, 16, 261–273.
- MoTI. (2012). Ministry of trade and industry Ghana-National export strategy for the non-traditional sector 2012– 2016.
- Pesaran, M. H., Shin, Y., & Smith, R. J. (2001). Bound testing approaches to the analysis of level relationships. Journal of Applied Econometrics, 16(3), 289–326. https://doi.org/10.1002/jae.616
- Son, V., Thi, L., Nga, V., & Dat, P. M. (2021). Some factors impinging on exports of agricultural. PalArch’s Journal of Archaelogy of Egypt/egyptology, 18(7), 1599–1610.
- UNCTAD. (2015). Key Statistics and Trends in International Trade 2015. The Trade Slowdown.
- UNCTAD. (2021) . Key Statistics and Trends in International Trade 2020. Trade Trends Under the Covid-19 Pandemic. United Nations publication.
- Urriola, N. N., Rodriguez, A. A. C., & Baral, P. (2018). The impact of traditional and non-traditional agricultural exports on the economic growth of Peru: A short- and long-run analysis. Studies in Agricultural Economics, 120(3), 157–165. https://doi.org/10.7896/j.1807
- Verter, N. (2017). International trade: The position of Africa in global merchandise trade. Emerging Issues in Economics and Development, 69–88. https://doi.org/10.5772/intechopen.68897
- Wang, Y., Huang, P., Khan, Z. A., & Wei, F. (2022). Potential of Kazakhstan ’ s grain export trade. Ciência Rural, Santa Maria, 52(1), 1–15. https://doi.org/10.1590/0103-8478cr20210199
- WorldBank. (2017). Ghana: Agriculture sector policy note. (Agriculture Global Practice AFRICA AFR01, (June), 1–60.